image

Glucaric Acid Market Size, Share & Segment By Product (Pure glucaric acid, Calcium D-glucarate, Potassium sodium D-glucarate, and D-glucaric acid-1,4-lactone), Application (Food ingredients, Detergents, Corrosion inhibitors, and De-icing applications), and Region | Global Forecast 2025-2032

Date: December 2024 Report Code: SNS/C&M/4996 Page 150

Glucaric Acid Market Report Scope & Overview:

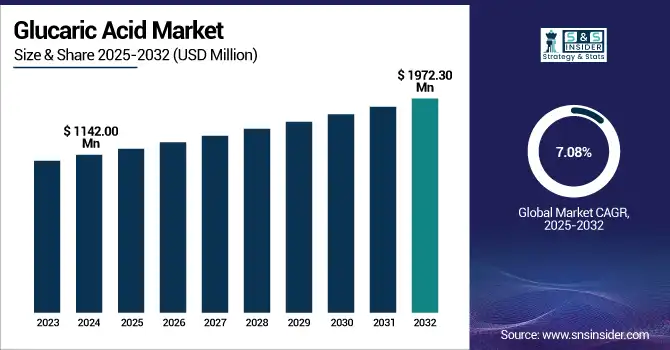
The Glucaric Acid Market size was valued at USD 1,142.00 million in 2024 and is expected to reach USD 1,972.30 million by 2032, growing at a CAGR of 7.08% over the forecast period of 2025-2032.

Glucaric Acid Market Revenue Analysis

To Get more information on Glucaric Acid Market - Request Free Sample Report

The glucaric acid market is driven by the increasing demand for sustainable chemicals in detergents, food additives, and corrosion inhibitors. As phosphates are being eliminated, biodegradable glucaric acid is emerging as a highly sought-after alternative, thereby promoting vital glucaric acid market growth. Its status as a top value-added chemical from biomass, acknowledged by the U.S. Department of Energy, is driving consistent glucaric acid market expansion. Companies such as Rivertop Renewables are working toward production, and Solugen’s USD 213.6 million DOE-subsidized Bioforge Marshall plant is expected to contribute to large increases in the glucaric acid market. Preventium by Applied Food Sciences is now GRAS approved by the FDA for food sector application.

Additionally, Montana DOT tests conducted a 70% reduction in corrosion with glucaric acid-based solutions. Such advancements are enhancing competitive advantage, making glucaric a pillar in glucaric acid market analysis, which drives global use and glucaric acid market volume worldwide.

Glucaric Acid Market Dynamics:

Drivers:

  • Expansion of Sustainable Manufacturing Platforms Accelerates Glucaric Acid Market Growth

The growing trend toward sustainable biomanufacturing platforms will stimulate the demand for glucaric acid. Solugen and similar firms were able to score a USD 213.6 million loan guarantee from the U.S. Department of Energy in 2024 to build their Bioforge Marshall facility, which was intended to build organic acids at scale. Rivertop Renewables has a similar project underway to supply the phosphate-free market. These investments are in line with the drive toward green alternatives for industrial and consumer uses. As firms incorporate innovative catalytic and fermentation techniques, the glucaric acid market share is expected to rise, enhancing its commercial potential.

  • Regulatory Endorsements and Safety Approvals Boost Glucaric Acid Market Confidence

Supportive regulations have stimulated confidence in the industry for glucaric acid. In 2024, the U.S. Food and Drug Administration gave GRAS status to Preventium for use in food formulations. The U.S. Environmental Protection Agency handed the 2019 Green Chemistry Challenge to fermentation-based glucaric acid as part of the solution for eliminating dangerous phosphate-based cleaners. These authorizations have spurred product availability and simplified market access for the regulated food, water treatment, and cleaning markets. Support from government organizations enforces confidence among the glucaric acid companies and helps expand the glucaric acid market reach to the international market.

Restraints:

  • Feedstock Supply Variability and Competition for Biomass Feedstocks Create Supply Chain Risks

The glucaric acid market is dependent on the availability of sugar and starch-based biomass, with seasonality and regionally available variations. Price volatility is often spurred by competing uses for corn and sugar in ethanol, food, and bioplastics markets. Poor harvest seasons can result in a 25% increase in biomass input costs, as reported by the National Renewable Energy Laboratory. Such instability also disrupts long-term procurement planning of glucaric acid producers and restricts the production scale. Competition for feedstock where the market increases could result in price pressure and supply tightness that would limit manufacturers' ability to provide sustained production volumes and competitiveness on a global basis.

Glucaric Acid Market Segmentation Analysis:
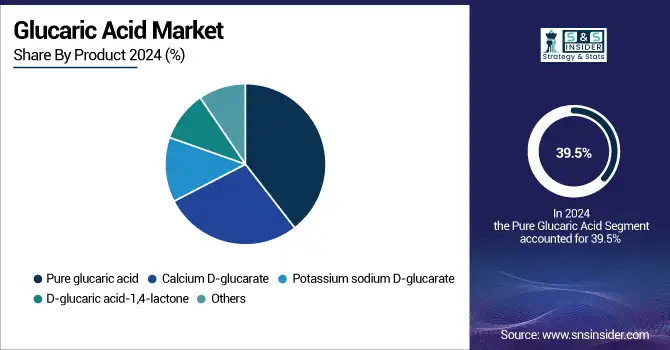
By Product

Pure glucaric acid dominated and accounted for 39.5% of the glucaric acid market in 2024. Its technical grade and purity also make it the product of choice in several applications, including detergents and agrochemicals. Rivertop Renewables has scaled to manufacture phosphate-free cleaners that comply with strict regulations, facilitating wide adoption. Montana Department of Transportation studies indicated a 70% decrease in steel corrosion when using pure glucaric acid inhibitors, confirming the performance advantage. In addition, the U.S. Department of Energy's recognition of glucaric acid as one of the "Top Value-Added Chemicals from Biomass" further highlights the strategic value of pure glucaric acid in Greenfactory's sustainable manufacturing processes.

Calcium D-glucarate achieved the highest growth rate in the glucaric acid market during the forecast period of 2025-2032 with a CAGR of 7.55%. Nutraceuticals and pharmaceutical manufacturers are increasingly using this derivative as clinical trials continue to demonstrate its capacity for supporting detoxification pathways, resulting in a surge of demand. Applied Food Sciences’ Preventium line gained FDA GRAS status, allowing for use in functional foods and beverages. Kalion Inc.'s collaboration with academic partners has resulted in increased fermentation yields, which reduce production costs and increase market access. These developments make calcium D-glucarate the fastest growing segment, areas that need to be focused upon during the glucaric acid market analysis in the future.

Glucaric-Acid-Market-By-Product

By Application

Detergents captured 37.6% of the glucaric acid market in 2024, making it the dominant application segment. Traditionally, a phosphate builder, they are replacing it with a glucaric acid-based surfactant to comply with tough environmental regulations and consumer desire for eco-friendlier cleaning products. Rivertop Renewables announced that it had worked with some of the leading laundry product companies to incorporate its bio-based formulations at commercial scale. Government agencies, such as the U.S. Environmental Protection Agency have reported reduced eutrophication from runoff from the use of glucaric acid detergents. This regulatory backing, plus industry cooperation, is why detergents are leading in market share and are paving global glucaric acid market trends.

Food ingredients recorded a 7.64% CAGR in the glucaric acid market over the forecast period of 2025-2032. Preventium glucarate by Applied Food Sciences has attained FDA GRAS status for use in beverages and snack bars. Leading food producers in markets have conducted evaluations for shelf-life and antioxidant effects. Such partnerships between companies producing glucaric acid and food associations point to escalating demand for bio-based solutions, drawing attention toward transformative trends in the food ingredients industry, and further consolidating the growth potential of the glucaric acid market.

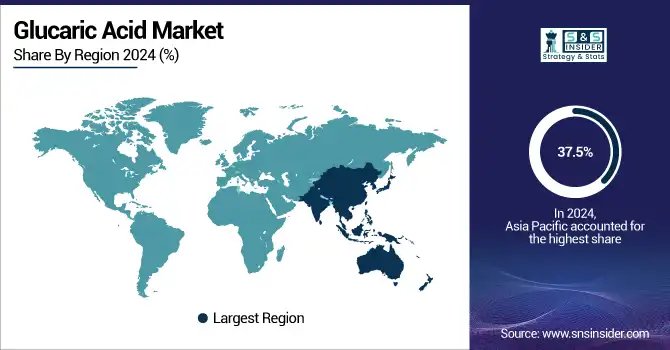
Glucaric Acid Market Regional Outlook:

Asia Pacific dominates the glucaric acid market in 2024 with a commanding market share of 37.5% and the highest CAGR of 7.57%. This dominance is attributed to rapid industrialization, rising awareness among consumers about biodegradable products, and government policies promoting sustainable chemical use in countries, such as China, India, and Japan. The region’s expanding detergent and food ingredient business also contributes to the glucaric acid market demand. The increasing focus on green manufacturing in Asia Pacific and investments by local companies in the region are consistent with international trends, which further substantiates the predominance of Asia Pacific in the market for glucaric acid.

North America is the second-largest market globally for glucaric acid, 2024 accounted for a massive market share of 30.4%. The U.S. is dominating the region with 66.2% market share and a market size of around USD 229.92 million in 2024 and is projected to reach to a market size of USD 391.22 million in 2032 with a CAGR of 6.88% on account of robust product demand from detergents, food ingredients, and pressure-sensitive films industries, on account of the rising trend of eco-friendly product use encouraged by bodies including the EPA (Environmental Protection Agency). Canada is among the fastest-growing countries with increasing industrial applications and supportive government policies on sustainable chemical production. This strong regional presence positively motivates the trend of the glucaric acid market and has helped ensure a market share.

Europe is the third leading region in the glucaric acid market due to the stringent regulation of chemical safety and sustainability by the European Chemicals Agency (ECHA). The German and French markets lead in industrial applications, with the market profiting from high demand across personal care and detergent applications. Market in Europe is experiencing strong growth in the glucaric acid market, with a high market value. A group of overseas glucaric acid companies focuses on green chemistry products as a production base in Europe. These trends in the market contribute to the favourable growth of the glucaric acid market in the region.

The glucaric acid market is expanding in Latin America as the region’s food processing and detergent sectors expand, especially in Mexico and Brazil. Increased government-led sustainable agricultural and chemical manufacturing initiatives also encourage bio-based product development, with entities, such as the Brazilian Ministry of Agriculture advocating this progress. Emerging export potentials coupled with a growing preference for green products by consumers continue to boost shares in the regional glucaric acid market, and the forecast period will witness significant growth.

The Middle East & Africa glucaric acid market size is also substantial and is driven by growing industrialization and surging interest in environment-friendly cleansing agents. Governments in nations including Saudi Arabia and South Africa are developing green chemical technologies for environmental protection as regulatory policies consider sustainability. Although not among the fastest growing, the region’s rising infrastructure, and increased awareness regarding biodegradable chemicals, have been contributing significantly to the global glucaric acid market and making the key gamut of glucaric acid companies set deep roots in the region.

Glucaric-Acid-Market-by-region

Get Customized Report as per Your Business Requirement - Enquiry Now

Key Players:

The major competitors in the glucaric acid market include Rivertop Renewables, Rennovia Inc., Kalion Inc., Jungbunzlauer Suisse AG, Roquette Frères, Biosynth Carbosynth, Haihang Industry Co., Ltd., Anhui Elite Industrial Co., Ltd., Shaoxing Marina Biotechnology Co., Ltd., and Chemfaces Biochemical Co., Ltd.

Recent Developments:

  • September 2024: Applied Food Sciences launches CelluThrive Calcium D-Glucarate, a bulk glucarate ingredient for nutraceutical and beverage applications, backed by over two decades of clinical research on detoxification pathways

  • June 2024: Solugen secures a conditional USD 213.6 million loan guarantee from the U.S. Department of Energy Loan Programs Office to build its Bioforge Marshall facility in Minnesota, significantly expanding domestic bio-based glucaric acid production capacity

Glucaric Acid Market Report Scope:

Report Attributes Details
Market Size in 2024 USD 1,142.49 million
Market Size by 2032 USD 1,972.30 million
CAGR CAGR of 7.08% From 2025 to 2032
Base Year 2024
Forecast Period 2025-2032
Historical Data 2021-2023
Report Scope & Coverage Market Size, Segments Analysis, Competitive Landscape, Regional Analysis, DROC & SWOT Analysis, Forecast Outlook
Key Segments •By Product (Pure glucaric acid, Calcium D-glucarate, Potassium sodium D-glucarate, D-glucaric acid-1,4-lactone, Others)
•By Application (Food ingredients, Detergents, Corrosion inhibitors, De-icing applications, Others)
Regional Analysis/Coverage North America (US, Canada, Mexico), Europe (Germany, France, UK, Italy, Spain, Poland, Turkey, Rest of Europe), Asia Pacific (China, India, Japan, South Korea, Singapore, Australia, Rest of Asia Pacific), Middle East & Africa (UAE, Saudi Arabia, Qatar, South Africa, Rest of Middle East & Africa), Latin America (Brazil, Argentina, Rest of Latin America)
Company Profiles Rivertop Renewables, Rennovia Inc., Kalion Inc., Jungbunzlauer Suisse AG, Roquette Frères, Biosynth Carbosynth, Haihang Industry Co., Ltd., Anhui Elite Industrial Co., Ltd., Shaoxing Marina Biotechnology Co., Ltd., and Chemfaces Biochemical Co., Ltd.

Frequently Asked Questions

The glucaric acid market growth is driven by rising demand for eco-friendly detergents, food additives, and phosphate substitutes, promoting sustainable manufacturing.

Asia Pacific dominates the glucaric acid market in 2024, holding a 37.5% market share due to rapid industrialization and green policies.

Detergents lead with a 37.6% share, replacing phosphates with biodegradable glucaric acid surfactants meeting environmental regulations globally.

FDA GRAS status for products like Preventium boosts glucaric acid market confidence and expands usage in food and nutraceutical sectors.

Rivertop Renewables, Solugen, and Applied Food Sciences are leading glucaric acid companies advancing production and innovation.

Table of Contents:

1. Introduction

1.1 Market Definition

1.2 Scope (Inclusion and Exclusions)

1.3 Research Assumptions

2. Executive Summary

2.1 Market Overview       

2.2 Regional Synopsis

2.3 Competitive Summary

3. Research Methodology

3.1 Top-Down Approach

3.2 Bottom-up Approach

3.3. Data Validation

3.4 Primary Interviews

4. Market Dynamics Impact Analysis

4.1 Market Driving Factors Analysis

4.1.2 Drivers

4.1.2 Restraints

4.1.3 Opportunities

4.1.4 Challenges

4.2 PESTLE Analysis

4.3 Porter’s Five Forces Model

5. Statistical Insights and Trends Reporting

5.1 Government Funding for Biochemicals, 2021 - 2025

5.2 R&D Investment by Key Players

5.3 Raw Material Price Volatility Trends

5.4 Consumer Preference for Green Detergents, 2024

5.5 Startup Investment in Glucaric Acid Production

6. Competitive Landscape

6.1 List of Major Companies By Region

6.2 Market Share Analysis By Region

6.3 Product Benchmarking

6.3.1 Product specifications and features

6.3.2 Pricing

6.4 Strategic Initiatives

6.4.1 Marketing and promotional activities

6.4.2 Distribution and Supply Chain Strategies

6.4.3 Expansion Plans and New Product Launches

6.4.4 Strategic partnerships and collaborations

6.5 Technological Advancements

6.6 Market Positioning and Branding

7. Glucaric Acid Market Segmentation By Product

7.1 Chapter Overview

7.2 Pure glucaric acid

        7.2.1 Pure glucaric acid Trend Analysis (2021-2032)

7.2.2 Pure glucaric acid Market Size Estimates and Forecasts to 2032 (USD Million)

7.3 Calcium D-glucarate

       7.3.1 Calcium D-glucarate Market Trends Analysis (2021-2032)

       7.3.2 Calcium D-glucarate Market Size Estimates and Forecasts to 2032 (USD Million)

7.4 Potassium sodium D-glucarate

        7.4.1 Potassium sodium D-glucarate Trend Analysis (2021-2032)

        7.4.2 Potassium sodium D-glucarate Market Size Estimates and Forecasts to 2032 (USD Million)

7.5 D-glucaric acid-1,4-lactone

       7.5.1 D-glucaric acid-1,4-lactone Market Trends Analysis (2021-2032)

       7.5.2 D-glucaric acid-1,4-lactone Market Size Estimates and Forecasts to 2032 (USD Million)

7.6 Others

       7.6.1 Others Trend Analysis (2021-2032)

7.6.2 Others Market Size Estimates and Forecasts to 2032 (USD Million)

8. Glucaric Acid Market Segmentation By Application

8.1 Chapter Overview

8.2 Food ingredients

       8.2.1 Food ingredients Market Trends Analysis (2021-2032)

8.2.2 Food ingredients Market Size Estimates and Forecasts to 2032 (USD Million)

8.3 Detergents

      8.3.1 Detergents Market Trends Analysis (2021-2032)

      8.3.2 Detergents Market Size Estimates and Forecasts to 2032 (USD Million)

8.4 Corrosion inhibitors

        8.4.1 Corrosion inhibitors Market Trends Analysis (2021-2032)

        8.4.2 Corrosion inhibitors Market Size Estimates and Forecasts to 2032 (USD Million)

8.5 De-icing applications

        8.5.1 De-icing applications Market Trends Analysis (2021-2032)

        8.5.2 De-icing applications Market Size Estimates and Forecasts to 2032 (USD Million)

8.6 Others

       8.6.1 Others Market Trends Analysis (2021-2032)

8.6.2 Others Market Size Estimates and Forecasts to 2032 (USD Million)

9. Regional Analysis

     9.1 Chapter Overview

     9.2 North America

9.2.1 Trends Analysis

9.2.2 North America Glucaric Acid Market Estimates and Forecasts, by Country (2021-2032) (USD Million)

9.2.3 North America Glucaric Acid Market Estimates and Forecasts, By Product (2021-2032) (USD Million) 

9.2.4 North America Glucaric Acid Market Estimates and Forecasts, By Application (2021-2032) (USD Million)

9.2.5 USA

9.2.5.1 USA Glucaric Acid Market Estimates and Forecasts, By Product (2021-2032) (USD Million)

9.2.5.2 USA Glucaric Acid Market Estimates and Forecasts, By Application (2021-2032) (USD Million)

9.2.6 Canada

9.2.6.1 Canada Glucaric Acid Market Estimates and Forecasts, By Product (2021-2032) (USD Million)

9.2.6.2 Canada Glucaric Acid Market Estimates and Forecasts, By Application (2021-2032) (USD Million)

9.2.7 Mexico

9.2.7.1 Mexico Glucaric Acid Market Estimates and Forecasts, By Product (2021-2032) (USD Million)

9.2.7.2 Mexico Glucaric Acid Market Estimates and Forecasts, By Application (2021-2032) (USD Million)

9.3 Europe

9.3.1 Trends Analysis

9.3.2 Europe Glucaric Acid Market Estimates and Forecasts, by Country (2021-2032) (USD Million)

9.3.3 Europe Glucaric Acid Market Estimates and Forecasts, By Product (2021-2032) (USD Million) 

9.3.4 Europe Glucaric Acid Market Estimates and Forecasts, By Application (2021-2032) (USD Million)

9.3.5 Germany

9.3.5.1 Germany Glucaric Acid Market Estimates and Forecasts, By Product (2021-2032) (USD Million)

9.3.5.2 Germany Glucaric Acid Market Estimates and Forecasts, By Application (2021-2032) (USD Million)

9.3.6 France

9.3.6.1 France Glucaric Acid Market Estimates and Forecasts, By Product (2021-2032) (USD Million)

9.3.6.2 France Glucaric Acid Market Estimates and Forecasts, By Application (2021-2032) (USD Million)

9.3.7 UK

9.3.7.1 UK Glucaric Acid Market Estimates and Forecasts, By Product (2021-2032) (USD Million)

9.3.7.2 UK Glucaric Acid Market Estimates and Forecasts, By Application (2021-2032) (USD Million)

9.3.8 Italy

9.3.8.1 Italy Glucaric Acid Market Estimates and Forecasts, By Product (2021-2032) (USD Million)

9.3.8.2 Italy Glucaric Acid Market Estimates and Forecasts, By Application (2021-2032) (USD Million)

9.3.9 Spain

9.3.9.1 Spain Glucaric Acid Market Estimates and Forecasts, By Product (2021-2032) (USD Million)

9.3.9.2 Spain Glucaric Acid Market Estimates and Forecasts, By Application (2021-2032) (USD Million)

9.3.10 Poland

9.3.10.1 Poland Glucaric Acid Market Estimates and Forecasts, By Product (2021-2032) (USD Million)

9.3.10.2 Poland Glucaric Acid Market Estimates and Forecasts, By Application (2021-2032) (USD Million)

9.3.11 Turkey

9.3.11.1 Turkey Glucaric Acid Market Estimates and Forecasts, By Product (2021-2032) (USD Million)

9.3.11.2 Turkey Glucaric Acid Market Estimates and Forecasts, By Application (2021-2032) (USD Million)

9.3.12 Rest of Europe

9.3.12.1 Rest of Europe Glucaric Acid Market Estimates and Forecasts, By Product (2021-2032) (USD Million)

9.3.12.2 Rest of Europe Glucaric Acid Market Estimates and Forecasts, By Application (2021-2032) (USD Million)

9.4 Asia Pacific

9.4.1 Trends Analysis

9.4.2 Asia Pacific Glucaric Acid Market Estimates and Forecasts, by Country (2021-2032) (USD Million)

9.4.3 Asia Pacific Glucaric Acid Market Estimates and Forecasts, By Product (2021-2032) (USD Million) 

9.4.4 Asia Pacific Glucaric Acid Market Estimates and Forecasts, By Application (2021-2032) (USD Million)

9.4.5 China

9.4.5.1 China Glucaric Acid Market Estimates and Forecasts, By Product (2021-2032) (USD Million)

9.4.5.2 China Glucaric Acid Market Estimates and Forecasts, By Application (2021-2032) (USD Million)

9.4.6 India

9.4.5.1 India Glucaric Acid Market Estimates and Forecasts, By Product (2021-2032) (USD Million)

9.4.5.2 India Glucaric Acid Market Estimates and Forecasts, By Application (2021-2032) (USD Million)

9.4.5 Japan

9.4.5.1 Japan Glucaric Acid Market Estimates and Forecasts, By Product (2021-2032) (USD Million)

9.4.5.2 Japan Glucaric Acid Market Estimates and Forecasts, By Application (2021-2032) (USD Million)

9.4.6 South Korea

9.4.6.1 South Korea Glucaric Acid Market Estimates and Forecasts, By Product (2021-2032) (USD Million)

9.4.6.2 South Korea Glucaric Acid Market Estimates and Forecasts, By Application (2021-2032) (USD Million)

9.4.7 Singapore

9.4.7.1 Singapore Glucaric Acid Market Estimates and Forecasts, By Product (2021-2032) (USD Million)

9.4.7.2 Singapore Glucaric Acid Market Estimates and Forecasts, By Application (2021-2032) (USD Million)

8.4.8 Australia

8.4.8.1 Australia Glucaric Acid Market Estimates and Forecasts, By Product (2021-2032) (USD Million)

8.4.8.2 Australia Glucaric Acid Market Estimates and Forecasts, By Application (2021-2032) (USD Million)

9.4.9 Rest of Asia Pacific

9.4.9.1 Rest of Asia Pacific Glucaric Acid Market Estimates and Forecasts, By Product (2021-2032) (USD Million)

9.4.9.2 Rest of Asia Pacific Glucaric Acid Market Estimates and Forecasts, By Application (2021-2032) (USD Million)

9.5 Middle East & Africa

9.5.1 Trends Analysis

9.5.2 Middle East & Africa Glucaric Acid Market Estimates and Forecasts, by Country (2021-2032) (USD Million)

9.5.3 Middle East & Africa Glucaric Acid Market Estimates and Forecasts, By Product (2021-2032) (USD Million) 

9.5.4 Middle East & Africa Glucaric Acid Market Estimates and Forecasts, By Application (2021-2032) (USD Million)

9.5.5 UAE

9.5.5.1 UAE Glucaric Acid Market Estimates and Forecasts, By Product (2021-2032) (USD Million)

9.5.5.2 UAE Glucaric Acid Market Estimates and Forecasts, By Application (2021-2032) (USD Million)

9.5.6 Saudi Arabia

9.5.6.1 Saudi Arabia Glucaric Acid Market Estimates and Forecasts, By Product (2021-2032) (USD Million)

9.5.6.2 Saudi Arabia Glucaric Acid Market Estimates and Forecasts, By Application (2021-2032) (USD Million)

9.5.7 Qatar

9.5.7.1 Qatar Glucaric Acid Market Estimates and Forecasts, By Product (2021-2032) (USD Million)

9.5.7.2 Qatar Glucaric Acid Market Estimates and Forecasts, By Application (2021-2032) (USD Million)

9.5.8 South Africa

9.5.8.1 South Africa Glucaric Acid Market Estimates and Forecasts, By Product (2021-2032) (USD Million)

9.5.8.2 South Africa Glucaric Acid Market Estimates and Forecasts, By Application (2021-2032) (USD Million)

9.5.9 Rest of Middle East & Africa

9.5.9.1 Rest of Middle East & Africa Glucaric Acid Market Estimates and Forecasts, By Product (2021-2032) (USD Million)

9.5.9.2 Rest of Middle East & Africa Glucaric Acid Market Estimates and Forecasts, By Application (2021-2032) (USD Million)

9.6 Latin America

9.6.1 Trends Analysis

9.6.2 Latin America Glucaric Acid Market Estimates and Forecasts, by Country (2021-2032) (USD Million)

9.6.3 Latin America Glucaric Acid Market Estimates and Forecasts, By Product (2021-2032) (USD Million) 

9.6.4 Latin America Glucaric Acid Market Estimates and Forecasts, By Application (2021-2032) (USD Million)

9.6.5 Brazil

9.6.5.1 Brazil Glucaric Acid Market Estimates and Forecasts, By Product (2021-2032) (USD Million)

9.6.5.2 Brazil Glucaric Acid Market Estimates and Forecasts, By Application (2021-2032) (USD Million)

9.6.6 Argentina

9.6.6.1 Argentina Glucaric Acid Market Estimates and Forecasts, By Product (2021-2032) (USD Million)

9.6.6.2 Argentina Glucaric Acid Market Estimates and Forecasts, By Application (2021-2032) (USD Million)

9.6.7 Rest of Latin America

9.6.7.1 Rest of Latin America Glucaric Acid Market Estimates and Forecasts, By Product (2021-2032) (USD Million)

9.6.7.2 Rest of Latin America Glucaric Acid Market Estimates and Forecasts, By Application (2021-2032) (USD Million)

10. Company Profiles

10.1 Rivertop Renewables

        10.1.1 Company Overview

       10.1.2 Financial

       10.1.3 Products/Services Offered

       10.1.4 SWOT Analysis

 10.2 Rennovia Inc.

10.2.1 Company Overview

10.2.2 Financial

10.2.3 Products/Services Offered

10.2.4 SWOT Analysis

10.3 Kalion Inc.

10.3.1 Company Overview

10.3.2 Financial

10.3.3 Products/Services Offered

10.3.4 SWOT Analysis

10.4 Jungbunzlauer Suisse AG

10.4.1 Company Overview

10.4.2 Financial

10.4.3 Products/Services Offered

10.4.4 SWOT Analysis

10.5 Roquette Frères

10.5.1 Company Overview

10.5.2 Financial

10.5.3 Products/Services Offered

10.5.4 SWOT Analysis

10.6 Biosynth Carbosynth

10.6.1 Company Overview

10.6.2 Financial

10.6.3 Products/Services Offered

10.6.4 SWOT Analysis

10.7 Haihang Industry Co., Ltd.

10.7.1 Company Overview

10.7.2 Financial

10.7.3 Products/Services Offered

10.7.4 SWOT Analysis

10.8 Anhui Elite Industrial Co., Ltd.

10.8.1 Company Overview

10.8.2 Financial

10.8.3 Products/Services Offered

10.8.4 SWOT Analysis

10.9 Shaoxing Marina Biotechnology Co., Ltd.

10.9.1 Company Overview

10.9.2 Financial

10.9.3 Products/Services Offered

10.9.4 SWOT Analysis

10.10 Chemfaces Biochemical Co., Ltd.

10.10.1 Company Overview

10.10.2 Financial

10.10.3 Products/Services Offered

10.10.4 SWOT Analysis

11. Use Cases and Best Practices

12. Conclusion

An accurate research report requires proper strategizing as well as implementation. There are multiple factors involved in the completion of good and accurate research report and selecting the best methodology to compete the research is the toughest part. Since the research reports we provide play a crucial role in any company’s decision-making process, therefore we at SNS Insider always believe that we should choose the best method which gives us results closer to reality. This allows us to reach at a stage wherein we can provide our clients best and accurate investment to output ratio.

Each report that we prepare takes a timeframe of 350-400 business hours for production. Starting from the selection of titles through a couple of in-depth brain storming session to the final QC process before uploading our titles on our website we dedicate around 350 working hours. The titles are selected based on their current market cap and the foreseen CAGR and growth.


The 5 steps process:

Step 1: Secondary Research:

Secondary Research or Desk Research is as the name suggests is a research process wherein, we collect data through the readily available information. In this process we use various paid and unpaid databases which our team has access to and gather data through the same. This includes examining of listed companies’ annual reports, Journals, SEC filling etc. Apart from this our team has access to various associations across the globe across different industries. Lastly, we have exchange relationships with various university as well as individual libraries.

Secondary Research

Step 2: Primary Research

When we talk about primary research, it is a type of study in which the researchers collect relevant data samples directly, rather than relying on previously collected data.  This type of research is focused on gaining content specific facts that can be sued to solve specific problems. Since the collected data is fresh and first hand therefore it makes the study more accurate and genuine.

We at SNS Insider have divided Primary Research into 2 parts.

Part 1 wherein we interview the KOLs of major players as well as the upcoming ones across various geographic regions. This allows us to have their view over the market scenario and acts as an important tool to come closer to the accurate market numbers. As many as 45 paid and unpaid primary interviews are taken from both the demand and supply side of the industry to make sure we land at an accurate judgement and analysis of the market.

This step involves the triangulation of data wherein our team analyses the interview transcripts, online survey responses and observation of on filed participants. The below mentioned chart should give a better understanding of the part 1 of the primary interview.

Primary Research

Part 2: In this part of primary research the data collected via secondary research and the part 1 of the primary research is validated with the interviews from individual consultants and subject matter experts.

Consultants are those set of people who have at least 12 years of experience and expertise within the industry whereas Subject Matter Experts are those with at least 15 years of experience behind their back within the same space. The data with the help of two main processes i.e., FGDs (Focused Group Discussions) and IDs (Individual Discussions). This gives us a 3rd party nonbiased primary view of the market scenario making it a more dependable one while collation of the data pointers.

Step 3: Data Bank Validation

Once all the information is collected via primary and secondary sources, we run that information for data validation. At our intelligence centre our research heads track a lot of information related to the market which includes the quarterly reports, the daily stock prices, and other relevant information. Our data bank server gets updated every fortnight and that is how the information which we collected using our primary and secondary information is revalidated in real time.

Data Bank Validation

Step 4: QA/QC Process

After all the data collection and validation our team does a final level of quality check and quality assurance to get rid of any unwanted or undesired mistakes. This might include but not limited to getting rid of the any typos, duplication of numbers or missing of any important information. The people involved in this process include technical content writers, research heads and graphics people. Once this process is completed the title gets uploader on our platform for our clients to read it.

Step 5: Final QC/QA Process:

This is the last process and comes when the client has ordered the study. In this process a final QA/QC is done before the study is emailed to the client. Since we believe in giving our clients a good experience of our research studies, therefore, to make sure that we do not lack at our end in any way humanly possible we do a final round of quality check and then dispatch the study to the client.

Key Segments: 

By Product

  • Pure glucaric acid

  • Calcium D-glucarate

  • Potassium sodium D-glucarate

  • D-glucaric acid-1,4-lactone

  • Others

By Application

  • Food ingredients

  • Detergents

  • Corrosion inhibitors

  • De-icing applications

  • Others

Request for Segment Customization as per your Business Requirement: Segment Customization Request

Regional Coverage: 

North America

  • US

  • Canada

  • Mexico

Europe

  • Germany

  • France

  • UK

  • Italy

  • Spain

  • Poland

  • Turkey

  • Rest of Europe

Asia Pacific

  • China

  • India

  • Japan

  • South Korea

  • Singapore

  • Australia

  • Rest of Asia Pacific

Middle East & Africa

  • UAE

  • Saudi Arabia

  • Qatar

  • South Africa

  • Rest of Middle East & Africa

Latin America

  • Brazil

  • Argentina

  • Rest of Latin America

Request for Country Level Research Report: Country Level Customization Request

Available Customization 

With the given market data, SNS Insider offers customization as per the company’s specific needs. The following customization options are available for the report: 

  • Detailed Volume Analysis 

  • Criss-Cross segment analysis (e.g. Product X Application) 

  • Competitive Product Benchmarking 

  • Geographic Analysis 

  • Additional countries in any of the regions 

  • Customized Data Representation 

  • Detailed analysis and profiling of additional market players

Explore Key Insights.


  • Analyzes market trends, forecasts, and regional dynamics
  • Covers core offerings, innovations, and industry use cases
  • Profiles major players, value chains, and strategic developments
  • Highlights innovation trends, regulatory impacts, and growth opportunities
Request an Analyst Call