Glycomics Market Size & Overview:
To Get More Information on Glycomics Market - Request Sample Report
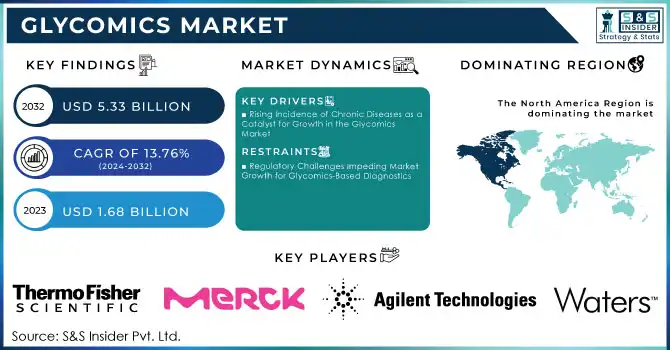
Glycomics Market was valued at USD 1.68 billion in 2023 and is expected to reach USD 5.33 billion by 2032, growing at a CAGR of 13.76% from 2024-2032.
The glycomics market is undergoing significant growth following advances in biotechnology and the transition to personalized medicine, which have opened new avenues for understanding complex biological processes. In 2023 alone, global pharmaceutical R&D spending exceeded USD 301 billion, while more than 5,500 companies were actively involved in R&D pipelines, indicating the commitment of the healthcare sector to innovation. This focus on precision medicine and early diagnosis has placed a greater focus on glycan-based biomarkers and targeted therapy, through significant investment opportunities from established firms and agile startups competing to unlock the new therapeutic and diagnostic possibilities hidden within glycomics.
This is driven by the increased interest in glycan-based biomarkers and targeted therapies due to the focus on precision medicine and early diagnosis within the healthcare industry. Pharmaceutical companies want to use glycomics to improve aspects like drug development, effectiveness, and specificity. Emerging technologies, such as the newly developed AI model "CandyCrunch," which is a dilated residual neural network predicting glycan structures from raw LC-MS/MS data with an astonishing accuracy of 87.7% in seconds, are revolutionizing the analysis of glycomics into a quicker and more straightforward process, thus much more broadly applicable to biosciences.
Collaboration between academia and industry is improving the promise of glycomics, drawing both well-established companies and agile start-ups in with innovative and high-throughput solutions that provide increasing market competition. Among those considered most promising advances for the glycomics field of the future are AI-driven glycan analysis, automated workflows, and improvements in mass spectrometry. Regulatory frameworks that support precision medicine and advanced biological research are likely to speed the adoption of glycomics, providing an investment-friendly environment for new engagements. This is expected to establish glycomics as a critical tool in healthcare and life sciences, further propelling growth and innovation in the industry.
Glycomics Market Dynamics
DRIVERS
-
Rising Incidence of Chronic Diseases as a Catalyst for Growth in the Glycomics Market
Chronic diseases such as cancer, diabetes, and cardiovascular conditions are creating a huge demand for advanced diagnostics and targeted therapies. Therefore, patients suffering from such diseases have a significant impact on the glycomics market, given that China accounts for 140.9 million out of total global diabetes cases at 26.3%. Better diagnostic tools and treatments require improved glycomics studies on glycans and their role in diseases to further the precision medicine movement. It serves in identifying biomarkers and advancing targeted treatments of diseases. Increasing demand for high-technology glycan analysis tools coupled with supportive regulatory policies is expected to propel the market for glycomics at an exceptional growth rate. The said trend will continue to attract massive investments and make glycomics an indispensable area of healthcare innovation that ensures early diagnosis and targeted treatment of chronic diseases. Glycomics will be continuously evolving in developing its further utilization to improve global healthcare outcomes.
-
Increased Applications of Glycomics in Diagnostics Fueling Market Demand for Advanced Technologies
The growing focus on glycan biomarkers for diagnostics is driving the increased demand for glycomics technologies in laboratories and clinics. Early detection and monitoring of diseases like cancer, diabetes, and infections require highly sensitive glycan-based approaches, prompting the healthcare industry to adopt these solutions. Advances in high-throughput screening technology and supportive regulatory frameworks are making glycan analysis more accessible and efficient. This shift is creating significant market opportunities for glycomics tool companies while intensifying competition as new players enter the field. As the need for innovative diagnostic technologies continues to rise, both research and clinical testing sectors are expected to experience substantial growth. The expanding applications of glycomics in disease detection and monitoring are positioning it as a key driver in the future of healthcare diagnostics, offering enhanced precision and personalization in medical treatments.
RESTRAINTS
Regulatory Challenges Impeding Market Growth for Glycomics-Based Diagnostics
Strict regulations around the approval of novel glycomics-based diagnostic tools are a significant market growth inhibitor, and these could delay widespread acceptance of these tools. Validation processes for such tests due to safety, effectiveness, and reliability concerns are lengthy and costly and often deter new product development and commercialization. Strict regulations coupled with the requirement of broad clinical trials essentially create hurdles for businesses entering glycomics technology streams. These challenges delay product introductions and add to costs, thereby reducing opportunities for smaller firms and slowing the rate of overall market growth. The time and resources required for regulatory compliance can discourage innovation and slow the acceptance of glycomics-based diagnostics into clinical settings. It is, therefore imperative that these regulatory challenges are crossed to speed up the introduction of advanced glycomics solutions and its integration into the health care system to benefit from enhanced disease detection and curative therapies.
Glycomics Market Segment Analysis
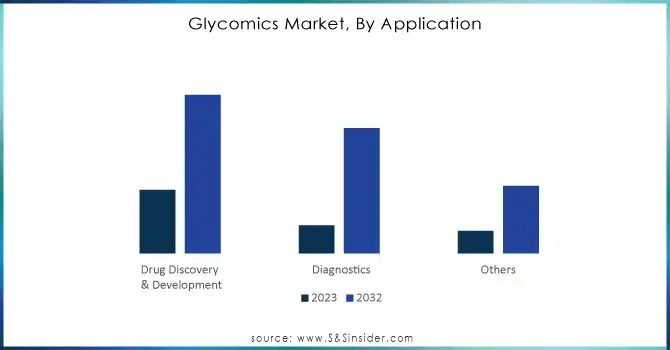
BY APPLICATION
Drug Discovery & Development Segment dominated the Glycomics market with the highest revenue share of about 45% in 2023. These results reflect the high demand for targeted drug development and increasing dependency on glycomics for identifying novel therapeutic targets, mainly in cancer and metabolic disorders. Further technological advancements still are a proving ground to strengthen this segment and ensure continued market leadership while attracting further investment.
The diagnostics segment is expected to grow at the highest CAGR of 15.36% during 2024-2032, based on innovations in the early detection of diseases and higher adoption of glycan biomarkers. Indeed, the philosophy of precision medicine could sustain higher competition dynamics, rising investment momentum, and broader application of a wide gamut of personalized diagnostic tools.
Do You Need any Customization Research on Glycomics Market - Enquire Now
BY PRODUCT
The Enzymes segment dominated the glycomics market, with a revenue share of about 34% in 2023, boosted by a well-established demand for enzyme-based solutions in glycan analysis and synthesis. Enzymes are crucial in a study because their ability to modify and characterize glycans with precision makes them applicable in research to therapeutic use. As technological advances improve the accuracy and efficiency of enzyme-based processes further, this segment is likely to remain prominent, with more investment being created and attracted to fuel its growth
The Instruments segment is expected to grow at the fastest CAGR of 15.53% between 2024 and 2032 on account of the rising need for advanced analytical tools in glycomics research. Innovative applications such as mass spectrometry, chromatography, and automated systems have been constantly making glycan analysis more efficient and accessible. The growth in this aspect will probably spur competition, drive innovation, and unlock new market opportunities with higher usage of both academic and clinical applications.
BY END USE
Academic & Research Institutes Segment- dominated the glycomics market with the highest revenue share of about 42% in 2023, mainly driven by the demand for high-end glycomics research. These institutions are centers where technological innovation is furthered and glycan structures associated with biological processes are understood. Being well established and with a stream of funding, they maintained their leadership position in the market. The leadership has driven further research and been a platform for setting future progress tracks in glycomics.
Biopharmaceutical Companies Segment is expected to grow at the highest CAGR of about 15.61% from 2024-2032 with the emergence of drug discovery and development with glycomics. Owing to the increased concentration on the horizon of personalized medicine and targeted therapies, biopharmaceutical companies are significantly investing in glycomics research. This trend is supposed to enhance competition, foster more collaborations, and invite greater investment. In this case, the segment will lead to alteration in the development of drugs and healthcare solutions.
Glycomics Market Regional Outlook
The North America region dominated the glycomics market with the highest revenue share of about 43% in 2023, driven by strong demand for advanced glycomics technologies and a well-established infrastructure for research and development. The region has a stronghold on glycomics due to robust investment by major market players and considerable government and private investments. It will continue as North America will still be a leader for advanced research and commercial applications that will influence world market trends and add further competitiveness.
Europe Region is expected to grow at the fastest CAGR of about 15.43% from 2024-2032, on account of increased investment in research, innovation, and increased adoption of glycomics-based diagnostics and therapies. Emerging trends in personalised medicine and trans-sector collaborative efforts open new opportunities for further market growth. Such growth will spur more regional competition and bring new entrants into the glycomics market, triggering further investments in this field, and changing the dynamics of Europe's presence in the global market and accelerating innovation.

LATEST NEWS-
-
On January 30, 2024, Vector Laboratories and Navinci Diagnostics announced a partnership to develop biomarker discovery techniques focused on identifying protein glycosylation in tissue samples, advancing precision diagnostics.
-
In 2024, Bruker advanced glycoproteomics with the timsTOF Ultra 2 platform and its Glyco-PASEF method, which, enhanced by ENRICHplus, significantly increases the accuracy and depth of glycopeptide analysis, providing valuable insights into glycobiology.
KEY PLAYERS
-
Thermo Fisher Scientific, Inc. (Pierce Glycoprotein Isolation Kit, GlycanPac AXH-1 Column)
-
Merck KGaA (GlycanReactor, Glycan Standards)
-
Agilent Technologies Inc. (6545XT AdvanceBio LC/Q-TOF, 1260 Infinity II Glycan Analysis System)
-
Bruker (MaXis 4G UHPLC-QTOF Mass Spectrometer, glycanPro Software)
-
New England Biolabs (NEBNext Ultra II DNA Library Prep Kit for Illumina, GlycoWorks RapiFluor-MS Kit)
-
Shimadzu Corporation (LCMS-8045 Mass Spectrometer, Nexera UHPLC System)
-
Waters Corporation (ACQUITY UPLC Glycan Separation System, Xevo TQ-S Micro Mass Spectrometer)
-
Takara Bio Inc. (SMARTer GlycoSeq Sequencing Kit, GlycoScreen Kit)
-
Asparia Glycomics (Glycan Mapping Kit, GlycoSeq Glycosylation Profiling Service)
-
RayBiotech Life, Inc. (Glycan Assay Kit, Custom Glycan Profiling Service)
-
Danaher Corporation (Cytation 5 Cell Imaging Multi-Mode Reader, GlycanChip)
-
Dextra Laboratories Limited (Glycan Standards, GlycoConnect Platform)
-
AbbVie (GlycoPro Glycan Analysis System, VeroCell Glycan Profiling Kit)
-
GlycoMimetics, Inc. (GMI-1271, GlycoMimetics Glycan Profiling Service)
-
FMC Corporation (Glycosylation Screening Reagents, GlycoRite Enzyme)
-
Biocrates Life Sciences AG (Targeted Glycomics Panel, AbsoluteIDQ p180 Kit)
-
Exiqon (LNA microRNA Array, Glycomics Profiling Service)
-
Genentech (GlycoMAb Monoclonal Antibodies, GlycoFIT Technology Platform)
-
GlycoNet (Glycan Analysis Services, GlycoBiology Research Products)
-
Chugai Pharmaceutical Co., Ltd. (Glycosylation Assay Kit, GlycoPro Therapeutic Antibodies)
-
Vector Laboratories (Glyco-Ta Glycan Labeling Kits, VECLECTIN Lectin Conjugates)
| Report Attributes | Details |
|---|---|
| Market Size in 2023 | USD 1.68 Billion |
| Market Size by 2032 | USD 5.33 Billion |
| CAGR | CAGR of 13.76% From 2024 to 2032 |
| Base Year | 2023 |
| Forecast Period | 2024-2032 |
| Historical Data | 2020-2022 |
| Report Scope & Coverage | Market Size, Segments Analysis, Competitive Landscape, Regional Analysis, DROC & SWOT Analysis, Forecast Outlook |
| Key Segments | • By Product (Enzymes, Kits, Reagents, Instruments) • By Application (Drug Discovery & Development, Diagnostics, Others) • By End-Use (Academic & Research Institutes, Pharmaceutical & Biotechnology Companies, Biopharmaceutical Companies, CROs) |
| Regional Analysis/Coverage | North America (US, Canada, Mexico), Europe (Eastern Europe [Poland, Romania, Hungary, Turkey, Rest of Eastern Europe] Western Europe] Germany, France, UK, Italy, Spain, Netherlands, Switzerland, Austria, Rest of Western Europe]), Asia Pacific (China, India, Japan, South Korea, Vietnam, Singapore, Australia, Rest of Asia Pacific), Middle East & Africa (Middle East [UAE, Egypt, Saudi Arabia, Qatar, Rest of Middle East], Africa [Nigeria, South Africa, Rest of Africa], Latin America (Brazil, Argentina, Colombia, Rest of Latin America) |
| Company Profiles | Thermo Fisher Scientific, Inc., Merck KGaA, Agilent Technologies Inc., Bruker, New England Biolabs, Shimadzu Corporation, Waters Corporation, Takara Bio Inc., Asparia Glycomics, RayBiotech Life, Inc., Danaher Corporation, Dextra Laboratories Limited, AbbVie, GlycoMimetics, Inc., FMC Corporation, Biocrates Life Sciences AG, Exiqon, Genentech, GlycoNet, Chugai Pharmaceutical Co., Ltd., Vector Laboratories |
| Key Drivers | • Rising Incidence of Chronic Diseases as a Catalyst for Growth in the Glycomics Market • Increased Applications of Glycomics in Diagnostics Fueling Market Demand for Advanced Technologies |
| RESTRAINTS | • Regulatory Challenges Impeding Market Growth for Glycomics-Based Diagnostics |
Frequently Asked Questions
Europe is expected to grow at a CAGR of 15.43%, driven by increased research funding, innovation in diagnostics, and a focus on personalized medicine.
North America led the market with a 43% revenue share.
Enzymes were the top revenue-generating product, with a 34% market share in 2023.
Glycomics plays a critical role in drug discovery, diagnostics, and personalized medicine, enhancing the understanding of glycans in health and disease.
Glycomics Market was valued at USD 1.68 billion in 2023 and is expected to reach USD 5.33 billion by 2032, growing at a CAGR of 13.76% from 2024-2032.
Get in Touch
