Graphene-enhanced Plastics Market Size & Overview:
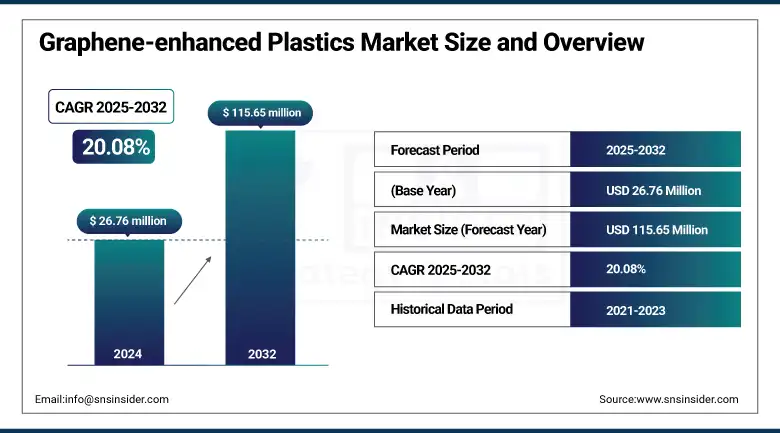
The Graphene-enhanced Plastics Market Size was valued at USD 26.76 million in 2024 and is expected to reach USD 115.65 million by 2032 and grow at a CAGR of 20.08% over the forecast period 2025-2032.
The Graphene-Enhanced Plastics market analysis report provides an in-depth industry analysis, offering a comprehensive conclusion & clarifying insight into the industry for the estimated period. This tendency is largely dictated by automotive, aerospace, and electronics sectors that permanently seek technological advancements in the context of weight saving. Graphene reinforced plastics are also to be considered, where the addition of graphene to plastics enhances their tensile strength, stiffness, and load-bearing ability - important factors in applications where materials with low weight and high performance are required. With manufacturers looking to maximise fuel efficiency, as well as to ensure structural performance and longevity of product, there is increasing demand for graphene-reinforced plastics in a variety of industries.
To Get more information On Graphene-enhanced Plastics Market - Request Free Sample Report
The National Nanotechnology Initiative's pubic investment in Nanoscience and Nanotechnology funding in the U.S. is more than USD 45 billion by the Department of Defense (DOD) and Department of Energy (DOE), specifically supporting advanced materials enabled by graphene through the year 2025. Concurrently with this effort, the Department of Defense under TitleIII of the Defense Production Act entered into agreements with Graphite One Inc. for over USD 37.5 million to develop a supply chain for domestic graphite, which is the essential raw material used in graphene production, which includes breaking ground for a vertically integrated Graphite Creek mine and production facility by mid‑2019 in Alaska and Ohio.
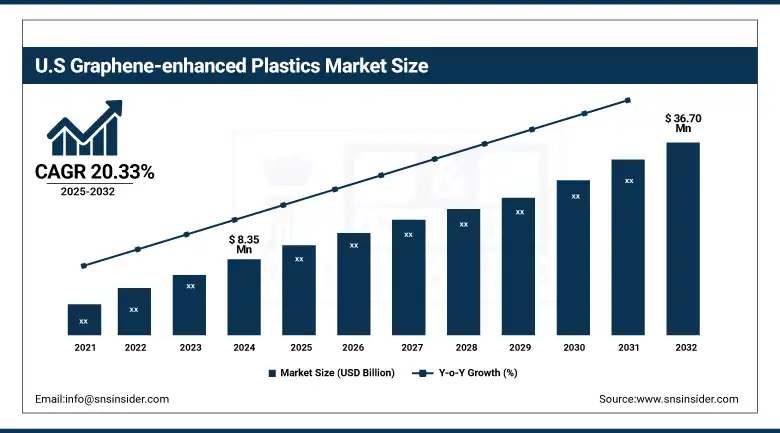
The U.S Graphene-enhanced Plastics market size was USD 8.35 million in 2024 and is expected to reach USD 36.70 million by 2032 and grow at a CAGR of 20.33% over the forecast period of 2025-2032. It is driven by high demand from defense, aerospace, and clean energy sectors. These industries require materials that offer excellent mechanical strength, thermal resistance, and electrical conductivity properties graphene delivers effectively when integrated with plastics. The U.S. also benefits from strong startup ecosystems and institutional support for material innovation.
Graphene-enhanced Plastics Market Dynamics
Key Drivers:
-
Rising Demand for Lightweight, High-Strength Materials Drives the Market Growth
The graphene reinforced plastic market is driven by the need for lightweight and mechanically strong materials. Automobile, aerospace, electronics industries have been more and more inclined to adopt advanced composites in quest of weight saving in the finished product with no deterioration in performance. When incorporated into plastics, graphene significantly increases tensile strength, thermal stability, and conductivity at very low loadings and is perfect for lightweight applications such as EV battery housings and aircraft panels. One major example of this trend is Ford’s relationship with XG Sciences, wherein the introduction of graphene-infused foam-based components reportedly reduced the weight up to 20% and improved thermal efficiency by 30% in vehicle sub-systems. This demand trend is further reinforced by the fact that the U.S. Department of Energy has advocated the use of these materials in order to improve the fuel economy of vehicles by 10–15%.
Restrain:
-
High Production and Integration Costs, which may hamper the Market Growth
The high cost for the manufacture and processing of graphene is a big challenge. The process of making graphene, particularly pristine graphene, which has minimal defects, is expensive, and mixing it into polymers in a way that's uniform and preserves the properties of both materials is a challenge. All these together can lead to 10–20% higher price of graphene enhanced plastics with respect to standard fillers. For example, graphene nanoplatelets are priced at $100–$300 per kg, depending on their purity and form. Scarcely any economies of scale and a disintegrated supply chain amplify the cost effect, so that it no longer evens pays off for price-sensitive sectors such as consumer goods or packaging. This expensive hurdle is holding back mass adoption and limiting the number of small to mid-sized manufacturers entering the market.
Opportunities:
-
Government-Backed R&D and Industry Incentives Create an Opportunity for the Market
Rising acceptance by various governments globally for nanotechnology and advanced materials represents a key opportunity for market growth. Such efforts alleviate the R&D costs from companies and expedite paths to commercialization. In the US, the National Nanotechnology Initiative (NNI) has spent more than USD 2.5 billion on graphene research that's supported by institutes like MIT and Oak Ridge National Lab. In addition, the U.S. Department of Energy earmarks USD 75 million in 2024 for energy storage projects in which graphene-based materials play a key role. These kinds of public investments fund material development and foster public-private collaborations that move graphene-enhanced plastics toward practical applications in the energy, defense, and transportation industries.
Graphene-enhanced Plastics Market Segment Analysis:
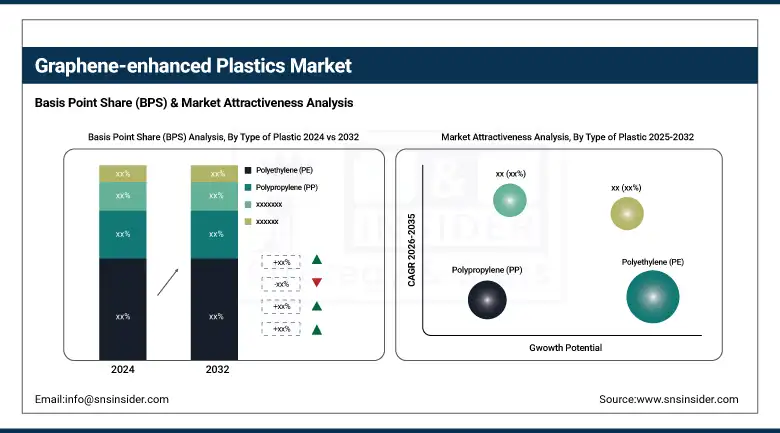
By Type of Plastic
Polyethylene (PE) and Polypropylene (PP) dominated the graphene-enhanced plastics market in 2024, collectively accounting for approximately 37.5% of the market share. These thermoplastics are widely used due to their low cost, high processability, and compatibility with graphene fillers, making them attractive for applications in packaging, automotive, and consumer goods.
The fastest-growing plastic type is Polycarbonate (PC), driven by its demand in electronics and automotive sectors where impact resistance and transparency are critical. The growth is further supported by graphene’s ability to enhance PC’s mechanical and barrier properties, making it suitable for advanced engineering applications.
By Graphene Type
Graphene Nanoplatelets (GNPs) held the largest market share, around 38% in 2024, as they offer a good balance between cost and performance and are easy to incorporate into various polymer matrices using conventional mixing techniques. Their scalability and commercial availability have made them the go-to choice for bulk applications.
Laminates are witnessing the fastest growth due to their expanding role in the electrical, construction, and aerospace sectors. High-pressure Graphene-enhanced Plastics laminates provide outstanding fire resistance, chemical resistance, and mechanical durability, making them suitable for demanding insulation boards, wall linings, and high-performance industrial panels.
By Manufacturing Process
Melt mixing continues to dominate the manufacturing process segment as it is the most commercially viable and scalable technique, compatible with existing polymer processing methods such as extrusion and injection molding. This makes it ideal for large-scale production, especially in the automotive and packaging industries.
In-situ polymerization is the fastest-growing process, particularly for applications that require high-performance composites. This method allows graphene to be evenly dispersed at the molecular level during polymer formation, enhancing mechanical strength, thermal stability, and conductivity. It is increasingly favored in high-end electronics and aerospace applications.
By End-Use Industry
The automotive sector leads the end-use industry segment, commanding nearly 41% of the market share in 2024. Automakers are leveraging graphene-enhanced plastics to reduce vehicle weight, improve fuel efficiency, and meet stringent emission norms. Applications include conductive coatings, battery casings, and EMI shielding components.
The aerospace & defense sector is the fastest-growing segment due to the urgent need for ultra-lightweight yet highly durable materials. Graphene composites are being explored for aircraft components and structural reinforcements, where their excellent strength-to-weight ratio, thermal resistance, and fatigue performance offer significant advantages.
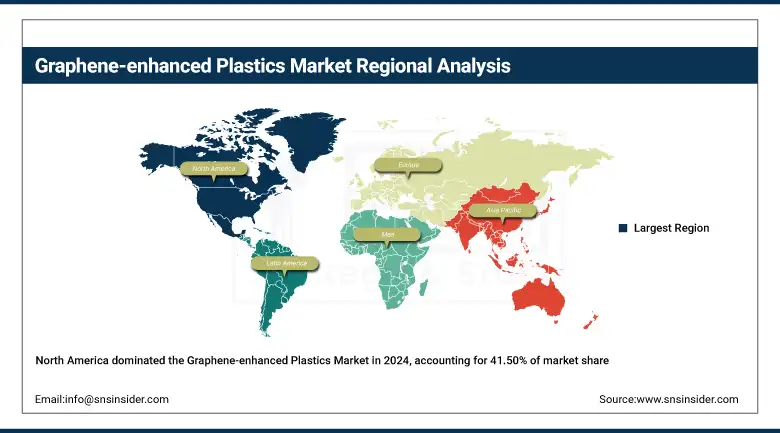
Graphene-enhanced Plastics Market Regional Outlook:
North America held the Graphene-enhanced Plastics market share largest market share, around 41.50%, in 2024. It due to its robust automotive, aerospace, and electronics industries. Companies in the region have been early adopters of advanced materials to improve performance and reduce weight in next-generation products. The widespread need for thermal conductivity, EMI shielding, and structural reinforcement in electric vehicles and electronics further drives demand. Additionally, North America benefits from well-established R&D ecosystems and collaborations between universities and private players.
Get Customized Report as per Your Business Requirement - Enquiry Now
A key development highlighting this innovation drive came in February 2025, when Nova Graphene entered a Memorandum of Understanding to co-develop graphene-enhanced polymer solutions for automotive and industrial applications, demonstrating the region’s commitment to global-scale commercialization.
The Asia Pacific region is the fastest-growing market. It is due to rapid industrial growth and high consumption of electronics and vehicles in countries such as China, Japan, South Korea, and India. The push for lightweight, high-performance materials in consumer electronics and electric vehicles is particularly strong in this region. Moreover, government-backed research and industrial initiatives have supported large-scale graphene production and applications.
For example, the Centre for Advanced 2D Materials at the National University of Singapore received S$50 million to further research on graphene applications, strengthening the region's innovation potential. With the market valued at $31.2 million in 2023 and projected to grow significantly by 2032, Asia Pacific continues to attract major investments.
Europe maintains a significant share of the graphene-enhanced plastics market, supported by strict sustainability mandates and an advanced automotive and aviation manufacturing base. The European Union’s focus on reducing emissions and increasing recyclability has driven adoption of lightweight materials like graphene-reinforced plastics. The presence of major R&D projects, such as the Graphene Flagship one of the EU’s largest research initiatives further supports technological advancement.
In 2024, OCSiAl opened a major graphene nanotube manufacturing facility in Serbia, marking a major milestone in expanding production capabilities within Europe and positioning the region for long-term leadership in high-performance materials.
Key Players:
Major Graphene-enhanced Plasticss companies are Directa Plus, NanoXplore Inc., Haydale Graphene Industries, XG Sciences, G6 Materials Corp., Talga Group, First Graphene, Graphenea, Thomas Swan & Co. Ltd., Versarien Plc, Applied Graphene Materials, Avanzare Innovacion Tecnologica, Perpetuus Advanced Materials, Cabot Corporation, Skeleton Technologies, Levidian Nanosystems, Nanoinnova Technologies, Graphene Composites Ltd., ACS Material LLC, Enerage In.
Recent Development:
-
In 2024, Gasum acquired Haerup Biogas in Denmark. With this acquisition, Gasum increased its production by around 40GWh/year of bio methane based on manure, and strengthened its position in the Nordic small-scale biogas markets.
-
In February 2023, ENGIE acquired Vol-V Biomasse with almost 80 projects to its name and a goal of 5TWh/year biomethane by 2030.
| Report Attributes | Details |
|---|---|
| Market Size in 2024 | USD 26.76 Million |
| Market Size by 2032 | USD 115.65 Million |
| CAGR | CAGR of 20.08% From 2025 to 2032 |
| Base Year | 2024 |
| Forecast Period | 2025-2032 |
| Historical Data | 2021-2023 |
| Report Scope & Coverage | Market Size, Segments Analysis, Competitive Landscape, Regional Analysis, DROC & SWOT Analysis, Forecast Outlook |
| Key Segments | •By Type of Plastic: Polyethylene (PE), Polypropylene (PP), Polycarbonate (PC), Polyethylene Terephthalate (PET), Polystyrene (PS), Others (PVC, PEEK, etc.) •By Graphene Type: Graphene Oxide (GO), Reduced Graphene Oxide (rGO), Graphene Nanoplatelets (GNP), Pristine Graphene •By Manufacturing Process: Solution Blending, In-situ Polymerization, Melt Mixing, Latex Technology, Others (e.g., Electrospinning) •By End-Use Industry: Automotive, Aerospace & Defense, Electronics & Electrical, Packaging, Building & Construction, Energy, Healthcare, Consumer Goods |
| Regional Analysis/Coverage | North America (US, Canada), Europe (Germany, France, UK, Italy, Spain, Poland, Russsia, Rest of Europe), Asia Pacific (China, India, Japan, South Korea, Australia,ASEAN Countries, Rest of Asia Pacific), Middle East & Africa (UAE, Saudi Arabia, Qatar, Egypt, South Africa, Rest of Middle East & Africa), Latin America (Brazil, Argentina, Mexico, Colombia Rest of Latin America) |
| Company Profiles | Directa Plus, NanoXplore Inc., Haydale Graphene Industries, XG Sciences, G6 Materials Corp., Talga Group, First Graphene, Graphenea, Thomas Swan & Co. Ltd., Versarien Plc, Applied Graphene Materials, Avanzare Innovacion Tecnologica, Perpetuus Advanced Materials, Cabot Corporation, Skeleton Technologies, Levidian Nanosystems, Nanoinnova Technologies, Graphene Composites Ltd., ACS Material LLC, Enerage In |
Frequently Asked Questions
Companies are focusing on hybrid composites, cost-efficient production technologies, and R&D collaborations to improve performance and scale.
High production costs, lack of scalable manufacturing, and absence of standardization hinder widespread adoption.
Automotive, electronics, and packaging are the top segments, driven by the need for durable and conductive plastic components.
Advancements enhance graphene dispersion, conductivity, and strength in polymers, making the materials more effective for commercial use.
The market is growing rapidly due to increasing demand for lightweight, high-performance materials in industries like automotive, aerospace, and electronics.
Get in Touch
