image

Black Phosphorus Market Report Scope & Overview:

The Black Phosphorus Market Size was valued at USD 18.69 Million in 2023 and is expected to reach USD 468.60 Million by 2032, growing at a CAGR of 43.05% over the forecast period of 2024-2032.

Black Phosphorus Market Revenue Analysis

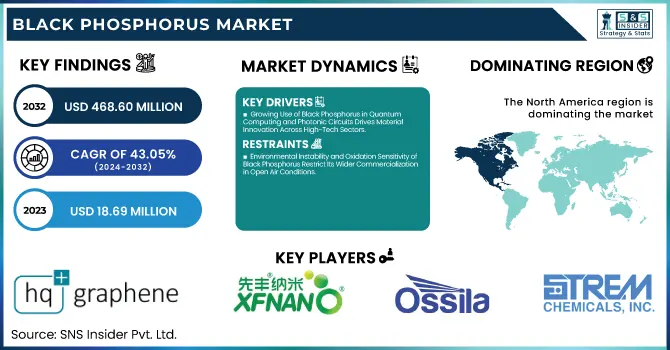
To Get more information on Black Phosphorus Market - Request Free Sample Report

The Black Phosphorus Market is gaining momentum as innovations and sustainability drive its growth. Our report explores a comparative analysis of exfoliation methods, revealing how each impacts purity and scalability. It investigates raw material sourcing and logistics trends, emphasizing global supply chain shifts. A detailed cost structure breakdown by production stage uncovers key operational expenses. Buyer preferences are analyzed to understand demand for various forms like powder and crystal. As environmental concerns grow, the report examines the ecological footprint of black phosphorus production. It also highlights government funding for nanomaterial research, showcasing its influence on technological progress. This insightful narrative delivers a strategic perspective for stakeholders navigating the evolving black phosphorus landscape with precision and foresight.

The US Black Phosphorus Market Size was valued at USD 4.91 Million in 2023 with a market share of around 71% and growing at a significant CAGR over the forecast period of 2024-2032.

The US Black Phosphorus market is witnessing steady growth, driven by advancements in electronics, energy storage, and nanotechnology research. The rising demand for two-dimensional materials in optoelectronics and semiconductors is supported by institutions like the National Nanotechnology Initiative (NNI) and funding from the U.S. Department of Energy. Companies such as Angstron Materials Inc. and Graphene Laboratories Inc., based in the U.S., are actively engaged in the development and supply of black phosphorus-based products. Furthermore, growing R&D investments from universities and research labs, including those supported by the National Science Foundation, are accelerating innovations in black phosphorus applications, making the U.S. a prominent market contributor.

Black Phosphorus Market Dynamics

Drivers

  • Growing Use of Black Phosphorus in Quantum Computing and Photonic Circuits Drives Material Innovation Across High-Tech Sectors

The increasing interest in quantum computing and photonic integrated circuits has created a significant opportunity for black phosphorus-based materials. Unlike traditional silicon-based semiconductors, black phosphorus exhibits a tunable bandgap and high carrier mobility, making it ideal for next-generation quantum devices and ultrafast photonic processors. Companies and research organizations in the United States, such as MIT Lincoln Laboratory and IBM Research, are exploring black phosphorus for its unique properties in controlling quantum states and light-matter interactions. Its anisotropic nature allows for directional control of electrons and photons, which is critical in quantum logic gates and photonic switching applications. As global competition for quantum supremacy intensifies, the adoption of advanced 2D materials like black phosphorus is becoming increasingly relevant. Our report highlights how this emerging use case is translating into commercial and research investments, particularly in North America and parts of Asia Pacific, pushing market players to scale up production and refine synthesis methods. This trend not only expands the application base of black phosphorus but also strengthens its strategic importance in the global semiconductor ecosystem.

Restraints

  • Environmental Instability and Oxidation Sensitivity of Black Phosphorus Restrict Its Wider Commercialization in Open Air Conditions

One of the key technical limitations of black phosphorus is its high sensitivity to oxygen and moisture, which leads to rapid degradation in ambient conditions. This environmental instability limits its usability in commercial applications unless it is encapsulated or protected under inert conditions. The need for protective packaging or stabilizing agents increases production costs and complicates downstream processing, thereby slowing down widespread adoption. Researchers across U.S. institutions such as Stanford University and Argonne National Laboratory are actively developing encapsulation techniques to enhance air stability, but the results have yet to achieve mainstream scalability. As a result, despite the strong interest in black phosphorus, many companies are hesitant to adopt it for mass production, especially in applications where long-term environmental exposure is unavoidable. This factor significantly hinders its market penetration, particularly in low-cost electronics and outdoor sensing devices. The report explores how these limitations are influencing product development timelines and increasing dependency on laboratory-grade handling, which restricts commercial rollout.

Opportunities

  • Strategic Collaborations Between Industry and Academia Accelerate Product Innovation and Expand Commercialization Pathways Globally

The growing number of public-private partnerships between industry leaders and academic institutions is a powerful driver for innovation in the black phosphorus market. Collaborations such as those between Harvard University and materials startups, or the U.S. Department of Energy’s National Labs with domestic manufacturers, are accelerating the translation of black phosphorus research into market-ready technologies. These partnerships often bring together multidisciplinary teams focused on specific challenges, such as air-stability, high-volume production, and energy storage efficiency. As a result, companies gain early access to intellectual property, while universities benefit from funding and real-world validation of their work. These joint ventures are also fostering startup creation, technology licensing, and even government-backed pilot projects. This dynamic ecosystem supports the rapid commercialization of advanced black phosphorus materials and helps build a global supply chain infrastructure. Our report evaluates several case studies and their impact on R&D pipelines, production ramp-up strategies, and long-term market forecasts.

Challenge

  • Inconsistent Quality Standards and Lack of Certification Frameworks Impact Material Performance and Market Credibility

As the black phosphorus market grows, inconsistency in material quality and absence of standardized grading systems are becoming major challenges. Currently, different producers offer black phosphorus with varying degrees of purity, particle size distribution, and oxidation levels, which directly impact performance in downstream applications. This lack of standardization makes it difficult for buyers especially in sectors like pharmaceuticals and electronics to rely on consistent material behavior. Additionally, the absence of global certification or regulatory frameworks for black phosphorus complicates cross-border trade and compliance. The report highlights how the absence of standardized quality metrics is delaying product approvals and increasing the burden on end-users to validate material properties independently. This not only increases operational costs but also undermines trust, ultimately stalling broader market adoption.

Black Phosphorus Market Segmental Analysis

By Form

In 2023, the powder form segment dominated the black phosphorus market with a 57.9% market share, driven by its superior versatility in research and commercial applications. Powdered black phosphorus is widely used in nanoelectronics, drug delivery systems, and energy storage due to its larger surface area and easier integration into composites and coatings. Institutions such as the U.S. Department of Energy’s Oak Ridge National Laboratory and Lawrence Berkeley National Laboratory have actively used powdered black phosphorus in supercapacitor and lithium-ion battery research, enhancing energy density and charge efficiency. Additionally, its powder form facilitates scalable manufacturing, making it ideal for prototyping and testing in flexible electronics and photonics. The ease of dispersion into solvents and polymers also supports its growing demand in material science research, particularly in the U.S. and Europe. As a result, powder black phosphorus continues to be favored over crystal form for both academic exploration and industry-level deployment, reinforcing its dominant position in the market.

By Application

In 2023, the energy storage segment dominated the black phosphorus market, holding a 41.7% market share, due to the material’s exceptional electrochemical performance and ability to improve battery energy density. Black phosphorus exhibits high theoretical capacity and faster lithium diffusion, making it ideal for next-generation lithium-ion and sodium-ion batteries. U.S.-based Argonne National Laboratory and Sandia National Laboratories have conducted extensive research integrating black phosphorus into anode materials, demonstrating improved cycling stability and rate performance. Its natural layered structure allows for efficient ion intercalation, a critical function in high-performance batteries. Furthermore, initiatives like the Biden-Harris Administration’s $7 billion investment in domestic battery supply chains have accelerated public and private sector R&D, boosting the adoption of advanced materials like black phosphorus. Companies developing EVs and grid-scale storage systems are increasingly exploring this material for enhancing storage efficiency, particularly as global demand for longer-lasting, faster-charging batteries surges. Thus, energy storage applications have emerged as the most lucrative and fastest-developing use-case in the black phosphorus market.

Black Phosphorus Market Regional Outlook

North America dominated the black phosphorus market in 2023 with a 36.8% market share, owing to its robust research ecosystem, advanced material science infrastructure, and supportive federal funding. The United States led the regional market due to active participation from national research institutions such as the National Science Foundation (NSF) and the U.S. Department of Energy, which funded significant R&D projects exploring black phosphorus for electronics, energy storage, and photonic devices. Additionally, universities like MIT, Stanford, and Harvard have been at the forefront of developing black phosphorus-based applications in quantum computing and biomedical engineering. Several U.S.-based nanotech startups and specialty material companies have also emerged, collaborating with defense and aerospace sectors on sensors and IR photodetectors. Canada followed as the second-largest contributor within North America, supported by government-backed nanotechnology programs and academic research hubs like the University of Toronto and McGill University, which are actively working on 2D material integration in optoelectronics. Furthermore, policies under the CHIPS and Science Act and Inflation Reduction Act have incentivized domestic production and R&D for critical materials, including black phosphorus, ensuring that the region maintains its technological edge and market leadership. The availability of high-purity phosphorus resources, skilled labor, and robust patent portfolios in North America has further enhanced its dominance in both academic and commercial spheres of black phosphorus development.

On the other hand, Asia Pacific is emerged as the fastest-growing region in the black phosphorus market with a significant growth rate during the forecast period. The dominance is driven by expanding electronics manufacturing, rising investments in nanotechnology, and strong government support for advanced material R&D. Countries like China, South Korea, and Japan are at the forefront of black phosphorus integration into flexible electronics, sensors, and energy devices. China, in particular, is aggressively investing in 2D material research through initiatives supported by the Chinese Academy of Sciences and has already demonstrated large-scale black phosphorus synthesis capabilities. Several Chinese universities have published extensive research on black phosphorus transistors and battery anodes, signaling an accelerating shift toward commercial application. South Korea has also made significant strides, with institutions like KAIST and Seoul National University collaborating with tech giants such as Samsung and LG to explore the use of black phosphorus in display technology and next-gen wearable electronics. Japan, with its precision in semiconductor manufacturing, is leveraging black phosphorus for advanced photonics and quantum applications. Government-backed nanomaterial innovation hubs in these countries are fostering an ecosystem of rapid prototyping and commercialization. The growth of Asia Pacific is further propelled by local demand for high-performance materials in electric vehicles and IoT devices, making it the region to watch in terms of technological advancement and market expansion for black phosphorus.

Black-Phosphorus-Market-Regional-Share

Get Customized Report as per Your Business Requirement - Enquiry Now

Key Players

  • 2D Semiconductors Inc. (Black Phosphorus Crystals, Black Phosphorus Flakes, Black Phosphorus Thin Films)

  • Angstron Materials Inc. (Black Phosphorus Nanosheets, Black Phosphorus Nanoparticles, Few-layer Black Phosphorus)

  • BlackPhos GmbH (Black Phosphorus Crystals, Few-layer Black Phosphorus, Black Phosphorus Quantum Dots)

  • BMP Technology Co., Ltd. (Black Phosphorus Powder, High-Purity Black Phosphorus, Crystalline Black Phosphorus)

  • HQ Graphene (Black Phosphorus Crystals, Black Phosphorus Thin Flakes, Monolayer Black Phosphorus)

  • Hunan XFNANO Materials Co., Ltd. (Black Phosphorus Nanopowder, Few-layer BP Nanosheets, BP Dispersions)

  • XFNANO Materials Tech Co., Ltd. (Black Phosphorus Nanosheets, BP Powder, BP in Organic Solvents)

  • Smart Elements GmbH (Crystalline Black Phosphorus, Black Phosphorus Granules, Black Phosphorus Lumps)

  • SixCarbon Technology (BP Monolayer Sheets, Few-layer Black Phosphorus, Device-grade BP Flakes)

  • Nanoshel LLC (Black Phosphorus Nanopowder, BP Quantum Dots, BP Nanoparticles)

  • Ossila Ltd. (Black Phosphorus Flakes, Exfoliated BP Suspension, BP Monolayers)

  • Nanostructured & Amorphous Materials, Inc. (Black Phosphorus Powder, BP Nanomaterials, High Surface Area BP)

  • Strem Chemicals Inc. (Black Phosphorus Powder, Laboratory-grade Black Phosphorus)

  • Synthia Materials Inc. (Few-layer Black Phosphorus, BP Nanoflakes, Exfoliated BP Powder)

  • Hunan Fuda Chemical Co., Ltd. (Black Phosphorus Powder, Crystalline BP Samples, BP Bulk Powder)

  • Abalonyx AS (Exfoliated Black Phosphorus, BP Nanosheets)

  • Black Magic Nanomaterials (BP Nanoflakes, Black Phosphorus Dispersion)

  • NeoCarbon Materials (Few-layer BP Sheets, BP for Optoelectronics)

  • NanoIntegris Technologies (Black Phosphorus Flakes, BP Suspensions)

  • Graphene Laboratories Inc. (Black Phosphorus Crystals, BP Nanosheets)

Recent Developments

  • May 2024: Chinese researchers used black phosphorus microbubbles and ultrasound to treat rats with Parkinson’s disease. The treatment reduced brain inflammation and improved motor function, showing promise as a non-invasive therapy by modulating microglial activity and aiding in neuroprotection.

  • June 2023: Prague-based scientists created a flexible sensor using black phosphorus and polyaniline fabric to translate Braille into speech. The cost-effective, wearable interface offered high sensitivity and durability, presenting a significant advancement in assistive technologies for visually and speech-impaired users.

Black Phosphorus Market Report Scope:

Report Attributes Details
Market Size in 2023 USD 18.69 Million
Market Size by 2032 USD 468.60 Million
CAGR CAGR of 43.05% From 2024 to 2032
Base Year 2023
Forecast Period 2024-2032
Historical Data 2020-2022
Report Scope & Coverage Market Size, Segments Analysis, Competitive  Landscape, Regional Analysis, DROC & SWOT Analysis, Forecast Outlook
Key Segments •By Form (Crystal, Powder)
•By Application (Electronic devices, Energy storage, Sensors, Others)
Regional Analysis/Coverage North America (US, Canada, Mexico), Europe (Eastern Europe [Poland, Romania, Hungary, Turkey, Rest of Eastern Europe] Western Europe] Germany, France, UK, Italy, Spain, Netherlands, Switzerland, Austria, Rest of Western Europe]), Asia Pacific (China, India, Japan, South Korea, Vietnam, Singapore, Australia, Rest of Asia Pacific), Middle East & Africa (Middle East [UAE, Egypt, Saudi Arabia, Qatar, Rest of Middle East], Africa [Nigeria, South Africa, Rest of Africa], Latin America (Brazil, Argentina, Colombia, Rest of Latin America)
Company Profiles 2D Semiconductors Inc., XFNANO Materials Tech Co., Ltd., Smart Elements GmbH, Nanochemazone, Shanghai Richem International Co., Ltd., Hunan XFNANO Materials Co., Ltd., SixCarbon Technology, HQ Graphene, Angstron Materials Inc., Graphene Laboratories Inc. and other key players

Frequently Asked Questions

Ans: The Black Phosphorus Market is expected to grow from USD 18.69 million in 2023 to USD 468.60 million by 2032.

Ans: The Black Phosphorus Market benefits from its tunable bandgap and anisotropic properties for quantum logic and photonic circuits.

Ans: Powder form leads the Black Phosphorus Market with 57.9% share due to ease of integration in energy and electronic applications.

Ans: Strategic partnerships between academia and industry are accelerating innovation in the Black Phosphorus Market globally.

Ans: North America dominated the Black Phosphorus Market in 2023 with a 36.8% share due to strong research and funding support.

Table of Contents:

1. Introduction

1.1 Market Definition

1.2 Scope (Inclusion and Exclusions)

1.3 Research Assumptions

2. Executive Summary

2.1 Market Overview

2.2 Regional Synopsis

2.3 Competitive Summary

3. Research Methodology

3.1 Top-Down Approach

3.2 Bottom-up Approach

3.3. Data Validation

3.4 Primary Interviews

4. Market Dynamics Impact Analysis

4.1 Market Driving Factors Analysis

4.1.2 Drivers

4.1.2 Restraints

4.1.3 Opportunities

4.1.4 Challenges

4.2 PESTLE Analysis

4.3 Porter’s Five Forces Model

5. Statistical Insights and Trends Reporting

5.1 Comparison of Exfoliation Methods Used

5.2 Raw Material Sourcing and Logistics Trends

5.3 Cost Structure Breakdown by Production Stage

5.4 Buyer Preferences for Product Forms

5.5 Environmental Impact of Black Phosphorus Production

5.6 Government Funding for Nanomaterial Research

6. Competitive Landscape

6.1 List of Major Companies, By Region

6.2 Market Share Analysis, By Region

6.3 Product Benchmarking

6.3.1 Product specifications and features

6.3.2 Pricing

6.4 Strategic Initiatives

6.4.1 Marketing and promotional activities

6.4.2 Distribution and supply chain strategies

6.4.3 Expansion plans and new product launches

6.4.4 Strategic partnerships and collaborations

6.5 Technological Advancements

6.6 Market Positioning and Branding

7. Black Phosphorus Market Segmentation, by Form

7.1 Chapter Overview

7.2 Crystal

7.2.1 Crystal Market Trends Analysis (2020-2032)

7.2.2 Crystal Market Size Estimates and Forecasts to 2032 (USD Million)

7.3 Powder

7.3.1 Powder Market Trends Analysis (2020-2032)

7.3.2 Powder Market Size Estimates and Forecasts to 2032 (USD Million)

8. Black Phosphorus Market Segmentation, by Application

8.1 Chapter Overview

8.2 Electronic devices

8.2.1 Electronic devices Market Trends Analysis (2020-2032)

8.2.2 Electronic devices Market Size Estimates and Forecasts to 2032 (USD Million)

8.3 Energy storage

8.3.1 Energy storage Market Trends Analysis (2020-2032)

8.3.2 Energy storage Market Size Estimates and Forecasts to 2032 (USD Million)

8.4 Sensors

8.4.1 Sensors Market Trends Analysis (2020-2032)

8.4.2 Sensors Market Size Estimates and Forecasts to 2032 (USD Million)

8.5 Others

8.5.1 Others Market Trends Analysis (2020-2032)

8.5.2 Others Market Size Estimates and Forecasts to 2032 (USD Million)

9. Regional Analysis

9.1 Chapter Overview

9.2 North America

9.2.1 Trends Analysis

9.2.2 North America Black Phosphorus Market Estimates and Forecasts, by Country (2020-2032) (USD Million)

9.2.3 North America Black Phosphorus Market Estimates and Forecasts, by Form (2020-2032) (USD Million) 

9.2.4 North America Black Phosphorus Market Estimates and Forecasts, by Application (2020-2032) (USD Million)

9.2.5 USA

9.2.5.1 USA Black Phosphorus Market Estimates and Forecasts, by Form (2020-2032) (USD Million)

9.2.5.2 USA Black Phosphorus Market Estimates and Forecasts, by Application (2020-2032) (USD Million)

9.2.6 Canada

9.2.6.1 Canada Black Phosphorus Market Estimates and Forecasts, by Form (2020-2032) (USD Million)

9.2.6.2 Canada Black Phosphorus Market Estimates and Forecasts, by Application (2020-2032) (USD Million)

9.2.7 Mexico

9.2.7.1 Mexico Black Phosphorus Market Estimates and Forecasts, by Form (2020-2032) (USD Million)

9.2.7.2 Mexico Black Phosphorus Market Estimates and Forecasts, by Application (2020-2032) (USD Million)

9.3 Europe

9.3.1 Eastern Europe

9.3.1.1 Trends Analysis

9.3.1.2 Eastern Europe Black Phosphorus Market Estimates and Forecasts, by Country (2020-2032) (USD Million)

9.3.1.3 Eastern Europe Black Phosphorus Market Estimates and Forecasts, by Form (2020-2032) (USD Million) 

9.3.1.4 Eastern Europe Black Phosphorus Market Estimates and Forecasts, by Application (2020-2032) (USD Million)

9.3.1.5 Poland

9.3.1.5.1 Poland Black Phosphorus Market Estimates and Forecasts, by Form (2020-2032) (USD Million)

9.3.1.5.2 Poland Black Phosphorus Market Estimates and Forecasts, by Application (2020-2032) (USD Million)

9.3.1.6 Romania

9.3.1.6.1 Romania Black Phosphorus Market Estimates and Forecasts, by Form (2020-2032) (USD Million)

9.3.1.6.2 Romania Black Phosphorus Market Estimates and Forecasts, by Application (2020-2032) (USD Million)

9.3.1.7 Hungary

9.3.1.7.1 Hungary Black Phosphorus Market Estimates and Forecasts, by Form (2020-2032) (USD Million)

9.3.1.7.2 Hungary Black Phosphorus Market Estimates and Forecasts, by Application (2020-2032) (USD Million)

9.3.1.8 Turkey

9.3.1.8.1 Turkey Black Phosphorus Market Estimates and Forecasts, by Form (2020-2032) (USD Million)

9.3.1.8.2 Turkey Black Phosphorus Market Estimates and Forecasts, by Application (2020-2032) (USD Million)

9.3.1.9 Rest of Eastern Europe

9.3.1.9.1 Rest of Eastern Europe Black Phosphorus Market Estimates and Forecasts, by Form (2020-2032) (USD Million)

9.3.1.9.2 Rest of Eastern Europe Black Phosphorus Market Estimates and Forecasts, by Application (2020-2032) (USD Million)

9.3.2 Western Europe

9.3.2.1 Trends Analysis

9.3.2.2 Western Europe Black Phosphorus Market Estimates and Forecasts, by Country (2020-2032) (USD Million)

9.3.2.3 Western Europe Black Phosphorus Market Estimates and Forecasts, by Form (2020-2032) (USD Million) 

9.3.2.4 Western Europe Black Phosphorus Market Estimates and Forecasts, by Application (2020-2032) (USD Million)

9.3.2.5 Germany

9.3.2.5.1 Germany Black Phosphorus Market Estimates and Forecasts, by Form (2020-2032) (USD Million)

9.3.2.5.2 Germany Black Phosphorus Market Estimates and Forecasts, by Application (2020-2032) (USD Million)

9.3.2.6 France

9.3.2.6.1 France Black Phosphorus Market Estimates and Forecasts, by Form (2020-2032) (USD Million)

9.3.2.6.2 France Black Phosphorus Market Estimates and Forecasts, by Application (2020-2032) (USD Million)

9.3.2.7 UK

9.3.2.7.1 UK Black Phosphorus Market Estimates and Forecasts, by Form (2020-2032) (USD Million)

9.3.2.7.2 UK Black Phosphorus Market Estimates and Forecasts, by Application (2020-2032) (USD Million)

9.3.2.8 Italy

9.3.2.8.1 Italy Black Phosphorus Market Estimates and Forecasts, by Form (2020-2032) (USD Million)

9.3.2.8.2 Italy Black Phosphorus Market Estimates and Forecasts, by Application (2020-2032) (USD Million)

9.3.2.9 Spain

9.3.2.9.1 Spain Black Phosphorus Market Estimates and Forecasts, by Form (2020-2032) (USD Million)

9.3.2.9.2 Spain Black Phosphorus Market Estimates and Forecasts, by Application (2020-2032) (USD Million)

9.3.2.10 Netherlands

9.3.2.10.1 Netherlands Black Phosphorus Market Estimates and Forecasts, by Form (2020-2032) (USD Million)

9.3.2.10.2 Netherlands Black Phosphorus Market Estimates and Forecasts, by Application (2020-2032) (USD Million)

9.3.2.11 Switzerland

9.3.2.11.1 Switzerland Black Phosphorus Market Estimates and Forecasts, by Form (2020-2032) (USD Million)

9.3.2.11.2 Switzerland Black Phosphorus Market Estimates and Forecasts, by Application (2020-2032) (USD Million)

9.3.2.12 Austria

9.3.2.12.1 Austria Black Phosphorus Market Estimates and Forecasts, by Form (2020-2032) (USD Million)

9.3.2.12.2 Austria Black Phosphorus Market Estimates and Forecasts, by Application (2020-2032) (USD Million)

9.3.2.13 Rest of Western Europe

9.3.2.13.1 Rest of Western Europe Black Phosphorus Market Estimates and Forecasts, by Form (2020-2032) (USD Million)

9.3.2.13.2 Rest of Western Europe Black Phosphorus Market Estimates and Forecasts, by Application (2020-2032) (USD Million)

9.4 Asia Pacific

9.4.1 Trends Analysis

9.4.2 Asia Pacific Black Phosphorus Market Estimates and Forecasts, by Country (2020-2032) (USD Million)

9.4.3 Asia Pacific Black Phosphorus Market Estimates and Forecasts, by Form (2020-2032) (USD Million) 

9.4.4 Asia Pacific Black Phosphorus Market Estimates and Forecasts, by Application (2020-2032) (USD Million)

9.4.5 China

9.4.5.1 China Black Phosphorus Market Estimates and Forecasts, by Form (2020-2032) (USD Million)

9.4.5.2 China Black Phosphorus Market Estimates and Forecasts, by Application (2020-2032) (USD Million)

9.4.6 India

9.4.5.1 India Black Phosphorus Market Estimates and Forecasts, by Form (2020-2032) (USD Million)

9.4.5.2 India Black Phosphorus Market Estimates and Forecasts, by Application (2020-2032) (USD Million)

9.4.5 Japan

9.4.5.1 Japan Black Phosphorus Market Estimates and Forecasts, by Form (2020-2032) (USD Million)

9.4.5.2 Japan Black Phosphorus Market Estimates and Forecasts, by Application (2020-2032) (USD Million)

9.4.6 South Korea

9.4.6.1 South Korea Black Phosphorus Market Estimates and Forecasts, by Form (2020-2032) (USD Million)

9.4.6.2 South Korea Black Phosphorus Market Estimates and Forecasts, by Application (2020-2032) (USD Million)

9.4.7 Vietnam

9.4.7.1 Vietnam Black Phosphorus Market Estimates and Forecasts, by Form (2020-2032) (USD Million)

9.2.7.2 Vietnam Black Phosphorus Market Estimates and Forecasts, by Application (2020-2032) (USD Million)

9.4.8 Singapore

9.4.8.1 Singapore Black Phosphorus Market Estimates and Forecasts, by Form (2020-2032) (USD Million)

9.4.8.2 Singapore Black Phosphorus Market Estimates and Forecasts, by Application (2020-2032) (USD Million)

9.4.9 Australia

9.4.9.1 Australia Black Phosphorus Market Estimates and Forecasts, by Form (2020-2032) (USD Million)

9.4.9.2 Australia Black Phosphorus Market Estimates and Forecasts, by Application (2020-2032) (USD Million)

9.4.10 Rest of Asia Pacific

9.4.10.1 Rest of Asia Pacific Black Phosphorus Market Estimates and Forecasts, by Form (2020-2032) (USD Million)

9.4.10.2 Rest of Asia Pacific Black Phosphorus Market Estimates and Forecasts, by Application (2020-2032) (USD Million)

9.5 Middle East and Africa

9.5.1 Middle East

9.5.1.1 Trends Analysis

9.5.1.2 Middle East Black Phosphorus Market Estimates and Forecasts, by Country (2020-2032) (USD Million)

9.5.1.3 Middle East Black Phosphorus Market Estimates and Forecasts, by Form (2020-2032) (USD Million) 

9.5.1.4 Middle East Black Phosphorus Market Estimates and Forecasts, by Application (2020-2032) (USD Million)

9.5.1.5 UAE

9.5.1.5.1 UAE Black Phosphorus Market Estimates and Forecasts, by Form (2020-2032) (USD Million)

9.5.1.5.2 UAE Black Phosphorus Market Estimates and Forecasts, by Application (2020-2032) (USD Million)

9.5.1.6 Egypt

9.5.1.6.1 Egypt Black Phosphorus Market Estimates and Forecasts, by Form (2020-2032) (USD Million)

9.5.1.6.2 Egypt Black Phosphorus Market Estimates and Forecasts, by Application (2020-2032) (USD Million)

9.5.1.7 Saudi Arabia

9.5.1.7.1 Saudi Arabia Black Phosphorus Market Estimates and Forecasts, by Form (2020-2032) (USD Million)

9.5.1.7.2 Saudi Arabia Black Phosphorus Market Estimates and Forecasts, by Application (2020-2032) (USD Million)

9.5.1.8 Qatar

9.5.1.8.1 Qatar Black Phosphorus Market Estimates and Forecasts, by Form (2020-2032) (USD Million)

9.5.1.8.2 Qatar Black Phosphorus Market Estimates and Forecasts, by Application (2020-2032) (USD Million)

9.5.1.9 Rest of Middle East

9.5.1.9.1 Rest of Middle East Black Phosphorus Market Estimates and Forecasts, by Form (2020-2032) (USD Million)

9.5.1.9.2 Rest of Middle East Black Phosphorus Market Estimates and Forecasts, by Application (2020-2032) (USD Million)

9.5.2 Africa

9.5.2.1 Trends Analysis

9.5.2.2 Africa Black Phosphorus Market Estimates and Forecasts, by Country (2020-2032) (USD Million)

9.5.2.3 Africa Black Phosphorus Market Estimates and Forecasts, by Form (2020-2032) (USD Million) 

9.5.2.4 Africa Black Phosphorus Market Estimates and Forecasts, by Application (2020-2032) (USD Million)

9.5.2.5 South Africa

9.5.2.5.1 South Africa Black Phosphorus Market Estimates and Forecasts, by Form (2020-2032) (USD Million)

9.5.2.5.2 South Africa Black Phosphorus Market Estimates and Forecasts, by Application (2020-2032) (USD Million)

9.5.2.6 Nigeria

9.5.2.6.1 Nigeria Black Phosphorus Market Estimates and Forecasts, by Form (2020-2032) (USD Million)

9.5.2.6.2 Nigeria Black Phosphorus Market Estimates and Forecasts, by Application (2020-2032) (USD Million)

9.5.2.7 Rest of Africa

9.5.2.7.1 Rest of Africa Black Phosphorus Market Estimates and Forecasts, by Form (2020-2032) (USD Million)

9.5.2.7.2 Rest of Africa Black Phosphorus Market Estimates and Forecasts, by Application (2020-2032) (USD Million)

9.6 Latin America

9.6.1 Trends Analysis

9.6.2 Latin America Black Phosphorus Market Estimates and Forecasts, by Country (2020-2032) (USD Million)

9.6.3 Latin America Black Phosphorus Market Estimates and Forecasts, by Form (2020-2032) (USD Million) 

9.6.4 Latin America Black Phosphorus Market Estimates and Forecasts, by Application (2020-2032) (USD Million)

9.6.5 Brazil

9.6.5.1 Brazil Black Phosphorus Market Estimates and Forecasts, by Form (2020-2032) (USD Million)

9.6.5.2 Brazil Black Phosphorus Market Estimates and Forecasts, by Application (2020-2032) (USD Million)

9.6.6 Argentina

9.6.6.1 Argentina Black Phosphorus Market Estimates and Forecasts, by Form (2020-2032) (USD Million)

9.6.6.2 Argentina Black Phosphorus Market Estimates and Forecasts, by Application (2020-2032) (USD Million)

9.6.7 Colombia

9.6.7.1 Colombia Black Phosphorus Market Estimates and Forecasts, by Form (2020-2032) (USD Million)

9.6.7.2 Colombia Black Phosphorus Market Estimates and Forecasts, by Application (2020-2032) (USD Million)

9.6.8 Rest of Latin America

9.6.8.1 Rest of Latin America Black Phosphorus Market Estimates and Forecasts, by Form (2020-2032) (USD Million)

9.6.8.2 Rest of Latin America Black Phosphorus Market Estimates and Forecasts, by Application (2020-2032) (USD Million)

10. Company Profiles

10.1 2D Semiconductors Inc.

10.1.1 Company Overview

10.1.2 Financial

10.1.3 Products/ Services Offered

110.1.4 SWOT Analysis

10.2 XFNANO Materials Tech Co., Ltd.

10.2.1 Company Overview

10.2.2 Financial

10.2.3 Products/ Services Offered

10.2.4 SWOT Analysis

10.3 Smart Elements GmbH

10.3.1 Company Overview

10.3.2 Financial

10.3.3 Products/ Services Offered

10.3.4 SWOT Analysis

10.4 Nanochemazone

10.4.1 Company Overview

10.4.2 Financial

10.4.3 Products/ Services Offered

10.4.4 SWOT Analysis

10.5 Shanghai Richem International Co., Ltd.

10.5.1 Company Overview

10.5.2 Financial

10.5.3 Products/ Services Offered

10.5.4 SWOT Analysis

10.6 Hunan XFNANO Materials Co., Ltd.

10.6.1 Company Overview

10.6.2 Financial

10.6.3 Products/ Services Offered

10.6.4 SWOT Analysis

10.7 SixCarbon Technology

10.7.1 Company Overview

10.7.2 Financial

10.7.3 Products/ Services Offered

10.7.4 SWOT Analysis

10.8 HQ Graphene

10.8.1 Company Overview

10.8.2 Financial

10.8.3 Products/ Services Offered

10.8.4 SWOT Analysis

10.9 Angstron Materials Inc.

10.9.1 Company Overview

10.9.2 Financial

10.9.3 Products/ Services Offered

10.9.4 SWOT Analysis

10.10 Graphene Laboratories Inc.

             10.9.1 Company Overview

10.9.2 Financial

10.9.3 Products/ Services Offered

10.9.4 SWOT Analysis

11. Use Cases and Best Practices

12. Conclusion

An accurate research report requires proper strategizing as well as implementation. There are multiple factors involved in the completion of good and accurate research report and selecting the best methodology to compete the research is the toughest part. Since the research reports we provide play a crucial role in any company’s decision-making process, therefore we at SNS Insider always believe that we should choose the best method which gives us results closer to reality. This allows us to reach at a stage wherein we can provide our clients best and accurate investment to output ratio.

Each report that we prepare takes a timeframe of 350-400 business hours for production. Starting from the selection of titles through a couple of in-depth brain storming session to the final QC process before uploading our titles on our website we dedicate around 350 working hours. The titles are selected based on their current market cap and the foreseen CAGR and growth.


The 5 steps process:

Step 1: Secondary Research:

Secondary Research or Desk Research is as the name suggests is a research process wherein, we collect data through the readily available information. In this process we use various paid and unpaid databases which our team has access to and gather data through the same. This includes examining of listed companies’ annual reports, Journals, SEC filling etc. Apart from this our team has access to various associations across the globe across different industries. Lastly, we have exchange relationships with various university as well as individual libraries.

Secondary Research

Step 2: Primary Research

When we talk about primary research, it is a type of study in which the researchers collect relevant data samples directly, rather than relying on previously collected data.  This type of research is focused on gaining content specific facts that can be sued to solve specific problems. Since the collected data is fresh and first hand therefore it makes the study more accurate and genuine.

We at SNS Insider have divided Primary Research into 2 parts.

Part 1 wherein we interview the KOLs of major players as well as the upcoming ones across various geographic regions. This allows us to have their view over the market scenario and acts as an important tool to come closer to the accurate market numbers. As many as 45 paid and unpaid primary interviews are taken from both the demand and supply side of the industry to make sure we land at an accurate judgement and analysis of the market.

This step involves the triangulation of data wherein our team analyses the interview transcripts, online survey responses and observation of on filed participants. The below mentioned chart should give a better understanding of the part 1 of the primary interview.

Primary Research

Part 2: In this part of primary research the data collected via secondary research and the part 1 of the primary research is validated with the interviews from individual consultants and subject matter experts.

Consultants are those set of people who have at least 12 years of experience and expertise within the industry whereas Subject Matter Experts are those with at least 15 years of experience behind their back within the same space. The data with the help of two main processes i.e., FGDs (Focused Group Discussions) and IDs (Individual Discussions). This gives us a 3rd party nonbiased primary view of the market scenario making it a more dependable one while collation of the data pointers.

Step 3: Data Bank Validation

Once all the information is collected via primary and secondary sources, we run that information for data validation. At our intelligence centre our research heads track a lot of information related to the market which includes the quarterly reports, the daily stock prices, and other relevant information. Our data bank server gets updated every fortnight and that is how the information which we collected using our primary and secondary information is revalidated in real time.

Data Bank Validation

Step 4: QA/QC Process

After all the data collection and validation our team does a final level of quality check and quality assurance to get rid of any unwanted or undesired mistakes. This might include but not limited to getting rid of the any typos, duplication of numbers or missing of any important information. The people involved in this process include technical content writers, research heads and graphics people. Once this process is completed the title gets uploader on our platform for our clients to read it.

Step 5: Final QC/QA Process:

This is the last process and comes when the client has ordered the study. In this process a final QA/QC is done before the study is emailed to the client. Since we believe in giving our clients a good experience of our research studies, therefore, to make sure that we do not lack at our end in any way humanly possible we do a final round of quality check and then dispatch the study to the client.

Key Segments:

By Form

  • Crystal

  • Powder

By Application

  • Electronic devices

  • Energy storage

  • Sensors

  • Others

Request for Segment Customization as per your Business Requirement: Segment Customization Request

Regional Coverage:

North America

  • US

  • Canada

  • Mexico

Europe

  • Eastern Europe

    • Poland

    • Romania

    • Hungary

    • Turkey

    • Rest of Eastern Europe

  • Western Europe

    • Germany

    • France

    • UK

    • Italy

    • Spain

    • Netherlands

    • Switzerland

    • Austria

    • Rest of Western Europe

Asia Pacific

  • China

  • India

  • Japan

  • South Korea

  • Vietnam

  • Singapore

  • Australia

  • Rest of Asia Pacific

Middle East & Africa

  • Middle East

    • UAE

    • Egypt

    • Saudi Arabia

    • Qatar

    • Rest of Middle East

  • Africa

    • Nigeria

    • South Africa

    • Rest of Africa

Latin America

  • Brazil

  • Argentina

  • Colombia

  • Rest of Latin America

Request for Country Level Research Report: Country Level Customization Request

Available Customization

With the given market data, SNS Insider offers customization as per the company’s specific needs. The following customization options are available for the report:

  • Detailed Volume Analysis

  • Criss-Cross segment analysis (e.g. Product X Application)

  • Competitive Product Benchmarking

  • Geographic Analysis

  • Additional countries in any of the regions

  • Customized Data Representation

  • Detailed analysis and profiling of additional market players


  •            5000 (33% Discount)


  •            8950 (40% Discount)


  •            3050 (23% Discount)

Start a Conversation

Hi! Click one of our member below to chat on Phone