Hydrogen Detection Market Report Scope & Overview:
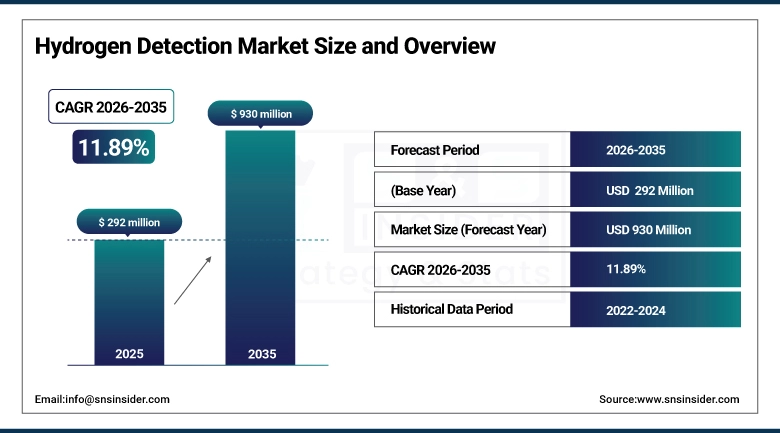
The Hydrogen Detection Market was valued at USD 292 million in 2025 and is expected to reach USD 930 million by 2035, growing at a CAGR of 11.89% from 2026-2035.
Hydrogen's safety profile is its most challenging property for widespread commercial adoption. At concentrations between 4% and 75% in air, hydrogen is flammable the widest explosive range of any fuel. It rises and disperses rapidly, is odourless and colourless, and burns with a nearly invisible flame. A hydrogen leak that goes undetected long enough accumulates to flammable concentrations in enclosed spaces, where a spark from any electrical equipment or static discharge can trigger deflagration or detonation. These characteristics make hydrogen detection not an optional safety enhancement but a fundamental requirement in any environment where hydrogen is produced, stored, transported, or used at meaningful concentrations. The market's extraordinary growth at nearly 12% CAGR reflects the collision of two forces: the existing large base of industrial hydrogen users in oil refining, ammonia production, and chemical synthesis who have always needed hydrogen detection, and the enormous new infrastructure investment in hydrogen as a clean energy carrier electrolyzers, hydrogen filling stations, fuel cell vehicles, hydrogen power plants, and hydrogen pipelines each of which creates new detection requirements in environments where hydrogen was not previously present.
The International Energy Agency's Global Hydrogen Review 2024 documents that hydrogen production reached 97 million metric tons in 2023, with electrolyzer-based green hydrogen production growing at 40% annually from its currently small base. The U.S. Department of Energy's Hydrogen Safety Panel has identified inadequate leak detection as one of the five primary hydrogen infrastructure safety risks requiring technical innovation.
Hydrogen Detection Market Size and Forecast
-
Market Size in 2025: USD 292 Million
-
Market Size by 2035: USD 930 Million
-
CAGR: 11.89% from 2026 to 2035
-
Base Year: 2025
-
Forecast Period: 2026-2035
-
Historical Data: 2022-2024
To Get more information on Hydrogen Detection Market - Request Free Sample Report
Hydrogen Detection Market Trends
-
Palladium-based resistive hydrogen sensors are advancing toward commercial deployment for ultra-sensitive detection applications in electrolyzer and fuel cell installations where parts-per-billion detection sensitivity is required.
-
MEMS-based hydrogen sensors combining extremely small form factors with low power consumption are enabling distributed sensor networks in hydrogen infrastructure with thousands of monitoring points at economically viable per-sensor costs.
-
Wireless IoT-enabled hydrogen detectors that integrate with industrial safety monitoring platforms and SCADA systems are enabling continuous real-time hydrogen safety monitoring across distributed infrastructure with centralized alarm management.
-
Optical hydrogen detection using near-infrared spectroscopy and cavity ring-down spectroscopy provides ultra-low false alarm rates for safety-critical applications in hydrogen fueling stations and large electrolyzer installations.
-
Regulatory standardization including IEC 60079-20 hazardous area classification for hydrogen environments, ATEX equipment certification in Europe, and NFPA 2 hydrogen safety codes in the U.S. is creating compliance-driven detector procurement across the hydrogen infrastructure sector.
-
Portable hydrogen detectors with Bluetooth connectivity and smartphone app integration are enabling maintenance workers and safety inspectors to log hydrogen detection readings directly to digital safety management systems during facility inspections.
-
Hydrogen detection sensor fusion combining multiple detection technologies in the same device for cross-validated readings is improving false alarm discrimination in environments where other gases could interfere with single-technology sensor readings.
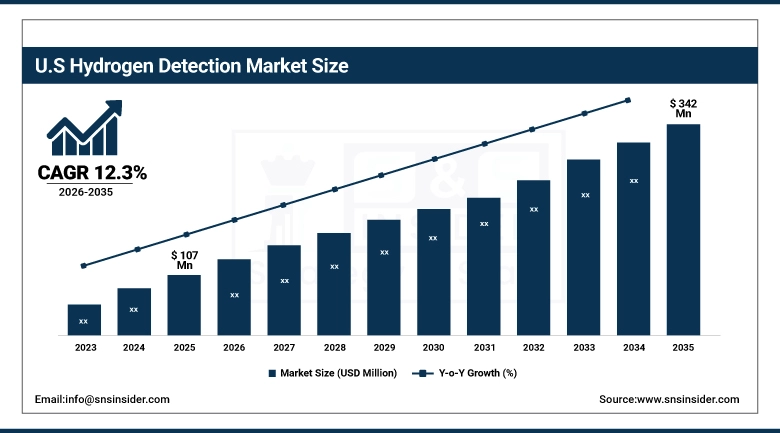
U.S. Hydrogen Detection Market was valued at USD 107 million in 2025 and is expected to reach USD 342 million by 2035, growing at a CAGR of 12.3% from 2026-2035.
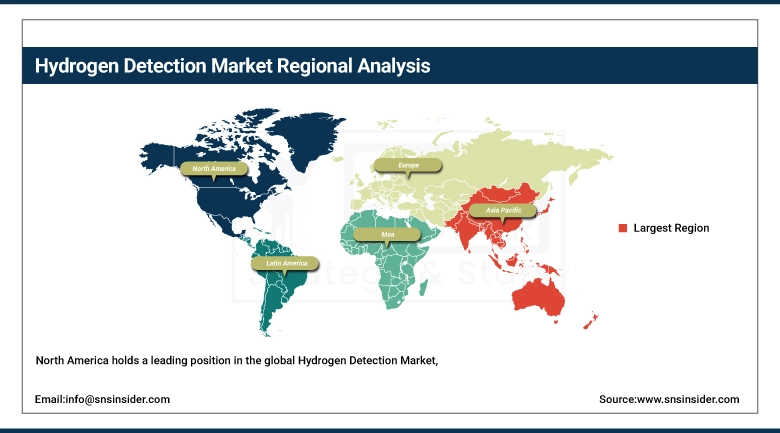
North America is a dominant region in the Hydrogen Detection Market, driven by the United States' extensive existing hydrogen infrastructure primarily in oil refining, ammonia production, and industrial chemical manufacturing combined with the hydrogen economy investments flowing from the Inflation Reduction Act's clean hydrogen production tax credits and the DOE's Regional Clean Hydrogen Hubs program. The eight regional hydrogen hub projects collectively represent over USD 7 billion in government co-investment that will create hydrogen production, distribution, and end-use infrastructure across the country all requiring comprehensive hydrogen detection and safety monitoring systems. U.S. refinery hydrogen infrastructure where hydrogen is consumed at millions of cubic feet per day in hydrocracking and hydrotreating operations represents the large existing industrial hydrogen detection base that provides market scale while the new hydrogen economy infrastructure develops.
The U.S. DOE's Regional Clean Hydrogen Hubs program has awarded USD 7 billion to eight hub projects across 12 states, with each hub required to demonstrate comprehensive hydrogen safety monitoring programs as part of their operational safety plans. The Clean Air Act's Process Safety Management standard (29 CFR 1910.119) requires continuous hydrogen leak detection at facilities handling hydrogen above its threshold quantity, creating non-discretionary regulatory compliance demand across U.S. chemical and petrochemical facilities.
Hydrogen Detection Market Segment Analysis
-
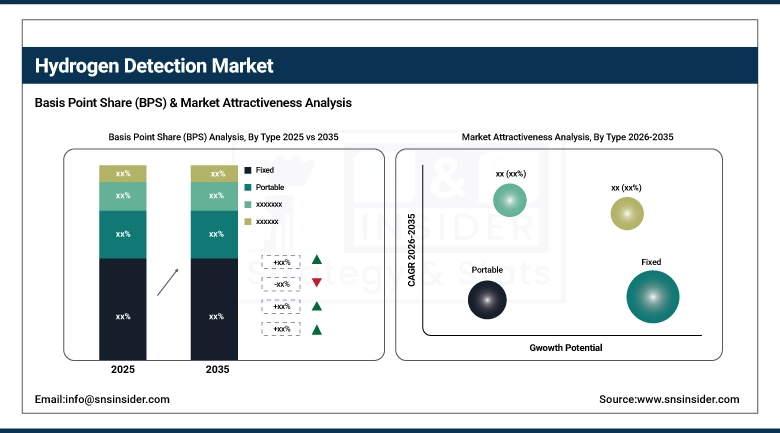
By Type, Fixed segment dominated the Hydrogen Detection Market in 2025; Portable fastest growing at 13.67% CAGR.
-
By Technology, Electromechanical dominated with 35% share in 2025; MEMS fastest growing at 15.29% CAGR.
-
By Detection Range, 0-1,000 ppm dominated; 0-5,000 ppm growing fastest at 12.95% CAGR.
-
By End-Use Industry, Oil & Gas dominated with 32% share in 2025; Automotive fastest growing at 13.71% CAGR.
By Type: Fixed dominates, Portable growing fastest at 13.67% CAGR
The Fixed segment maintained the dominant position in the Hydrogen Detection Market in 2025, reflecting the fundamental safety architecture of industrial hydrogen facilities where continuous, permanently installed monitoring is the only approach that ensures round-the-clock detection coverage in areas where personnel are not always present. Fixed hydrogen detectors mounted at appropriate locations near potential leak sources, at floor level where hydrogen can pool in confined spaces, and at ceiling level where hydrogen accumulates in enclosed rooms provide the persistent monitoring that scheduled inspection-based detection cannot. Industrial facilities that handle hydrogen under OSHA Process Safety Management requirements must maintain continuous detection in covered areas, creating regulatory compliance demand for fixed detector installation that cannot be substituted by portable alternatives. Fixed detector systems also enable integration with facility safety systems ventilation actuation, alarm systems, process shutdown that require the permanent wiring and addressable system integration that portable units cannot provide.
Portable Hydrogen Detectors are growing at the fastest type CAGR of approximately 13.67%, driven by the explosion of field-based hydrogen safety inspection, maintenance, and commissioning activity that the global hydrogen economy build-out is creating. Every hydrogen fueling station commissioning, every electrolyzer installation startup, every fuel cell vehicle fleet maintenance program requires portable detection capability for leak testing, confined space entry preparation, and ongoing operational safety checks. Portable detectors carried by maintenance technicians, safety officers, and inspection personnel complement fixed installations by providing detection capability in areas that fixed systems do not cover and by enabling investigation of specific suspected leak sources during maintenance operations. The growth of hydrogen fuel cell vehicle service where dealership technicians and first responders require portable hydrogen detection is creating a new high-volume commercial channel for portable detectors that manufacturers are actively developing products to serve.
The Hydrogen Fuel Cell Partnership documents that over 15,000 hydrogen fuel cell vehicles are on U.S. roads as of 2024, with each California dealer certified to service these vehicles required by NFPA 2 to maintain portable hydrogen detection equipment. The global hydrogen fueling station count exceeded 1,500 stations in 2024, each requiring both fixed perimeter detection and portable inspection capabilities.
By Technology: Electromechanical dominates, MEMS growing fastest at 15.29% CAGR
The Electromechanical segment held approximately 35% of the Hydrogen Detection Market in 2025, representing the established sensor category whose mechanical transduction of hydrogen concentration into electrical signals has proven reliable in industrial environments over decades of deployment. Electromechanical sensors including solid-state metal oxide semiconductor sensors that change resistance upon hydrogen exposure and bimetallic element sensors that deflect in response to thermal changes have the durability, installation simplicity, and maintenance familiarity that industrial safety systems demand. Their straightforward operating principle, which does not require complex optical alignments, gas sampling systems, or power-intensive electronics, makes them the natural first choice for straightforward hydrogen leak detection applications where the primary requirement is reliable alarming at fixed threshold concentrations.
Catalytic bead sensors where hydrogen combustion on a platinum-coated bead changes the bead's resistance relative to an inert reference bead are a significant technology subcategory within the broader electromechanical classification, representing the most widely deployed technology for general hydrogen leak detection in refineries, chemical plants, and industrial facilities. Their limitation requiring oxygen to function and susceptible to catalyst poisoning by certain contaminants has made alternative technologies attractive for specific application environments.
MEMS (Micro-Electro-Mechanical Systems) is the fastest-growing technology at approximately 15.29% CAGR, driven by the convergence of miniaturization, low power consumption, and mass manufacturing cost reduction that MEMS fabrication enables. A MEMS hydrogen sensor etched from silicon at the microscale can achieve detection sensitivities comparable to laboratory instruments in a device the size of a postage stamp, consuming milliwatts of power rather than the watts that conventional detectors draw. This combination of performance, size, and power efficiency makes MEMS sensors uniquely suited for the distributed, battery-powered wireless sensor networks that hydrogen infrastructure operators are deploying to achieve comprehensive monitoring coverage at economically viable per-point costs. Companies including Silicon Sensing, Sensirion, and several academic spinouts are advancing commercial MEMS hydrogen sensor products that are finding deployment in hydrogen vehicle applications, smart building hydrogen monitoring, and precision laboratory leak detection.
By End-Use Industry: Oil & Gas dominates at 32%, Automotive growing fastest at 13.71% CAGR
Oil & Gas held approximately 32% of the Hydrogen Detection Market in 2025, driven by the industry's extensive hydrogen consumption in refinery operations and its comprehensive process safety requirements that mandate continuous hydrogen monitoring across hydrogen production, purification, distribution, and consumption operations. U.S. oil refining alone consumes approximately 4 million metric tons of hydrogen annually for hydrotreating and hydrocracking processes that upgrade crude fractions into finished petroleum products creating a large, established industrial hydrogen detection customer base whose ongoing equipment maintenance and modernization sustains consistent market demand. The oil and gas industry's stringent safety culture, regulatory compliance requirements under OSHA PSM and EPA RMP, and the catastrophic consequence of hydrogen-related incidents in refinery environments make hydrogen detection investment a non-discretionary operational safety expense rather than a discretionary technology adoption decision.
The Chemical segment represents the second-largest end-use category, encompassing chlor-alkali plants (which produce hydrogen as a chlorine co-product), ammonia production facilities, methanol plants, and the broad range of organic chemical synthesis processes that use hydrogen as a reactant or produce it as a process byproduct. Chemical hydrogen detection requirements parallel oil and gas in their regulatory basis and industrial scale, creating a large existing market that is growing with chemical industry capacity expansion in Asia and the Middle East.
Automotive is expected to grow at the fastest CAGR of approximately 13.71%, driven by the expanding hydrogen fuel cell vehicle ecosystem. Hydrogen FCEV adoption is accelerating across Japan, South Korea, China, and Europe in the 2025-2035 timeframe, with Toyota, Hyundai, and developing Chinese fuel cell vehicle programs creating growing populations of hydrogen-fueled vehicles requiring safety detection systems. Each FCEV contains an integrated hydrogen detection system within the vehicle monitoring the hydrogen storage system, fuel cell stack, and ancillary plumbing for leaks that trigger ventilation responses and system shutdowns creating an embedded per-vehicle detection hardware content. Additionally, hydrogen vehicle service, fueling station operations, and fleet depot management all require external portable and fixed detection systems, multiplying the per-vehicle detection market contribution beyond the vehicle-integrated sensor alone.
Hydrogen Detection Market Regional Analysis
|
Region |
Major Country |
Share within Region (%) |
|---|---|---|
|
North America |
United States |
88% |
|
Europe |
Germany |
30% |
|
Asia Pacific |
Japan |
38% |
|
Middle East & Africa |
Saudi Arabia |
50% |
|
Latin America |
Brazil |
50% |
North America Hydrogen Detection Market Insights
North America holds a leading position in the global Hydrogen Detection Market, anchored by the United States' combination of the world's largest refining complex, extensive petrochemical hydrogen infrastructure, growing clean hydrogen economy investments, and a regulatory environment that mandates continuous hydrogen monitoring across facilities above PSM threshold quantities. The U.S. CHIPS Act's semiconductor fab investments are additionally creating new hydrogen detection demand: advanced semiconductor manufacturing uses hydrogen extensively in epitaxial silicon deposition and annealing atmospheres, requiring detection systems in fab environments whose production disruption cost makes false alarm minimization and detection reliability paramount. U.S. domestic hydrogen detector manufacturers including MSA Safety, Honeywell Analytics, and Industrial Scientific (part of MSA) compete with international suppliers for the large and technically demanding industrial detection market.
The U.S. EPA's 2024 Risk Management Program rulemaking expanded the list of facilities required to maintain active process hazard analyses and emergency response programs for hydrogen handling, creating new regulatory compliance demand for hydrogen detection system installation and calibration documentation at previously unregulated facilities.
Get Customized Report as per Your Business Requirement - Enquiry Now
Asia Pacific Hydrogen Detection Market Insights
Asia Pacific is the fastest-growing regional Hydrogen Detection Market with Japan, China, and South Korea collectively driving the most ambitious hydrogen economy infrastructure development programs globally. Japan's hydrogen strategy targeting 3 million fuel cell vehicles and 1,000 hydrogen fueling stations by 2030 requires both vehicle-integrated and infrastructure hydrogen detection systems at unprecedented deployment scales. South Korea's national hydrogen strategy similarly targets 6.2 million fuel cell vehicles by 2040, with the Hyundai NEXO and other FCEVs creating large domestic vehicle detection content demand. China's 14th Five-Year Plan identifies hydrogen energy as a strategic technology priority, with government-subsidized hydrogen vehicle and infrastructure programs creating rapidly growing detection demand across a market with 1.4 billion potential end consumers. Japan hosts several of the world's most technically advanced hydrogen sensor developers, including Figaro Engineering and FIGARO Engineering's MEMS sensor programs that contribute to the region's technological sophistication.
Japan's Ministry of Economy, Trade and Industry's 2023 Strategic Roadmap for Hydrogen and Fuel Ammonia documents government-guaranteed support for over 3,000 hydrogen-related technology development projects, with hydrogen safety detection identified as a priority technology area receiving USD 1.8 billion in research subsidies through 2030. South Korea's Ministry of Trade, Industry and Energy mandates hydrogen detection installation at every public hydrogen fueling station and fleet hydrogen storage facility.
Europe Hydrogen Detection Market Insights
Europe's Hydrogen Detection Market is driven by the EU's REPowerEU hydrogen ambitions targeting 10 million tonnes of domestic green hydrogen production by 2030 and the development of hydrogen pipeline infrastructure across Germany, the Netherlands, Belgium, and France. Germany's National Hydrogen Strategy and associated industrial decarbonization programs where hydrogen is envisioned as the replacement fuel for steel, cement, and chemical manufacturing are creating new industrial hydrogen detection requirements in manufacturing sectors that previously used natural gas or coal. The ATEX and IECEx explosive atmosphere equipment certification requirements that govern hydrogen detection equipment installation in European hazardous areas create a certification framework that sustains established detector suppliers with the necessary compliance documentation while creating barriers for less-established manufacturers.
Middle East & Africa and Latin America Hydrogen Detection Market Insights
The Middle East holds a significant hydrogen detection demand from its existing hydrogen-intensive oil refining and petrochemical industries Saudi Aramco, Abu Dhabi National Oil Company, and Kuwait Petroleum Corporation collectively consume millions of tons of hydrogen annually in their refinery operations, each requiring comprehensive hydrogen detection infrastructure. Saudi Arabia's NEOM green hydrogen project one of the world's largest planned green hydrogen production facilities represents a major new hydrogen detection infrastructure requirement whose commissioned scale will be among the world's largest single-facility detection deployments when operational. Latin America's hydrogen detection market is currently modest, concentrated in refinery operations in Brazil, Mexico, and Venezuela, but growing with Brazil's emerging green hydrogen export ambitions and Mexico's petrochemical sector expansion.
Hydrogen Detection Market Growth Drivers:
Clean hydrogen economy buildout and industrial safety regulations driving extraordinary global hydrogen detection market growth
The hydrogen detection market's growth is being pulled simultaneously from two economically independent directions. The established industrial hydrogen sector oil refining, chemicals, electronics manufacturing requires detection infrastructure maintenance, technology modernization, and expansion as facilities grow and safety standards tighten. Every refinery capacity addition, every new chemical plant, and every regulatory update that expands PSM applicability represents incremental fixed detection demand from an existing industrial base. Simultaneously, the clean hydrogen economy's development is creating new detection demand categories that barely existed five years ago: hydrogen fueling stations, green hydrogen electrolyzers, hydrogen-powered industrial furnaces, hydrogen pipeline networks, and hydrogen storage facilities each require purpose-designed detection systems whose specification requirements and deployment environments are distinct from traditional industrial hydrogen applications. The combination of these two independent demand streams sustains above-market CAGR through the forecast period.
BloombergNEF's 2024 Hydrogen Market Outlook projects that the global number of hydrogens fueling stations will grow from 1,500 in 2024 to over 15,000 by 2030, with each station requiring 8-20 fixed hydrogen detectors plus portable detection equipment creating a new detection infrastructure procurement wave that sustains market growth independent of existing industrial hydrogen demand.
Hydrogen Detection Market Restraints:
High false alarm rates and sensor technology limitations creating operational challenges for hydrogen detection market adoption
The hydrogen detection market faces a persistent false alarm challenge that creates significant operational cost and trust erosion at facilities with installed detection systems. False alarms triggered by sensor drift, temperature and humidity sensitivity, cross-sensitivity to other gases, or power supply fluctuations require evacuation responses that disrupt operations, impose safety investigation costs, and progressively erode operator confidence in detection systems to the point where response procedures are sometimes delayed or bypassed. Catalytic bead sensors are particularly susceptible to catalyst poisoning by halogenated compounds, silicones, and sulfur compounds that permanently reduce their sensitivity requiring regular calibration and periodic replacement that adds ongoing operational cost. For hydrogen fueling stations where false alarms prompt station shutdown and customer disruption the operational consequence of poor detection reliability is commercially damaging enough to influence purchasing decisions toward more expensive but more reliable sensor technologies.
Hydrogen Detection Market Opportunities:
Hydrogen fuel cell vehicle infrastructure and green hydrogen production creating transformative new detection market opportunities globally
The hydrogen fuel cell vehicle infrastructure buildout represents the most commercially transformative near-term opportunity in the hydrogen detection market, because each fueling station represents a standardized, recurring detection equipment procurement that multiplies with station count growth. A typical hydrogen fueling station requires hydrogen detector arrays at the compressor housing, storage bank, dispenser island, and building ventilation points a 10-20 detector installation per station that creates defined per-station equipment revenue at volumes that will scale from thousands to tens of thousands of stations globally through 2030. Vehicle-integrated hydrogen detection where each FCEV contains sensors monitoring the fuel system for leaks that trigger system response creates a high-volume per-unit detection component market where MEMS sensor economics enable at-scale cost targets that serve the automotive supply chain's price sensitivity.
Recent Developments:
-
2026: MSA Safety launched its Galaxy GX2 Automated Test System for hydrogen detectors, enabling fully automated bump testing, calibration verification, and data logging for fixed hydrogen detection infrastructure reporting that hydrogen fueling station operators using GX2 reduced the labor cost of detector maintenance by 65% while achieving complete documentation compliance with state fire marshal hydrogen safety inspection requirements.
-
2025: Honeywell Process Solutions introduced its XNXO Ultima hydrogen detector with dual-sensor validation technology combining electrochemical and catalytic bead detection in a single unit, providing cross-validation that eliminates over 90% of false alarms caused by single-sensor drift targeting hydrogen electrolyzer facilities where false alarm-driven shutdowns impose significant revenue losses per unplanned outage event.
-
2025: Figaro Engineering commenced volume production of its TGS6812 MEMS-based hydrogen sensor targeted at automotive in-vehicle safety applications, achieving a 3.4mm x 3.4mm package with 10-year sensor life rating that meets Toyota and Hyundai's fuel cell vehicle supplier quality standards for vehicle-integrated hydrogen monitoring.
Hydrogen Detection Market Key Players
Some of the Hydrogen Detection Market Companies
-
MSA Safety Inc.
-
Honeywell International Inc. (Analytics)
-
Drägerwerk AG & Co. KGaA
-
Sierra Monitor Corporation
-
Industrial Scientific Corporation (MSA)
-
Crowcon Detection Instruments
-
RKI Instruments Inc.
-
Gas Detection Instruments Ltd.
-
Sensata Technologies Inc.
-
Figaro Engineering Inc.
-
City Technology Ltd. (Honeywell)
-
Det-Tronics (Carrier Global)
-
Nemoto & Co., Ltd.
-
New Cosmos Electric Co., Ltd.
-
H2scan Corporation
-
Interlink Electronics Inc.
-
Hanwei Electronics Group Corp.
-
NEO Monitors AS
-
Senseair AB (Asahi Kasei)
-
Yokogawa Electric Corporation
Hydrogen Detection Market Report Scope:
| Report Attributes | Details |
|---|---|
| Market Size in 2025 | USD 292 Million |
| Market Size by 2035 | USD 930 Million |
| CAGR | CAGR of 16.59% From 2026 to 2035 |
| Base Year | 2025 |
| Forecast Period | 2026-2035 |
| Historical Data | 2022-2024 |
| Report Scope & Coverage | Market Size, Segments Analysis, Competitive Landscape, Regional Analysis, DROC & SWOT Analysis, Forecast Outlook |
| Key Segments | • By Implementation (Fixed, Portable) • By Technology (Electromechanical, Catalytic, MOS, Thermal conductivity, MEMS) • By Detection Range (0 - 1,000 ppm, 0 – 5,000 ppm, 0 – 20,000 ppm, > 0 – 20,000 ppm) • By End Use (Oil & Gas, Automotive, Chemicals, Metal & Mining, Energy & Power, Others) |
| Regional Analysis/Coverage | North America (US, Canada), Europe (Germany, UK, France, Italy, Spain, Russia, Poland, Rest of Europe), Asia Pacific (China, India, Japan, South Korea, Australia, ASEAN Countries, Rest of Asia Pacific), Middle East & Africa (UAE, Saudi Arabia, Qatar, South Africa, Rest of Middle East & Africa), Latin America (Brazil, Argentina, Mexico, Colombia, Rest of Latin America). |
| Company Profiles | MSA Safety Inc., Honeywell International Inc. (Analytics), Drägerwerk AG & Co. KGaA, Sierra Monitor Corporation, Industrial Scientific Corporation (MSA), Crowcon Detection Instruments, RKI Instruments Inc., Gas Detection Instruments Ltd., Sensata Technologies Inc., Figaro Engineering Inc., City Technology Ltd. (Honeywell), Det-Tronics (Carrier Global), Nemoto & Co., Ltd., New Cosmos Electric Co., Ltd., H2scan Corporation, Interlink Electronics Inc., Hanwei Electronics Group Corp., NEO Monitors AS, Senseair AB (Asahi Kasei), Yokogawa Electric Corporation |
Frequently Asked Questions
Automotive is the fastest growing end-use at approximately 13.71% CAGR driven by hydrogen FCEV adoption.
MEMS technology is the fastest growing at approximately 15.29% CAGR in the Hydrogen Detection Market.
Fixed detectors dominated the Hydrogen Detection Market; Portable is the fastest growing at 13.67% CAGR.
The Hydrogen Detection Market was valued at USD 292 million in 2025.
The Hydrogen Detection Market is expected to grow at a CAGR of 11.89% from 2026 to 2035.
Get in Touch
