image

Online Grocery Market Report Scope & Overview:

online Grocery Market Revenue Analysis

Get More Information on Online Grocery Market - Request Sample Report

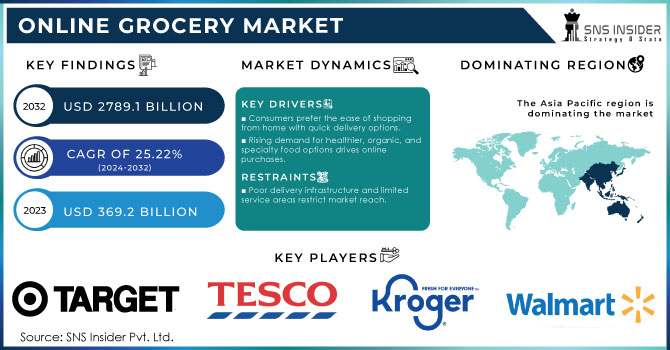
The online Grocery Market was valued at USD 369.2 billion in 2023 and is expected to reach USD 2789.1 billion by 2032, growing at a CAGR of 25.22% from 2024-2032.

The online grocery market has seen rapid growth in recent years, driven by changing consumer habits, technological advancements, and the increasing adoption of digital platforms and the convenience and time-saving benefits of online shopping, which have reshaped the way consumers purchase groceries.

Technological advancements, such as user-friendly mobile apps, AI-driven personalized recommendations, and efficient last-mile delivery solutions, have further enhanced the customer experience and fueled market growth. Major players like Amazon Fresh, Walmart, and Instacart have continued to expand their services, leveraging data analytics and robotics to optimize supply chains and delivery processes. Urbanization and the growing use of smartphones and the internet are also key drivers, particularly in developing regions where online grocery platforms are increasingly becoming accessible to a wider audience. According to the survey, over 50% of U.S. consumers now use online grocery services, up from just 23% in 2019. Additionally, rising disposable incomes, busy lifestyles, and an increasing focus on healthier, organic, and specialty food options are driving more consumers to explore online grocery shopping.
Market Dynamics

Drivers

  • Consumers prefer the ease of shopping from home with quick delivery options.

  • Rising demand for healthier, organic, and specialty food options drives online purchases.

  • Online grocery platforms often offer competitive prices and promotions that attract budget-conscious consumers.

Online grocery platforms often attract budget-conscious consumers by offering competitive prices, promotions, and discounts that are hard to find in traditional brick-and-mortar stores. These platforms leverage data analytics to personalize promotions, making them more relevant to individual shoppers. For instance, Amazon Fresh and Walmart+ frequently offer exclusive deals, free delivery, and subscription discounts, which help retain cost-sensitive customers. A survey by McKinsey in 2023 found that nearly 61% of online grocery shoppers cite lower prices and special promotions as a key reason for choosing online platforms over traditional stores.

Additionally, these platforms frequently run loyalty programs and cashback offers, which incentivize repeated purchases and build long-term customer loyalty. For example, Instacart’s Express membership offers reduced service fees and free delivery on orders over a certain amount, making it a popular choice among regular users. Flash sales, bulk buying discounts, and personalized coupons further enhance the appeal. According to research, 45% of U.S. consumers used online grocery services specifically to take advantage of such deals in 2023. The convenience of comparing prices across multiple platforms also empowers consumers to make cost-effective decisions, further driving the popularity of online grocery shopping among budget-focused individuals. These strategies not only boost sales volumes but also help platforms differentiate themselves in an increasingly competitive market.

The rising demand for healthier, organic, and specialty food options is a significant driver of online grocery purchases, as consumers increasingly prioritize health and wellness in their food choices. Online grocery platforms offer a wider selection of organic, gluten-free, vegan, and other specialty products that are often difficult to find in local stores. Platforms like Whole Foods (via Amazon) and Thrive Market specialize in catering to health-conscious consumers by offering curated selections of organic and non-GMO products. The convenience of detailed product information, customer reviews, and easy access to niche brands further boosts online sales. 41% of U.S. online grocery shoppers in 2023 chose e-commerce platforms for their ability to meet specific dietary needs, underscoring the growing influence of health trends on purchasing behavior.

Restraints

  • Poor delivery infrastructure and limited service areas restrict market reach.

  • Slow or unreliable internet connections can hinder the shopping experience.

  • Concerns over product quality and accuracy of orders can affect customer satisfaction.

  • Maintaining the freshness of perishable items during delivery remains a significant challenge.

Maintaining the freshness of perishable items during delivery is a major challenge for the online grocery market, as it directly impacts customer satisfaction and repeat business. Products like fruits, vegetables, dairy, and meat require specialized storage and quick, temperature-controlled delivery to ensure they arrive in good condition. According to a 2023 survey, 37% of online grocery shoppers reported concerns about the quality and freshness of perishable goods upon delivery. The logistics involved, including cold chain management and timely delivery, add significant operational costs and complexity for providers. Failure to maintain proper conditions can lead to spoiled items, increased returns, and customer dissatisfaction. Companies like Amazon Fresh and Instacart are investing in refrigerated vehicles and advanced packaging solutions, but these measures are costly and difficult to scale, especially in less urban areas. The challenge of preserving freshness remains a key barrier to the broader adoption of online grocery shopping, particularly for fresh and highly perishable items.

Concerns over product quality and order accuracy significantly impact customer satisfaction in the online grocery market. Shoppers often worry about receiving damaged goods, expired items, or incorrect products, which can erode trust in online services. These concerns are particularly prominent for fresh produce, where customers prefer to select items themselves to ensure quality. The inability to physically inspect products before purchase leads to uncertainty, and when items don’t meet expectations, it often results in complaints, refunds, or negative reviews. Retailers like Walmart and Instacart are striving to address these issues through improved quality checks, better packaging, and more accurate order-picking processes, but challenges remain. High standards for product quality and order accuracy are essential for maintaining customer loyalty and market growth.

Segment Analysis

By Product

In 2023, The staples & cooking essentials segment dominated the market and accounted for the largest revenue share of around 31.0% driven by the repetitive purchase of staples like flour, food grains, and cooking essentials, such as oil, which are household necessities, particularly in the Asia Pacific region.

The breakfast and dairy segment is expected to see significant growth during the forecast period, fueled by increased demand for both milk and non-dairy products, along with the convenience of doorstep delivery provided by vendors. Additionally, busy lifestyles and higher disposable incomes are encouraging consumers to purchase these items online rather than visiting physical stores.

By Delivery

In 2023, the Scheduled Delivery segment led the market, accounting for over 59% of the market share. It is projected to maintain its leading position throughout the forecast period, as consumers increasingly choose scheduled deliveries that fit their preferred time slots, catering to busy lifestyles and minimizing waiting times.

However, the instant delivery segment is anticipated to manifest the highest CAGR during the forecast period. Market trends in instant delivery for the online grocery sector show an increasing preference for fast, on-demand grocery services.

By Platform

In 2023, the App segment dominated the market and accounted for more than 60.0% of the market share. This segment has grown significantly due to the convenience and speed it provides, especially for repeat buyers and frequent users. Grocery shopping apps enhance the user experience with personalized features such as push notifications for deals, tailored recommendations, and quick reordering of favorite items. These app-based platforms are especially attractive to tech-savvy, younger consumers who appreciate the ease of shopping on the go. Additionally, apps leverage smartphone capabilities like location services to streamline delivery efficiency.

Web-based platforms are expected to experience the highest CAGR during the forecast period. This platform is especially favored by users who prefer a larger screen for browsing and comparing products, or who may not want to download and install extra apps on their devices. Web-based grocery platforms offer a broad view of products, detailed descriptions, and straightforward navigation. They are also advantageous for users who want to research or compare prices across various sites.

By Purchase

The Subscription model segment held the largest market share of around 58% in 2023. This segment is becoming increasingly popular in the online grocery market, especially for staple items and frequently used products. In this model, customers subscribe to receive specific products at set intervals, such as weekly or monthly. This approach is convenient for those who want to automate the replenishment of essentials, saving time and effort on repeated orders. It is particularly suited for items with predictable usage, like dairy products, baby care items, or specialty coffee. Subscription models often provide advantages such as discounted prices, free delivery, or exclusive access to certain products.

The one-time purchase segment is projected to grow during the forecast period. This segment represents a more traditional approach in the online grocery market. It involves customers making individual purchases as needed, without any commitment to future orders. This segment caters to consumers who prefer shopping based on immediate needs or specific occasions, offering flexibility and a range of choices.

Regional Analysis

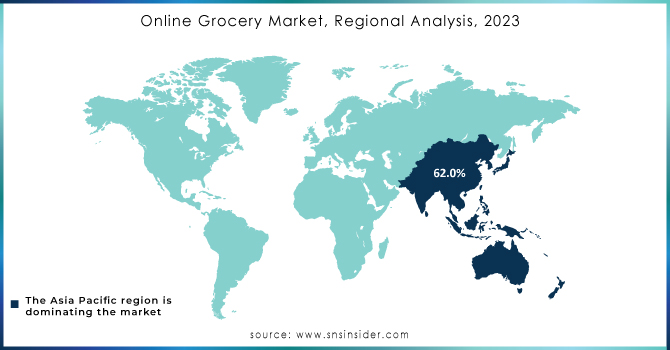
Asia Pacific led the online grocery market in 2023 and held the largest revenue share at 62.0%. This regional growth is largely driven by government initiatives in countries like India and China that support e-commerce and digitalization. The growing demand for the industry is fueled by factors such as a rising population, higher disposable incomes, and a sophisticated, food-conscious consumer base across the region. Additionally, greater mobile accessibility and broadband adoption are disrupting traditional grocery shopping models, enabling customers to purchase food anytime and from anywhere. Social trends, including road congestion and longer working hours, have also contributed to the increasing popularity of online grocery shopping in Asia Pacific.

North America is projected to see significant growth during the forecast period. The region is home to key players like Walmart, Instacart, Amazon.com, Inc., Target, and Kroger Co., with the U.S. specifically experiencing steady growth in e-commerce sales.
Online-Grocery-Market-Regional-Analysis-2023

Need any customization research on Online Grocery Market - Enquiry Now

Key Players

The major key players include Target Brands, Inc., Tesco.com, The Kroger Co., Walmart, Alibaba.com, Amazon.com, Inc., Instacart, JD.com, Supermarket Grocery Supplies Pvt. Ltd., AEON CO., LTD., Inc., and several others.

Recent Developments

  • In July 2023, Woolworths Group Limited launched the MILKRUN app in New Zealand. This app enables consumers to place orders within minutes and provides an ultra-convenient shopping experience.

  • In February 2023, Kroger Co. opened a new facility in South Florida, U.S., to enhance its delivery services.

  • In March 2022, Instacart launched "The Instacart Platform," a suite of enterprise-grade technologies designed to revolutionize the grocery industry. With this innovative offering, Instacart aims to empower retailers and enhance the consumer experience, catering to various shopping preferences.

Online Grocery Market Report Scope:

Report Attributes

Details

Market Size in 2023

USD 369.2 Billion

Market Size by 2032

USD 2789.1 Billion

CAGR

CAGR 25.22 % From 2024 to 2032

Base Year

2023

Forecast Period

2024-2032

Historical Data

2020-2022

Report Scope & Coverage

Market Size, Segments Analysis, Competitive  Landscape, Regional Analysis, DROC & SWOT Analysis, Forecast Outlook

Key Segments

• By Platform (Web-Based, App-Based)
• By Product (Fresh produce, Breakfast & dairy, Snacks & beverages, Meat & seafood, Staples & cooking essentials and Others)
• By Delivery (Instant Delivery, Schedule Delivery)
• By Purchase (One-Time, Subscription)

Regional Analysis/Coverage

North America (US, Canada, Mexico), Europe (Eastern Europe [Poland, Romania, Hungary, Turkey, Rest of Eastern Europe] Western Europe] Germany, France, UK, Italy, Spain, Netherlands, Switzerland, Austria, Rest of Western Europe]), Asia Pacific (China, India, Japan, South Korea, Vietnam, Singapore, Australia, Rest of Asia Pacific), Middle East & Africa (Middle East [UAE, Egypt, Saudi Arabia, Qatar, Rest of Middle East], Africa [Nigeria, South Africa, Rest of Africa], Latin America (Brazil, Argentina, Colombia Rest of Latin America)

Company Profiles

The major key players include Target Brands, Inc., Tesco.com, The Kroger Co., Walmart, Alibaba.com, Amazon.com, Inc., Instacart, JD.com, Supermarket Grocery Supplies Pvt. Ltd., AEON CO., LTD., Inc., and several others.

Key Drivers

• Consumers prefer the ease of shopping from home with quick delivery options.
• Rising demand for healthier, organic, and specialty food options drives online purchases.

Market Restraints

• Poor delivery infrastructure and limited service areas restrict market reach.
• Slow or unreliable internet connections can hinder the shopping experience.
• Concerns over product quality and accuracy of orders can affect customer satisfaction.

Frequently Asked Questions

Ans - the CAGR for the Online Grocery market during the forecast period is 25.22%.

Ans- Online Grocery Market was worth USD 369.2 billion in 2023 and is predicted to be worth USD 2789.1 billion by 2032, growing at a CAGR of 25.22% between 2024 and 2032.

Ans: - The forecast period of the Online Grocery market is 2024-2032.

Ans: - Unexercised online capabilities and recalls of products.

Ans: - The primary growth tactics of Online Grocery market participants include merger and acquisition, business expansion, and product launch.

Table of Contents

1. Introduction

1.1 Market Definition

1.2 Scope (Inclusion and Exclusions)

1.3 Research Assumptions

2. Executive Summary

2.1 Market Overview

2.2 Regional Synopsis

2.3 Competitive Summary

3. Research Methodology

3.1 Top-Down Approach

3.2 Bottom-up Approach

3.3. Data Validation

3.4 Primary Interviews

4. Market Dynamics Impact Analysis

4.1 Market Driving Factors Analysis

4.1.1 Drivers

4.1.2 Restraints

4.1.3 Opportunities

4.1.4 Challenges

4.2 PESTLE Analysis

4.3 Porter’s Five Forces Model

5. Statistical Insights and Trends Reporting

  1. 5.1 Feature Analysis, 2023
  2. 5.2 User Demographics, 2023
  3. 5.3 Integration Capabilities, by Software, 2023
  4. 5.4 Impact on Decision-making

6. Competitive Landscape

6.1 List of Major Companies, By Region

6.2 Market Share Analysis, By Region

6.3 Product Benchmarking

6.3.1 Product specifications and features

6.3.2 Pricing

6.4 Strategic Initiatives

6.4.1 Marketing and promotional activities

6.4.2 Distribution and supply chain strategies

6.4.3 Expansion plans and new product launches

6.4.4 Strategic partnerships and collaborations

6.5 Technological Advancements

6.6 Market Positioning and Branding

7. Online Grocery Market Segmentation, by Platform

7.1 Chapter Overview

7.2 Web Based

7.2.1 Web Based Market Trends Analysis (2020-2032)

7.2.2 Web Based Market Size Estimates and Forecasts to 2032 (USD Billion)

7.3App Based

7.3.1App Based Market Trends Analysis (2020-2032)

7.3.2App Based Market Size Estimates and Forecasts to 2032 (USD Billion)

8. Online Grocery Market Segmentation, by Product

8.1 Chapter Overview

8.2 Fresh produce

8.2.1 Fresh produce Market Trends Analysis (2020-2032)

8.2.2 Fresh produce Market Size Estimates and Forecasts to 2032 (USD Billion)

8.3Breakfast & Dairy

8.3.1 Breakfast & Dairy Market Trends Analysis (2020-2032)

8.3.2 Breakfast & Dairy Market Size Estimates and Forecasts to 2032 (USD Billion)

8.4 Snacks & beverages

8.4.1 Snacks & beverages Market Trends Analysis (2020-2032)

8.4.2 Snacks & beverages Market Size Estimates and Forecasts to 2032 (USD Billion)

8.5 Meat & seafood

8.5.1 Meat & seafood Market Trends Analysis (2020-2032)

8.5.2 Meat & seafood Market Size Estimates and Forecasts to 2032 (USD Billion)

8.6 Staples & cooking essentials

8.6.1 Staples & cooking essentials Market Trends Analysis (2020-2032)

8.6.2 Staples & cooking essentials Market Size Estimates and Forecasts to 2032 (USD Billion)

8.7 Others

8.7.1 Others Market Trends Analysis (2020-2032)

8.7.2 Others Market Size Estimates and Forecasts to 2032 (USD Billion)

9. Online Grocery Market Segmentation, by Delivery Type

9.1 Chapter Overview

9.2 Instant Delivery

9.2.1 Instant Delivery Market Trends Analysis (2020-2032)

9.2.2 Instant Delivery Market Size Estimates and Forecasts to 2032 (USD Billion)

9.3 Schedule Delivery

9.3.1 Schedule Delivery Market Trends Analysis (2020-2032)

9.3.2 Schedule Delivery Market Size Estimates and Forecasts to 2032 (USD Billion)

10. Online Grocery Market Segmentation, by Purchase Type

10.1 Chapter Overview

10.2 One-Time

10.2.1 One-Time Market Trends Analysis (2020-2032)

10.2.2 One-Time Market Size Estimates and Forecasts to 2032 (USD Billion)

10.3 Subscription

10.3.1 Subscription Market Trends Analysis (2020-2032)

10.3.2 Subscription Market Size Estimates and Forecasts to 2032 (USD Billion)

11. Regional Analysis

11.1 Chapter Overview

11.2 North America

11.2.1 Trends Analysis

11.2.2 North America Online Grocery Market Estimates and Forecasts, by Country (2020-2032) (USD Billion)

11.2.3 North America Online Grocery Market Estimates and Forecasts, byPlatform (2020-2032) (USD Billion) 

11.2.4 North America Online Grocery Market Estimates and Forecasts, by Product (2020-2032) (USD Billion)

11.2.5 North America Online Grocery Market Estimates and Forecasts, by Delivery Type (2020-2032) (USD Billion)

11.2.6 North America Online Grocery Market Estimates and Forecasts, by Purchase Type (2020-2032) (USD Billion)

11.2.7 USA

11.2.7.1 USA Online Grocery Market Estimates and Forecasts, byPlatform (2020-2032) (USD Billion)

11.2.7.2 USA Online Grocery Market Estimates and Forecasts, by Product (2020-2032) (USD Billion)

11.2.7.3 USA Online Grocery Market Estimates and Forecasts, by Delivery Type (2020-2032) (USD Billion)

11.2.7.4 USA Online Grocery Market Estimates and Forecasts, by Purchase Type (2020-2032) (USD Billion)

11.2.8 Canada

11.2.8.1 Canada Online Grocery Market Estimates and Forecasts, byPlatform (2020-2032) (USD Billion)

11.2.8.2 Canada Online Grocery Market Estimates and Forecasts, by Product (2020-2032) (USD Billion)

11.2.8.3 Canada Online Grocery Market Estimates and Forecasts, by Delivery Type (2020-2032) (USD Billion)

11.2.8.4 Canada Online Grocery Market Estimates and Forecasts, by Purchase Type (2020-2032) (USD Billion)

11.2.9 Mexico

11.2.9.1 Mexico Online Grocery Market Estimates and Forecasts, byPlatform (2020-2032) (USD Billion)

11.2.9.2 Mexico Online Grocery Market Estimates and Forecasts, by Product (2020-2032) (USD Billion)

11.2.9.3 Mexico Online Grocery Market Estimates and Forecasts, by Delivery Type (2020-2032) (USD Billion)

11.2.9.4 Mexico Online Grocery Market Estimates and Forecasts, by Purchase Type (2020-2032) (USD Billion)

11.3 Europe

11.3.1 Eastern Europe

11.3.1.1 Trends Analysis

11.3.1.2 Eastern Europe Online Grocery Market Estimates and Forecasts, by Country (2020-2032) (USD Billion)

11.3.1.3 Eastern Europe Online Grocery Market Estimates and Forecasts, byPlatform (2020-2032) (USD Billion) 

11.3.1.4 Eastern Europe Online Grocery Market Estimates and Forecasts, by Product (2020-2032) (USD Billion)

11.3.1.5 Eastern Europe Online Grocery Market Estimates and Forecasts, by Delivery Type (2020-2032) (USD Billion)

11.3.1.6 Eastern Europe Online Grocery Market Estimates and Forecasts, by Purchase Type (2020-2032) (USD Billion)

11.3.1.7 Poland

11.3.1.7.1 Poland Online Grocery Market Estimates and Forecasts, byPlatform (2020-2032) (USD Billion)

11.3.1.7.2 Poland Online Grocery Market Estimates and Forecasts, by Product (2020-2032) (USD Billion)

11.3.1.7.3 Poland Online Grocery Market Estimates and Forecasts, by Delivery Type (2020-2032) (USD Billion)

11.3.1.7.4 Poland Online Grocery Market Estimates and Forecasts, by Purchase Type (2020-2032) (USD Billion)

11.3.1.8 Romania

11.3.1.8.1 Romania Online Grocery Market Estimates and Forecasts, byPlatform (2020-2032) (USD Billion)

11.3.1.8.2 Romania Online Grocery Market Estimates and Forecasts, by Product (2020-2032) (USD Billion)

11.3.1.8.3 Romania Online Grocery Market Estimates and Forecasts, by Delivery Type (2020-2032) (USD Billion)

11.3.1.8.4 Romania Online Grocery Market Estimates and Forecasts, by Purchase Type (2020-2032) (USD Billion)

11.3.1.9 Hungary

11.3.1.9.1 Hungary Online Grocery Market Estimates and Forecasts, byPlatform (2020-2032) (USD Billion)

11.3.1.9.2 Hungary Online Grocery Market Estimates and Forecasts, by Product (2020-2032) (USD Billion)

11.3.1.9.3 Hungary Online Grocery Market Estimates and Forecasts, by Delivery Type (2020-2032) (USD Billion)

11.3.1.9.4 Hungary Online Grocery Market Estimates and Forecasts, by Purchase Type (2020-2032) (USD Billion)

11.3.1.10 Turkey

11.3.1.10.1 Turkey Online Grocery Market Estimates and Forecasts, byPlatform (2020-2032) (USD Billion)

11.3.1.10.2 Turkey Online Grocery Market Estimates and Forecasts, by Product (2020-2032) (USD Billion)

11.3.1.10.3 Turkey Online Grocery Market Estimates and Forecasts, by Delivery Type (2020-2032) (USD Billion)

11.3.1.10.4 Turkey Online Grocery Market Estimates and Forecasts, by Purchase Type (2020-2032) (USD Billion)

11.3.1.11 Rest of Eastern Europe

11.3.1.11.1 Rest of Eastern Europe Online Grocery Market Estimates and Forecasts, byPlatform (2020-2032) (USD Billion)

11.3.1.11.2 Rest of Eastern Europe Online Grocery Market Estimates and Forecasts, by Product (2020-2032) (USD Billion)

11.3.1.11.3 Rest of Eastern Europe Online Grocery Market Estimates and Forecasts, by Delivery Type (2020-2032) (USD Billion)

11.3.1.11.4 Rest of Eastern Europe Online Grocery Market Estimates and Forecasts, by Purchase Type (2020-2032) (USD Billion)

11.3.2 Western Europe

11.3.2.1 Trends Analysis

11.3.2.2 Western Europe Online Grocery Market Estimates and Forecasts, by Country (2020-2032) (USD Billion)

11.3.2.3 Western Europe Online Grocery Market Estimates and Forecasts, byPlatform (2020-2032) (USD Billion) 

11.3.2.4 Western Europe Online Grocery Market Estimates and Forecasts, by Product (2020-2032) (USD Billion)

11.3.2.5 Western Europe Online Grocery Market Estimates and Forecasts, by Delivery Type (2020-2032) (USD Billion)

11.3.2.6 Western Europe Online Grocery Market Estimates and Forecasts, by Purchase Type (2020-2032) (USD Billion)

11.3.2.7 Germany

11.3.2.7.1 Germany Online Grocery Market Estimates and Forecasts, byPlatform (2020-2032) (USD Billion)

11.3.2.7.2 Germany Online Grocery Market Estimates and Forecasts, by Product (2020-2032) (USD Billion)

11.3.2.7.3 Germany Online Grocery Market Estimates and Forecasts, by Delivery Type (2020-2032) (USD Billion)

11.3.2.7.4 Germany Online Grocery Market Estimates and Forecasts, by Purchase Type (2020-2032) (USD Billion)

11.3.2.8 France

11.3.2.8.1 France Online Grocery Market Estimates and Forecasts, byPlatform (2020-2032) (USD Billion)

11.3.2.8.2 France Online Grocery Market Estimates and Forecasts, by Product (2020-2032) (USD Billion)

11.3.2.8.3 France Online Grocery Market Estimates and Forecasts, by Delivery Type (2020-2032) (USD Billion)

11.3.2.8.4 France Online Grocery Market Estimates and Forecasts, by Purchase Type (2020-2032) (USD Billion)

11.3.2.9 UK

11.3.2.9.1 UK Online Grocery Market Estimates and Forecasts, byPlatform (2020-2032) (USD Billion)

11.3.2.9.2 UK Online Grocery Market Estimates and Forecasts, by Product (2020-2032) (USD Billion)

11.3.2.9.3 UK Online Grocery Market Estimates and Forecasts, by Delivery Type (2020-2032) (USD Billion)

11.3.2.9.4 UK Online Grocery Market Estimates and Forecasts, by Purchase Type (2020-2032) (USD Billion)

11.3.2.10 Italy

11.3.2.10.1 Italy Online Grocery Market Estimates and Forecasts, byPlatform (2020-2032) (USD Billion)

11.3.2.10.2 Italy Online Grocery Market Estimates and Forecasts, by Product (2020-2032) (USD Billion)

11.3.2.10.3 Italy Online Grocery Market Estimates and Forecasts, by Delivery Type (2020-2032) (USD Billion)

11.3.2.10.4 Italy Online Grocery Market Estimates and Forecasts, by Purchase Type (2020-2032) (USD Billion)

11.3.2.11 Spain

11.3.2.11.1 Spain Online Grocery Market Estimates and Forecasts, byPlatform (2020-2032) (USD Billion)

11.3.2.11.2 Spain Online Grocery Market Estimates and Forecasts, by Product (2020-2032) (USD Billion)

11.3.2.11.3 Spain Online Grocery Market Estimates and Forecasts, by Delivery Type (2020-2032) (USD Billion)

11.3.2.11.4 Spain Online Grocery Market Estimates and Forecasts, by Purchase Type (2020-2032) (USD Billion)

11.3.2.12 Netherlands

11.3.2.12.1 Netherlands Online Grocery Market Estimates and Forecasts, byPlatform (2020-2032) (USD Billion)

11.3.2.12.2 Netherlands Online Grocery Market Estimates and Forecasts, by Product (2020-2032) (USD Billion)

11.3.2.12.3 Netherlands Online Grocery Market Estimates and Forecasts, by Delivery Type (2020-2032) (USD Billion)

11.3.2.12.4 Netherlands Online Grocery Market Estimates and Forecasts, by Purchase Type (2020-2032) (USD Billion)

11.3.2.13 Switzerland

11.3.2.13.1 Switzerland Online Grocery Market Estimates and Forecasts, byPlatform (2020-2032) (USD Billion)

11.3.2.13.2 Switzerland Online Grocery Market Estimates and Forecasts, by Product (2020-2032) (USD Billion)

11.3.2.13.3 Switzerland Online Grocery Market Estimates and Forecasts, by Delivery Type (2020-2032) (USD Billion)

11.3.2.13.4 Switzerland Online Grocery Market Estimates and Forecasts, by Purchase Type (2020-2032) (USD Billion)

11.3.2.14 Austria

11.3.2.14.1 Austria Online Grocery Market Estimates and Forecasts, byPlatform (2020-2032) (USD Billion)

11.3.2.14.2 Austria Online Grocery Market Estimates and Forecasts, by Product (2020-2032) (USD Billion)

11.3.2.14.3 Austria Online Grocery Market Estimates and Forecasts, by Delivery Type (2020-2032) (USD Billion)

11.3.2.14.4 Austria Online Grocery Market Estimates and Forecasts, by Purchase Type (2020-2032) (USD Billion)

11.3.2.15 Rest of Western Europe

11.3.2.15.1 Rest of Western Europe Online Grocery Market Estimates and Forecasts, byPlatform (2020-2032) (USD Billion)

11.3.2.15.2 Rest of Western Europe Online Grocery Market Estimates and Forecasts, by Product (2020-2032) (USD Billion)

11.3.2.15.3 Rest of Western Europe Online Grocery Market Estimates and Forecasts, by Delivery Type (2020-2032) (USD Billion)

11.3.2.15.4 Rest of Western Europe Online Grocery Market Estimates and Forecasts, by Purchase Type (2020-2032) (USD Billion)

11.4 Asia Pacific

11.4.1 Trends Analysis

11.4.2 Asia Pacific Online Grocery Market Estimates and Forecasts, by Country (2020-2032) (USD Billion)

11.4.3 Asia Pacific Online Grocery Market Estimates and Forecasts, byPlatform (2020-2032) (USD Billion) 

11.4.4 Asia Pacific Online Grocery Market Estimates and Forecasts, by Product (2020-2032) (USD Billion)

11.4.5 Asia Pacific Online Grocery Market Estimates and Forecasts, by Delivery Type (2020-2032) (USD Billion)

11.4.6 Asia Pacific Online Grocery Market Estimates and Forecasts, by Purchase Type (2020-2032) (USD Billion)

11.4.7 China

11.4.7.1 China Online Grocery Market Estimates and Forecasts, byPlatform (2020-2032) (USD Billion)

11.4.7.2 China Online Grocery Market Estimates and Forecasts, by Product (2020-2032) (USD Billion)

11.4.7.3 China Online Grocery Market Estimates and Forecasts, by Delivery Type (2020-2032) (USD Billion)

11.4.7.4 China Online Grocery Market Estimates and Forecasts, by Purchase Type (2020-2032) (USD Billion)

11.4.8 India

11.4.8.1 India Online Grocery Market Estimates and Forecasts, byPlatform (2020-2032) (USD Billion)

11.4.8.2 India Online Grocery Market Estimates and Forecasts, by Product (2020-2032) (USD Billion)

11.4.8.3 India Online Grocery Market Estimates and Forecasts, by Delivery Type (2020-2032) (USD Billion)

11.4.8.4 India Online Grocery Market Estimates and Forecasts, by Purchase Type (2020-2032) (USD Billion)

11.4.9 Japan

11.4.9.1 Japan Online Grocery Market Estimates and Forecasts, byPlatform (2020-2032) (USD Billion)

11.4.9.2 Japan Online Grocery Market Estimates and Forecasts, by Product (2020-2032) (USD Billion)

11.4.9.3 Japan Online Grocery Market Estimates and Forecasts, by Delivery Type (2020-2032) (USD Billion)

11.4.9.4 Japan Online Grocery Market Estimates and Forecasts, by Purchase Type (2020-2032) (USD Billion)

11.4.10 South Korea

11.4.10.1 South Korea Online Grocery Market Estimates and Forecasts, byPlatform (2020-2032) (USD Billion)

11.4.10.2 South Korea Online Grocery Market Estimates and Forecasts, by Product (2020-2032) (USD Billion)

11.4.10.3 South Korea Online Grocery Market Estimates and Forecasts, by Delivery Type (2020-2032) (USD Billion)

11.4.10.4 South Korea Online Grocery Market Estimates and Forecasts, by Purchase Type (2020-2032) (USD Billion)

11.4.11 Vietnam

11.4.11.1 Vietnam Online Grocery Market Estimates and Forecasts, byPlatform (2020-2032) (USD Billion)

11.4.11.2 Vietnam Online Grocery Market Estimates and Forecasts, by Product (2020-2032) (USD Billion)

11.4.11.3 Vietnam Online Grocery Market Estimates and Forecasts, by Delivery Type (2020-2032) (USD Billion)

11.4.11.4 Vietnam Online Grocery Market Estimates and Forecasts, by Purchase Type (2020-2032) (USD Billion)

11.4.12 Singapore

11.4.12.1 Singapore Online Grocery Market Estimates and Forecasts, byPlatform (2020-2032) (USD Billion)

11.4.12.2 Singapore Online Grocery Market Estimates and Forecasts, by Product (2020-2032) (USD Billion)

11.4.12.3 Singapore Online Grocery Market Estimates and Forecasts, by Delivery Type (2020-2032) (USD Billion)

11.4.12.4 Singapore Online Grocery Market Estimates and Forecasts, by Purchase Type (2020-2032) (USD Billion)

11.4.13 Australia

11.4.13.1 Australia Online Grocery Market Estimates and Forecasts, byPlatform (2020-2032) (USD Billion)

11.4.13.2 Australia Online Grocery Market Estimates and Forecasts, by Product (2020-2032) (USD Billion)

11.4.13.3 Australia Online Grocery Market Estimates and Forecasts, by Delivery Type (2020-2032) (USD Billion)

11.4.13.4 Australia Online Grocery Market Estimates and Forecasts, by Purchase Type (2020-2032) (USD Billion)

11.4.14 Rest of Asia Pacific

11.4.14.1 Rest of Asia Pacific Online Grocery Market Estimates and Forecasts, byPlatform (2020-2032) (USD Billion)

11.4.14.2 Rest of Asia Pacific Online Grocery Market Estimates and Forecasts, by Product (2020-2032) (USD Billion)

11.4.14.3 Rest of Asia Pacific Online Grocery Market Estimates and Forecasts, by Delivery Type (2020-2032) (USD Billion)

11.4.14.4 Rest of Asia Pacific Online Grocery Market Estimates and Forecasts, by Purchase Type (2020-2032) (USD Billion)

11.5 Middle East and Africa

11.5.1 Middle East

11.5.1.1 Trends Analysis

11.5.1.2 Middle East Online Grocery Market Estimates and Forecasts, by Country (2020-2032) (USD Billion)

11.5.1.3 Middle East Online Grocery Market Estimates and Forecasts, byPlatform (2020-2032) (USD Billion) 

11.5.1.4 Middle East Online Grocery Market Estimates and Forecasts, by Product (2020-2032) (USD Billion)

11.5.1.5 Middle East Online Grocery Market Estimates and Forecasts, by Delivery Type (2020-2032) (USD Billion)

11.5.1.6 Middle East Online Grocery Market Estimates and Forecasts, by Purchase Type (2020-2032) (USD Billion)

11.5.1.7 UAE

11.5.1.7.1 UAE Online Grocery Market Estimates and Forecasts, byPlatform (2020-2032) (USD Billion)

11.5.1.7.2 UAE Online Grocery Market Estimates and Forecasts, by Product (2020-2032) (USD Billion)

11.5.1.7.3 UAE Online Grocery Market Estimates and Forecasts, by Delivery Type (2020-2032) (USD Billion)

11.5.1.7.4 UAE Online Grocery Market Estimates and Forecasts, by Purchase Type  (2020-2032) (USD Billion)

11.5.1.8 Egypt

11.5.1.8.1 Egypt Online Grocery Market Estimates and Forecasts, byPlatform (2020-2032) (USD Billion)

11.5.1.8.2 Egypt Online Grocery Market Estimates and Forecasts, by Product (2020-2032) (USD Billion)

11.5.1.8.3 Egypt Online Grocery Market Estimates and Forecasts, by Delivery Type (2020-2032) (USD Billion)

11.5.1.8.4 Egypt Online Grocery Market Estimates and Forecasts, by Purchase Type (2020-2032) (USD Billion)

11.5.1.9 Saudi Arabia

11.5.1.9.1 Saudi Arabia Online Grocery Market Estimates and Forecasts, byPlatform (2020-2032) (USD Billion)

11.5.1.9.2 Saudi Arabia Online Grocery Market Estimates and Forecasts, by Product (2020-2032) (USD Billion)

11.5.1.9.3 Saudi Arabia Online Grocery Market Estimates and Forecasts, by Delivery Type (2020-2032) (USD Billion)

11.5.1.9.4 Saudi Arabia Online Grocery Market Estimates and Forecasts, by Purchase Type (2020-2032) (USD Billion)

11.5.1.10 Qatar

11.5.1.10.1 Qatar Online Grocery Market Estimates and Forecasts, byPlatform (2020-2032) (USD Billion)

11.5.1.10.2 Qatar Online Grocery Market Estimates and Forecasts, by Product (2020-2032) (USD Billion)

11.5.1.10.3 Qatar Online Grocery Market Estimates and Forecasts, by Delivery Type (2020-2032) (USD Billion)

11.5.1.10.4 Qatar Online Grocery Market Estimates and Forecasts, by Purchase Type (2020-2032) (USD Billion)

11.5.1.11 Rest of Middle East

11.5.1.11.1 Rest of Middle East Online Grocery Market Estimates and Forecasts, byPlatform (2020-2032) (USD Billion)

11.5.1.11.2 Rest of Middle East Online Grocery Market Estimates and Forecasts, by Product (2020-2032) (USD Billion)

11.5.1.11.3 Rest of Middle East Online Grocery Market Estimates and Forecasts, by Delivery Type (2020-2032) (USD Billion)

11.5.1.11.4 Rest of Middle East Online Grocery Market Estimates and Forecasts, by Purchase Type (2020-2032) (USD Billion)

11.5.2 Africa

11.5.2.1 Trends Analysis

11.5.2.2 Africa Online Grocery Market Estimates and Forecasts, by Country (2020-2032) (USD Billion)

11.5.2.3 Africa Online Grocery Market Estimates and Forecasts, byPlatform (2020-2032) (USD Billion) 

11.5.2.4 Africa Online Grocery Market Estimates and Forecasts, by Product (2020-2032) (USD Billion)

11.5.2.5 Africa Online Grocery Market Estimates and Forecasts, by Delivery Type (2020-2032) (USD Billion)

11.5.2.6 Africa Online Grocery Market Estimates and Forecasts, by Purchase Type (2020-2032) (USD Billion)

11.5.2.7 South Africa

11.5.2.7.1 South Africa Online Grocery Market Estimates and Forecasts, byPlatform (2020-2032) (USD Billion)

11.5.2.7.2 South Africa Online Grocery Market Estimates and Forecasts, by Product (2020-2032) (USD Billion)

11.5.2.7.3 South Africa Online Grocery Market Estimates and Forecasts, by Delivery Type (2020-2032) (USD Billion)

11.5.2.7.4 South Africa Online Grocery Market Estimates and Forecasts, by Purchase Type (2020-2032) (USD Billion)

11.5.2.8 Nigeria

11.5.2.8.1 Nigeria Online Grocery Market Estimates and Forecasts, byPlatform (2020-2032) (USD Billion)

11.5.2.8.2 Nigeria Online Grocery Market Estimates and Forecasts, by Product (2020-2032) (USD Billion)

11.5.2.8.3 Nigeria Online Grocery Market Estimates and Forecasts, by Delivery Type (2020-2032) (USD Billion)

11.5.2.8.4 Nigeria Online Grocery Market Estimates and Forecasts, by Purchase Type (2020-2032) (USD Billion)

11.5.2.9 Rest of Africa

11.5.2.9.1 Rest of Africa Online Grocery Market Estimates and Forecasts, byPlatform (2020-2032) (USD Billion)

11.5.2.9.2 Rest of Africa Online Grocery Market Estimates and Forecasts, by Product (2020-2032) (USD Billion)

11.5.2.9.3 Rest of Africa Online Grocery Market Estimates and Forecasts, by Delivery Type (2020-2032) (USD Billion)

11.5.2.9.4 Rest of Africa Online Grocery Market Estimates and Forecasts, by Purchase Type (2020-2032) (USD Billion)

11.6 Latin America

11.6.1 Trends Analysis

11.6.2 Latin America Online Grocery Market Estimates and Forecasts, by Country (2020-2032) (USD Billion)

11.6.3 Latin America Online Grocery Market Estimates and Forecasts, byPlatform (2020-2032) (USD Billion) 

11.6.4 Latin America Online Grocery Market Estimates and Forecasts, by Product (2020-2032) (USD Billion)

11.6.5 Latin America Online Grocery Market Estimates and Forecasts, by Delivery Type (2020-2032) (USD Billion)

11.6.6 Latin America Online Grocery Market Estimates and Forecasts, by Purchase Type (2020-2032) (USD Billion)

11.6.7 Brazil

11.6.7.1 Brazil Online Grocery Market Estimates and Forecasts, byPlatform (2020-2032) (USD Billion)

11.6.7.2 Brazil Online Grocery Market Estimates and Forecasts, by Product (2020-2032) (USD Billion)

11.6.7.3 Brazil Online Grocery Market Estimates and Forecasts, by Delivery Type (2020-2032) (USD Billion)

11.6.7.4 Brazil Online Grocery Market Estimates and Forecasts, by Purchase Type (2020-2032) (USD Billion)

11.6.8 Argentina

11.6.8.1 Argentina Online Grocery Market Estimates and Forecasts, byPlatform (2020-2032) (USD Billion)

11.6.8.2 Argentina Online Grocery Market Estimates and Forecasts, by Product (2020-2032) (USD Billion)

11.6.8.3 Argentina Online Grocery Market Estimates and Forecasts, by Delivery Type (2020-2032) (USD Billion)

11.6.8.4 Argentina Online Grocery Market Estimates and Forecasts, by Purchase Type (2020-2032) (USD Billion)

11.6.9 Colombia

11.6.9.1 Colombia Online Grocery Market Estimates and Forecasts, byPlatform (2020-2032) (USD Billion)

11.6.9.2 Colombia Online Grocery Market Estimates and Forecasts, by Product (2020-2032) (USD Billion)

11.6.9.3 Colombia Online Grocery Market Estimates and Forecasts, by Delivery Type (2020-2032) (USD Billion)

11.6.9.4 Colombia Online Grocery Market Estimates and Forecasts, by Purchase Type (2020-2032) (USD Billion)

11.6.10 Rest of Latin America

11.6.10.1 Rest of Latin America Online Grocery Market Estimates and Forecasts, byPlatform (2020-2032) (USD Billion)

11.6.10.2 Rest of Latin America Online Grocery Market Estimates and Forecasts, by Product (2020-2032) (USD Billion)

11.6.10.3 Rest of Latin America Online Grocery Market Estimates and Forecasts, by Delivery Type (2020-2032) (USD Billion)

11.6.10.4 Rest of Latin America Online Grocery Market Estimates and Forecasts, by Purchase Type (2020-2032) (USD Billion)

12. Company Profiles

12.1 Target Brands

12.1.1 Company Overview

12.1.2 Financial

12.1.3 Products/ Verticals Offered

12.1.4 SWOT Analysis

12.2 Tesco.com

12.2.1 Company Overview

12.2.2 Financial

12.2.3 Products/ Verticals Offered

12.2.4 SWOT Analysis

12.3 The Kroger Co

12.3.1 Company Overview

12.3.2 Financial

12.3.3 Products/ Verticals Offered

12.3.4 SWOT Analysis

12.4 Walmart

12.4.1 Company Overview

12.4.2 Financial

12.4.3 Products/ Verticals Offered

12.4.4 SWOT Analysis

12.5 Alibaba.com

12.5.1 Company Overview

12.5.2 Financial

12.5.3 Products/ Verticals Offered

12.5.4 SWOT Analysis

12.6 Amazon.com

12.6.1 Company Overview

12.6.2 Financial

12.6.3 Products/ Verticals Offered

12.6.4 SWOT Analysis

12.7 Instacart

12.7.1 Company Overview

12.7.2 Financial

12.7.3 Products/ Verticals Offered

12.7.4 SWOT Analysis

12.8 JD.com

12.8.1 Company Overview

12.8.2 Financial

12.8.3 Products/ Verticals Offered

12.8.4 SWOT Analysis

12.9 Supermarket Grocery Supplies Pvt

12.9.1 Company Overview

12.9.2 Financial

12.9.3 Products/ Verticals Offered

12.9.4 SWOT Analysis

12.10  AEON CO., LTD

12.10.1 Company Overview

12.10.2 Financial

12.10.3 Products/ Verticals Offered

12.10.4 SWOT Analysis

13. Use Cases and Best Practices

14. Conclusion

An accurate research report requires proper strategizing as well as implementation. There are multiple factors involved in the completion of good and accurate research report and selecting the best methodology to compete the research is the toughest part. Since the research reports we provide play a crucial role in any company’s decision-making process, therefore we at SNS Insider always believe that we should choose the best method which gives us results closer to reality. This allows us to reach at a stage wherein we can provide our clients best and accurate investment to output ratio.

Each report that we prepare takes a timeframe of 350-400 business hours for production. Starting from the selection of titles through a couple of in-depth brain storming session to the final QC process before uploading our titles on our website we dedicate around 350 working hours. The titles are selected based on their current market cap and the foreseen CAGR and growth.


The 5 steps process:

Step 1: Secondary Research:

Secondary Research or Desk Research is as the name suggests is a research process wherein, we collect data through the readily available information. In this process we use various paid and unpaid databases which our team has access to and gather data through the same. This includes examining of listed companies’ annual reports, Journals, SEC filling etc. Apart from this our team has access to various associations across the globe across different industries. Lastly, we have exchange relationships with various university as well as individual libraries.

Secondary Research

Step 2: Primary Research

When we talk about primary research, it is a type of study in which the researchers collect relevant data samples directly, rather than relying on previously collected data.  This type of research is focused on gaining content specific facts that can be sued to solve specific problems. Since the collected data is fresh and first hand therefore it makes the study more accurate and genuine.

We at SNS Insider have divided Primary Research into 2 parts.

Part 1 wherein we interview the KOLs of major players as well as the upcoming ones across various geographic regions. This allows us to have their view over the market scenario and acts as an important tool to come closer to the accurate market numbers. As many as 45 paid and unpaid primary interviews are taken from both the demand and supply side of the industry to make sure we land at an accurate judgement and analysis of the market.

This step involves the triangulation of data wherein our team analyses the interview transcripts, online survey responses and observation of on filed participants. The below mentioned chart should give a better understanding of the part 1 of the primary interview.

Primary Research

Part 2: In this part of primary research the data collected via secondary research and the part 1 of the primary research is validated with the interviews from individual consultants and subject matter experts.

Consultants are those set of people who have at least 12 years of experience and expertise within the industry whereas Subject Matter Experts are those with at least 15 years of experience behind their back within the same space. The data with the help of two main processes i.e., FGDs (Focused Group Discussions) and IDs (Individual Discussions). This gives us a 3rd party nonbiased primary view of the market scenario making it a more dependable one while collation of the data pointers.

Step 3: Data Bank Validation

Once all the information is collected via primary and secondary sources, we run that information for data validation. At our intelligence centre our research heads track a lot of information related to the market which includes the quarterly reports, the daily stock prices, and other relevant information. Our data bank server gets updated every fortnight and that is how the information which we collected using our primary and secondary information is revalidated in real time.

Data Bank Validation

Step 4: QA/QC Process

After all the data collection and validation our team does a final level of quality check and quality assurance to get rid of any unwanted or undesired mistakes. This might include but not limited to getting rid of the any typos, duplication of numbers or missing of any important information. The people involved in this process include technical content writers, research heads and graphics people. Once this process is completed the title gets uploader on our platform for our clients to read it.

Step 5: Final QC/QA Process:

This is the last process and comes when the client has ordered the study. In this process a final QA/QC is done before the study is emailed to the client. Since we believe in giving our clients a good experience of our research studies, therefore, to make sure that we do not lack at our end in any way humanly possible we do a final round of quality check and then dispatch the study to the client.

Key Segments:

By Platform

  • Web-Based

  • App-Based

By Product

  • Fresh produce

  • Breakfast & dairy

  • Snacks & beverages

  • Meat & seafood

  • Staples & cooking essentials

  • Others

By Delivery

  • Instant Delivery

  • Schedule Delivery

By Purchase

  • One-Time

  • Subscription
     

Request for Segment Customization as per your Business Requirement: Segment Customization Request

REGIONAL COVERAGE:

North America

  • US

  • Canada

  • Mexico

Europe

  • Eastern Europe

    • Poland

    • Romania

    • Hungary

    • Turkey

    • Rest of Eastern Europe

  • Western Europe

    • Germany

    • France

    • UK

    • Italy

    • Spain

    • Netherlands

    • Switzerland

    • Austria

    • Rest of Western Europe

Asia Pacific

  • China

  • India

  • Japan

  • South Korea

  • Vietnam

  • Singapore

  • Australia

  • Rest of Asia Pacific

Middle East & Africa

  • Middle East

    • UAE

    • Egypt

    • Saudi Arabia

    • Qatar

    • Rest of the Middle East

  • Africa

    • Nigeria

    • South Africa

    • Rest of Africa

Latin America

  • Brazil

  • Argentina

  • Colombia

Request for Country Level Research Report: Country Level Customization Request

Available Customization

With the given market data, SNS Insider offers customization as per the company’s specific needs. The following customization options are available for the report:

  • Product Analysis

  • Criss-Cross segment analysis (e.g. Product X Application)

  • Product Matrix which gives a detailed comparison of product portfolio of each company

  • Geographic Analysis

  • Additional countries in any of the regions

  • Company Information

  • Detailed analysis and profiling of additional market players (Up to five)


  •            5000 (33% Discount)


  •            8950 (40% Discount)


  •            3050 (23% Discount)

Start a Conversation

Hi! Click one of our member below to chat on Phone