In Vivo Toxicology Market Report Scope & Overview:
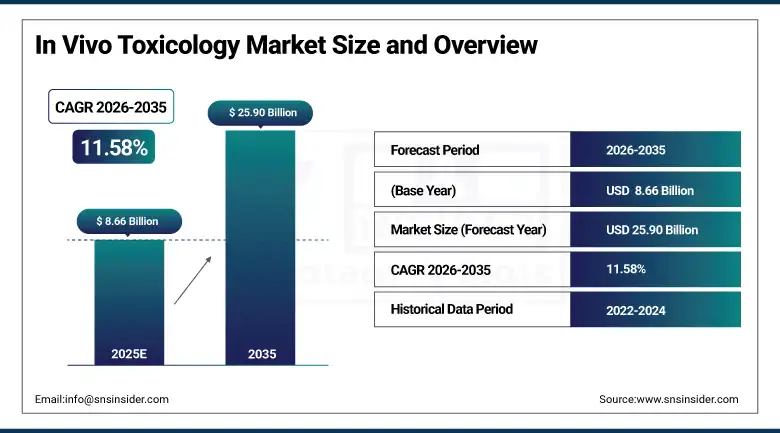
The In Vivo Toxicology Market was valued at USD 8.66 Billion in 2025. It is projected to reach USD 25.90 Billion by 2035, expanding at a CAGR of 11.58% over the forecast period of 2026–2035.
The growth of the global in vivo toxicology market is fueled by the increasing need to ensure the assessment of safety, especially during pharmaceutical and biotechnology product development. An increase in drug discovery pipelines, biologics, and gene therapy research, as well as stringent requirements set by health authorities, is propelling the market growth of global in vivo toxicology services. Furthermore, growth in contract research organizations, technological developments in animal modeling, and increasing funding for biomedical research have a strong impact on the global market growth. An increase in emphasis on ensuring drug safety, predictive toxicology, and approval requirements is driving the growth of the global market, especially with respect to in vivo testing platforms.
In March 2025, regulatory agencies reported a 27% increase in preclinical toxicology submissions for biologics and gene therapy candidates, highlighting the growing importance of advanced in vivo toxicology studies in regulatory drug development pathways.
In Vivo Toxicology Market Size and Forecast:
-
Market Size in 2025: USD 8.66 Billion
-
Market Size by 2035: USD 25.90 Billion
-
CAGR: 11.58% from 2026 to 2035
-
Base Year: 2025
-
Forecast Period: 2026–2035
-
Historical Data: 2022–2024
To Get more information On In Vivo Toxicology Market - Request Free Sample Report
In Vivo Toxicology Market Trends:
-
Increasing use of genetically modified animal models to improve predictive accuracy of toxicology studies for biologics and advanced therapeutics.
-
Rising integration of digital pathology, imaging technologies, and AI-enabled data analysis to enhance interpretation of toxicological endpoints.
-
Growing adoption of specialized rodent and non-rodent animal models for evaluating long-term toxicity and safety of gene therapies.
-
Expansion of contract research organizations offering outsourced in vivo toxicology services to pharmaceutical and biotechnology companies.
-
Rising regulatory emphasis on detailed safety evaluation for oncology, immunotherapy, and rare disease drugs.
-
Increasing investments in translational toxicology research to improve correlation between preclinical animal studies and human outcomes.
-
Growing use of advanced biomarkers and molecular profiling techniques to enhance toxicity endpoint analysis in preclinical studies.
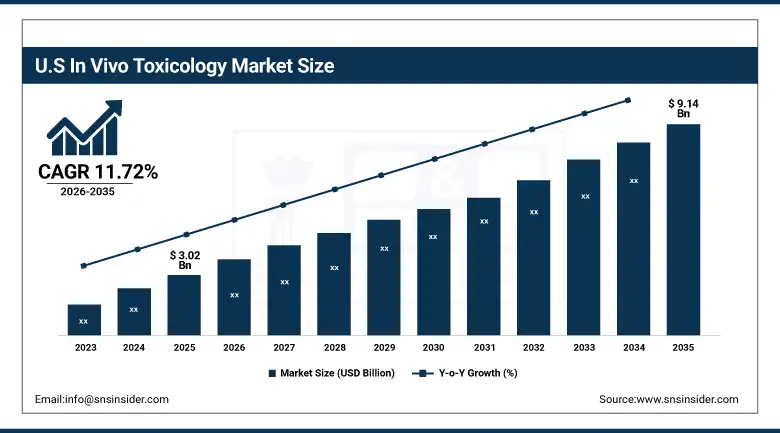
The U.S. In Vivo Toxicology Market is estimated at USD 3.02 billion in 2025 and is expected to reach USD 9.14 billion by 2035, growing at a CAGR of 11.72% from 2026-2035. The U.S. has the highest market share due to a well-established pharmaceutical R&D environment, high-end laboratory facilities, and major contract research organizations. The high R&D investments by pharmaceutical companies and strict regulations for preclinical safety testing are major contributors to market growth in this country. In addition, innovation in animal models and a high number of biotechnology companies with a large number of drug development pipelines and clinical trials also contribute to in vivo toxicology service market growth in this country.
In Vivo Toxicology Market Growth Drivers:
-
Rising Pharmaceutical and Biotechnology Drug Development Driving Market Expansion
The rapid expansion of research pipelines in the pharmaceutical and biotechnology industry is one of the key factors driving the growth of the in vivo toxicology market. Prior to initiating clinical trials, it is of utmost importance for regulatory bodies to conduct preclinical toxicology studies for evaluating the safety, tolerance, and adverse effects of drugs. The results of in vivo toxicology tests provide crucial information about the systemic toxicity, pharmacodynamics, and long-term safety of drugs, which cannot be achieved through in vitro tests. The increasing focus of pharmaceutical companies on developing biologics, monoclonal antibodies, cell therapies, and gene therapies is a major factor that has increased the complexity of the safety evaluation of drugs. These advanced therapies, which are being developed by the pharmaceutical industry, require animal models and toxicology studies for evaluating the immune response, organ toxicity, and physiological effects of drugs. Therefore, it is observed that pharmaceutical and biotechnology companies are investing more in conducting toxicology research.
For example, in February 2025, several global pharmaceutical companies expanded their preclinical toxicology programs for cell and gene therapies, resulting in a 30% increase in demand for advanced in vivo toxicology studies in specialized research facilities.
In Vivo Toxicology Market Restraints:
-
Ethical Concerns and Regulatory Restrictions on Animal Testing Limiting Market Growth
The ethical issues related to the animal testing for the scientific research and rise in the regulatory restrictions are the some key challenges for in vivo toxicology market. In many countries this is legislatively enforced by introducing stringent norms and guidelines for animals used in toxicity studies and testing design in terms of animal welfare and testing design. This is raising operating cost and time to conduct research in in vivo market. In addition, with the higher awareness of the public about the alternate testing methods like organ-on-chip technology and in vitro tests, refineries are now also looking for alternative toxicology tests. In vivo studies are critical for performing systemic toxicity tests, however, the increasing regulatory norms as well as ethical concerns may eventually hamper the in vivo toxicology market.
In Vivo Toxicology Market Opportunities:
-
Expansion of Outsourced Toxicology Services Creating Significant Market Opportunities
Outsourcing of preclinical toxicology studies by pharmaceutical companies is one of the key opportunities expected to drive the in vivo toxicology market growth. High infrastructure investment needed to construct research facilities in-house has been a growing trend observed in the pharmaceuticals companies especially in the biotechnology sector who are outsourcing the complex toxicology studies to CROs. By outsourcing toxicology studies, pharmaceutical companies will be able to lower their operational costs as well as have access to high-end testing facilities, expertise and compliance to regulatory measures. CROs would offer pharmaceutical companies scalable testing services to scale down drug discovery time and manage various projects at once. The market growth of outsourced in vivo toxicology services would also benefit from the rise in CRO facilities, increase in toxicology testing services, strategic partnerships between research organizations and pharmaceutical companies.
For instance, in April 2025, a leading contract research organization expanded its global toxicology laboratory network by establishing a new preclinical research facility capable of conducting complex long-term in vivo toxicity studies for biologics and gene therapies.
In Vivo Toxicology Market Segment Analysis:
-
By product, consumables accounted for the largest share of 61.48% in 2025, while the instruments segment is expected to grow at a CAGR of 10.74% during the forecast period.
-
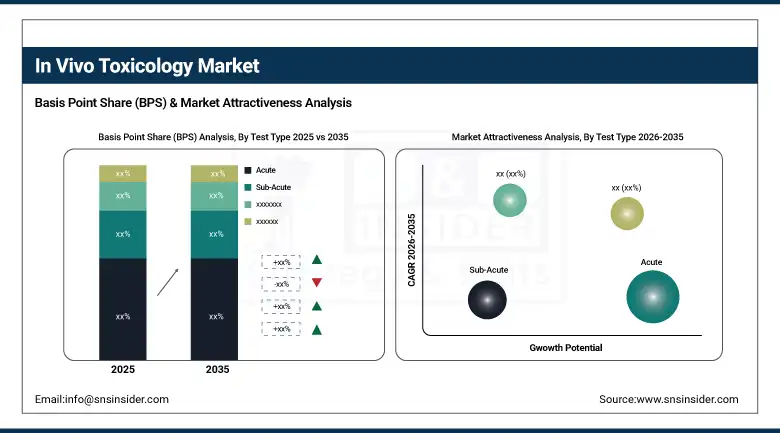
By test type, the acute toxicity testing segment held the largest market share of 29.66% in 2025, while chronic toxicity testing is projected to grow at the highest CAGR of 12.41%.
-
By testing facility, outsourced testing facilities dominated the market with a share of approximately 63.18% in 2025 and are anticipated to grow at a CAGR of 12.06%.
-
By toxicity endpoint, systemic toxicity accounted for the largest market share of 31.22% in 2025, while developmental & reproductive toxicity (DART) is expected to grow at the fastest CAGR of 12.65%.
-
By end user, pharmaceutical & biotechnology companies held the largest share of around 46.55% in 2025, while contract research organizations are projected to witness the fastest growth with a CAGR of 12.73%.
By Product: Consumables Dominate Due to Continuous Use in Toxicology Studies
The consumables segment has shown the highest share in the market, around 61.48%, in 2025 due to the high usage rate of reagents, kits, and animal models in conducting experiments in toxicology. In conducting experiments in toxicology, there is a need for continuous consumption of various reagents and laboratory chemicals and genetically engineered models of animals to effectively assess toxicity endpoints. Moreover, the need for transgenic models of animals and detection kits is also a factor in the growth rate of this segment. The segment that comprises laboratory equipment, such as imaging equipment, monitoring equipment, and equipment for conducting toxicology analysis, is also expected to rise in the coming years.
By Test Type: Acute Testing Leads; Chronic Testing Is the Growth Story
The acute toxicity testing contributed to the highest share of roughly 29.66% in 2025, due to its significance in assessment of acute toxic effects of drug candidates after single exposure. This kind of test gives an idea of the effective range of dosages of a drug and how much damage it would cause. However, chronic toxicity tests are projected to register the fastest growth during the forecast period, owing to the increasing number of long-term therapeutic advancements and biologics, which require long-term assessment over a prolonged duration.
By Testing Facility: Outsourced Facilities Dominate
The highest market share of around 63.18% was held by outsourced testing facilities in the year 2025. This is because pharmaceutical companies are increasingly outsourcing complex toxicology studies to contract research organizations. This is because they are equipped with the latest infrastructure and research teams that are skilled enough to carry out all types of toxicology testing. The outsourcing of such services is increasing as pharmaceutical companies are trying to reduce operational costs.
By Toxicity Endpoint: Systemic Toxicity Leads; DART Testing Grows Fastest
The segment for systemic toxicity held the highest share in the market in terms of revenue, i.e., approximately 31.22% in 2025. This is because this segment is critical in assessing the physiological impact of drug candidates. Systemic toxicity tests are critical in obtaining comprehensive knowledge about the specific organ toxicity and metabolic responses of drug candidates. On the other hand, developmental and reproductive toxicity testing is estimated to register the highest growth rate in the coming years due to the increasing need for assessing the reproductive toxicity of pharmaceutical compounds.
By End User: Pharma and Biotech Lead; CROs Are the Fastest-Growing Category
The pharmaceutical and biotechnology industry segment had the highest share of around 46.55% in the year 2025. This is because these industries have a high number of drugs in development and always require preclinical safety testing. These companies spend heavily on toxicology research studies to achieve regulatory approval for the drugs. The contract research industry segment is expected to grow at the highest rate during the forecast period. This is because pharmaceutical companies are outsourcing complex toxicology studies to contract research organizations.
In Vivo Toxicology Market Regional Highlights:
North America In Vivo Toxicology Market Insights:
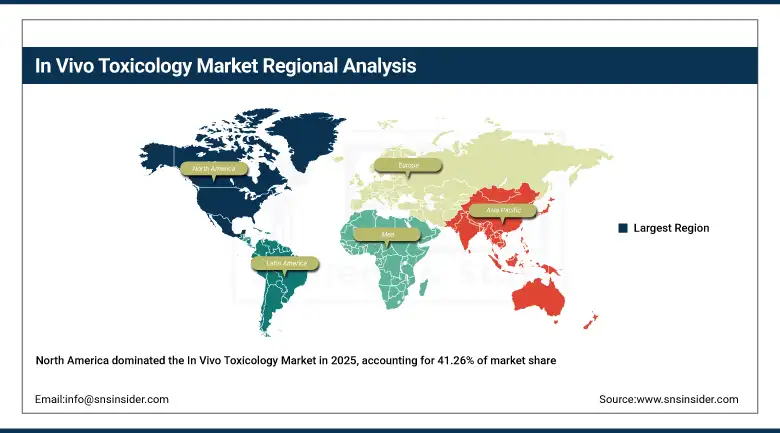
North America accounted for the highest share of approximately 41.26% of the market revenue in 2025, led by the presence of pharmaceutical companies, well-equipped laboratory facilities, and stringent rules governing drug safety evaluation. North America is well-supported by high R&D investments, strong academic research centers, and a number of contract research organizations focused on toxicology studies. Ongoing innovations in animal modeling techniques, coupled with increasing clinical trials, are driving the growth of the in vivo toxicology market in North America.
Get Customized Report as per Your Business Requirement - Enquiry Now
Asia Pacific In Vivo Toxicology Market Insights:
The Asia Pacific market is expected to be the highest-growing market and is anticipated to register a CAGR of 12.94% during the forecast period. The rapid growth in pharmaceutical manufacturing, increased biomedical research, and growth in contract research organizations are some of the major factors that contribute to the high growth rate in this market. Countries such as China, India, and South Korea are heavily investing in biotechnology research and development and preclinical testing. In addition, lower operational costs and a large patient pool for conducting clinical research in this region are also contributing to the growth in in vivo toxicology testing.
Europe In Vivo Toxicology Market Insights:
Europe is the second-largest market, driven by robust support from governments for biomedical research, the presence of established pharmaceutical industries, and collaborative research efforts in several countries. In Europe, regulatory authorities are keen on conducting thorough tests for the safety of drugs, hence the need for pre-clinical toxicology services. In addition, the link between academic research centers and biotechnology companies helps in the development of toxicology studies in Europe.
Latin America (LATAM) and Middle East & Africa (MEA) In Vivo Toxicology Market Insights:
The Latin American and Middle East & Africa markets are slowly growing due to the increasing investments in healthcare research infrastructure and the presence of the pharmaceutical industry. Government initiatives for clinical research, the expansion of regional CRO infrastructure, and the increasing demand for drug safety testing are also fueling the growth of the market. Although the Latin American and Middle East & Africa markets are small compared to the global market, the improvements in infrastructure and research are expected to generate more business for in vivo toxicology service providers.
In Vivo Toxicology Market Competitive Landscape:
Charles River Laboratories (founded in 1947) is a global leader in preclinical research services, offering comprehensive in vivo toxicology testing solutions for pharmaceutical, biotechnology, and medical device companies. The company provides advanced animal models, toxicology assessments, and regulatory consulting services to support drug development programs.
-
In January 2025, expanded its toxicology testing facilities in North America to support growing demand for biologics and gene therapy safety evaluation.
Labcorp Drug Development (founded in 1996) provides extensive preclinical and clinical research services including in vivo toxicology testing, pharmacokinetic analysis, and regulatory compliance solutions for pharmaceutical and biotechnology companies worldwide.
-
In February 2025, introduced advanced digital pathology capabilities to improve data interpretation in long-term toxicology studies.
Eurofins Scientific (founded in 1987) operates a global network of laboratories specializing in pharmaceutical safety testing, offering comprehensive toxicology services including acute, sub-chronic, and chronic toxicity studies.
-
In March 2025, expanded its preclinical toxicology service portfolio to support emerging cell and gene therapy development programs.
In Vivo Toxicology Market Key Players:
-
Charles River Laboratories
-
Labcorp Drug Development
-
Eurofins Scientific
-
IQVIA
-
WuXi AppTec
-
Evotec SE
-
Pharmaron
-
Envigo (Inotiv)
-
Crown Bioscience
-
SGS Life Sciences
-
PRA Health Sciences
-
Toxikon
-
BioReliance (Merck KGaA)
-
Frontage Laboratories
-
Intertek Pharmaceutical Services
-
SRI International
-
Jubilant Biosys
-
Covance Research Products
-
Pharmaceutical Product Development (PPD)
-
Oncodesign Services
| Report Attributes | Details |
|---|---|
| Market Size in 2025 | USD 8.66 Billion |
| Market Size by 2035 | USD 25.90 Billion |
| CAGR | CAGR of 11.58% From 2026 to 2035 |
| Base Year | 2025 |
| Forecast Period | 2026-2035 |
| Historical Data | 2022-2024 |
| Report Scope & Coverage | Market Size, Segments Analysis, Competitive Landscape, Regional Analysis, DROC & SWOT Analysis, Forecast Outlook |
| Key Segments | • By Product (Instruments, Consumables (Reagents & Kits, Animal Models)) • By Test Type (Acute, Sub-Acute, Sub-Chronic, and Chronic Test Type) • By Testing Facility (Outsourced Testing Facility, In-House Testing Facility) • By Toxicity Endpoint (Immunotoxicity, Systemic Toxicity, Carcinogenicity, Genotoxicity, Developmental & Reproductive Toxicity (DART), and Others) • By End User (Academic and Research Institutes, Pharmaceutical & Biotechnology Companies, Contract Research Organizations, and Others) |
| Regional Analysis/Coverage | North America (US, Canada, Mexico), Europe (Germany, France, UK, Italy, Spain, Poland, Turkey, Rest of Europe), Asia Pacific (China, India, Japan, South Korea, Singapore, Australia, Rest of Asia Pacific), Middle East & Africa (UAE, Saudi Arabia, Qatar, South Africa, Rest of Middle East & Africa), Latin America (Brazil, Argentina, Rest of Latin America) |
| Company Profiles | Charles River Laboratories, Labcorp Drug Development, Eurofins Scientific, IQVIA, WuXi AppTec, Evotec SE, Pharmaron, Envigo (Inotiv), Crown Bioscience, SGS Life Sciences, PRA Health Sciences, Toxikon, BioReliance (Merck KGaA), Frontage Laboratories, Intertek Pharmaceutical Services, SRI International, Jubilant Biosys, Covance Research Products, Pharmaceutical Product Development (PPD), Oncodesign Services |
Frequently Asked Questions
The market is expected to grow from USD 8.66 billion in 2025 to USD 25.90 billion by 2035, registering a CAGR of 11.58% during 2026–2035.
Market growth is driven by increasing pharmaceutical and biotechnology drug development, rising demand for preclinical safety testing, expanding CRO services, and stricter regulatory requirements for drug approval.
The consumables segment dominated the market in 2025, accounting for 61.48% share, due to continuous use of reagents, kits, and animal models in toxicology studies.
North America holds the largest market share (about 41.26% in 2025) due to strong pharmaceutical R&D infrastructure and strict regulatory frameworks.
Pharmaceutical and biotechnology companies represent the largest end-user segment, driven by extensive drug development pipelines and regulatory safety testing requirements.
Get in Touch
