image

Semiconductor Recycling & Sustainability Market Report Scope & Overview:

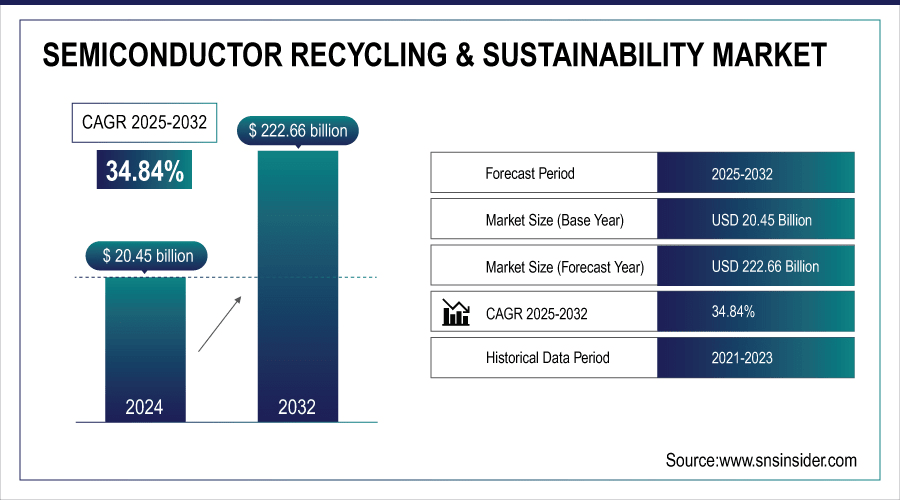
The semiconductor recycling & sustainability market size was valued at USD 20.45 billion in 2024 and is expected to reach USD 222.66 billion by 2032, growing at a CAGR of 34.84% over the forecast period of 2025-2032.   

The semiconductor recycling & sustainability market growth is driven by factors, such as increasing e-waste, demand for sustainable electronics, government regulations,  technological advancements in recycling, and the transformation of electric vehicles and IoT.

Increased sustainability concerns, stringent regulations imposed by the government, and the demand for eco-friendly production processes are some of the major factors driving the semiconductor recycling and sustainable market. Businesses are looking to spend less on electronic waste and to recycle materials like silicon, gold, and rare earth metals. There is also a push for considering the circular economy as well as the high prices for raw semiconductor materials that are helping to promote recycling efforts. Green chemistry and innovations within recycling technologies also make it more effective, thus contributing to the sustainability of semiconductor supply chains in the longer run.

For instance, Samsung launched a circular battery supply chain, recycling cobalt from used Galaxy devices to reuse in future batteries, such as 50% recycled cobalt in Galaxy S25 batteries.

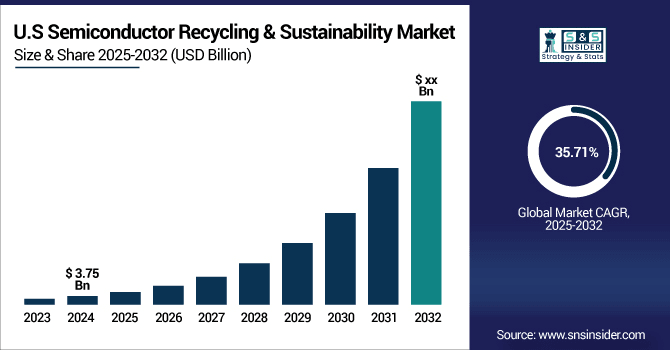
The U.S. semiconductor recycling & sustainability market is estimated to be USD 3.75 billion in 2024 and is projected to grow at a CAGR of 35.71% during the forecast period. Growth in corporate ESG commitments, semiconductor manufacturing incentives in the U.S. under the CHIPS Act, and supply chain resiliency drives market growth in the U.S. semiconductor recycling & sustainability market. Moreover, alliances between technology companies and recyclers are accelerating the establishment of closed-loop systems.

Market Dynamics:

Key Drivers: 

  • Driving Sustainability Through Semiconductor Recycling and Eco Friendly Material Recovery Solutions

A key driver for the semiconductor recycling and sustainable market is the growing pressure to reduce electronic waste and minimize environmental impact. Rising demand for rare and expensive materials like silicon and precious metals is pushing companies to adopt recycling practices. Additionally, strict environmental regulations and sustainability goals are encouraging manufacturers to implement eco-friendly solutions. The shift toward a circular economy, along with technological advancements in material recovery and recycling processes, is further propelling market growth and long-term environmental responsibility.

 According to the Global E-waste Monitor 2024, global e-waste hit 62 million metric tons in 2023, with only 22% being recycled formally, highlighting the urgency of this challenge.

Restraints: 

  • High Costs, Complex Processes, and Lack of Global Regulatory Standards Hamper Market Expansion

The complexity and cost of the recycling process itself are one of the major restraints for semiconductor recycling & sustainability market growth. The chip itself includes multiple layers of sophisticated materials, such as silicon, gallium arsenide, and even rare metals, which are blended fairly intricately during manufacturing. High-end specialized techniques and methods are used to separate these materials without destroying integrity, but they are expensive. Moreover, a lot of older semiconductor materials are toxic and thus, safe disposal and recovery tend to be more difficult. The absence of standard global recycling regulations causes further delay in collection and processing.

For instance, in 2023 report from the United Nations states that more than three-quarters of global electronic waste is either undocumented or treated informally, reducing recovery efficiency and risk to the environment.

Opportunities:

  • Growing EV and IoT Adoption Accelerates Demand for Semiconductor Recycling and Sustainable Global Supply Chains

Increased usage of EVs, IoT devices, and smart electronics gives semiconductor recycling an added consideration. As these technologies become more ubiquitous, and given that semiconductors can be in a large number, such as more than 3,000 chips can go into some EVs, the amount of semiconductor consumption rises. The increase in demand is fueling the creation of recovery systems and sustainable supply chains. In addition, the EU, South Korea, and Japan, together represent just under 50% of the battery-critical minerals sourcing value chain, have established favourable regulatory frameworks and incentive schemes to drive companies toward sustainable recycling technologies.

For instance, in 2023 alone, global EV sales surged beyond 14 million units according to the International Energy Agency (IEA), further driving the demand for sustainable semiconductor solutions.

Challenges:

  • Lack of Infrastructure and Economic Viability Hinder Semiconductor Recycling in Developing Global Markets

The massive barrier, especially in developing economies, remains the lack of capital-intensive advanced recycling infrastructure. Due to logistical obstacles in the home country, the majority of semiconductor recycling sites are located in the EU, Japan, and South Korea. Additionally, wider electronic streams, advances in technology, and shorter innovation cycles lead to components that are not applicable for reuse or refurbished and therefore not economically viable for recycling.

According to the Global E-waste Monitor 2024 says that in 2023, nearly 50 million metric tons of e-waste were improperly discarded in lower-income regions, but less than 5% have been processed through formal recycling channels.

Segmentation Analysis:

By Material

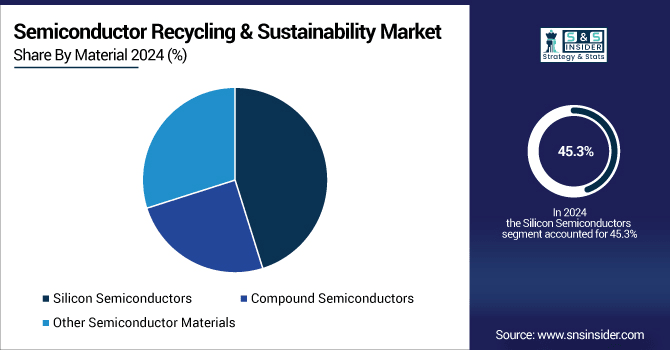
In 2024, the silicon semiconductors segment accounted for the largest share of 45.3%, and it is expected to grow the fastest in terms of CAGR from 2025 to 2032. This dominance stems from their extensive applications in major sectors, including consumer electronics, automotive, and renewable energy systems. Silicon still serves as the substrate for integrated circuits, owing to its abundance, low cost, and well-developed manufacturing infrastructure. To heighten its sustainable quality, it is also recyclable, which is an essential feature as businesses and countries move toward electronics to be greener. The growing environmental issues and demand for sustainable supply chains make silicon recycling more technically and economically viable. To overcome these challenges, innovations in wafer reclamation, including kerfless wafering, had gained considerable attention along with chemical treatment technologies to enhance the purification of materials while improving recovery yields.

By Application

In 2024, consumer electronics accounted for 31.4% share in the market, making it the dominant segment. The growth is attributed to the ubiquitous nature of semiconductors in consumer products,  such as smartphones, laptops, wearables, and other consumer devices, which sustain this segment as the largest contributor to semiconductor demand. The evolution of smarter, more connected, and energy-efficient electronics drives a strong demand for new and advanced semiconductors. Consumer electronics innovation, such as displays, sensors, and processors, also work to drive demand for semiconductor recycling, which continues to grow as a segment.

Automotive is projected to witness highest CAGR growth during 2025–2032. The segment’s expansion is driven by the automotive industry trend away from internal combustion engines to EVs and other new technologies, including driver-assistance systems (ADAS). As each EV contains thousands of semiconductor chips, there is increasing potential for these materials to be recycled. The continuous developments globally for greener and more sustainable transport, and in this context, the automotive semiconductor recycling market value is expected to increase in the automotive sector by 2032 as a means to minimize the dependency on raw materials and the ecological footprint associated with the broader development of vehicles.

Regional Analysis:

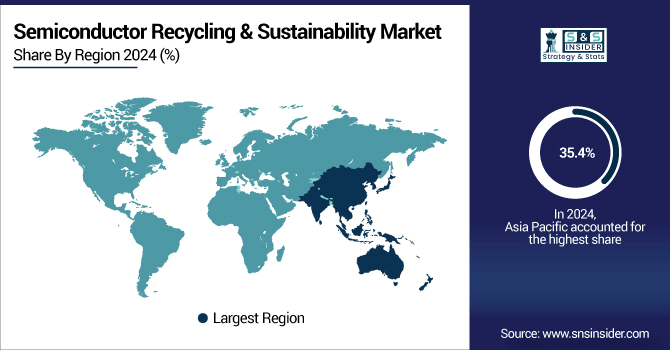
In 2024, Asia Pacific accounted for 35.4% of the semiconductor recycling & sustainability market, as it is the largest producer with a strong manufacturing ecosystem, rapid technological changes, and a high level of government support for sustainability initiatives. Semiconductor recycling solutions demand in the region is primarily driven by the presence of major semiconductor manufacturers, including TSMC, Samsung Electronics, and SMIC. China, Japan, and South Korea are the leading countries in the region, and large volumes of these materials are originating from China due to its main production capacity, low labor cost, and considerable investments in both electronics manufacturing and recycling facilities.

  • TSMC has made meaningful progress with its commitment to using 100% renewable energy throughout every global operation by 2050. The company has also poured resources into leading-edge wastewater recycling technologies to recycle over 85% of water used in fabrication plants.

  • ASML’s refurbishment center in Taoyuan, Taiwan, is representative of a circular economy trend, boasting an 88% reuse rate of defective parts on older lithography systems.

North America is anticipated to grow with the highest CAGR from 2025 to 2032 due to the fast adoption of EVs, tech advancements, and rapidly growing global demand for sustainable semiconductor solutions for EVs in the region. Similarly, given the number of high-tech giants in the U.S., such as Intel and Tesla, the country has been investing in the development of semiconductor recycling technologies and semiconductor recycling policies to advance green manufacturing. Additionally, the growing focus of the U.S. government toward e-waste reduction through legislation and providing incentives for green technologies further augments growth.

The Environmental Protection Agency (EPA) rolled out a record money pathway USD 100 million, for e-waste recycling projects in states, the largest amount of federal funding for recycling in more than 30 years.

Europe is a prominent region for the Semiconductor Recycling & Sustainability Market due to stringent environmental regulations, implementation of e-waste management programs, and initiatives focused on the circular economy. Its area is the basis for slight material dependence and improves recycling innovation.

Germany is the largest market owing to its comprehensive recycling infrastructure and dedication to the sustainable production of electronic waste.

Latin America and the Middle East & Africa have been slowly progressing in developing awareness of environmental issues and working toward greener practices. Growing urbanization, industrialization, and diverse government initiatives promoting waste management and circular economic policies in these regions are expected to drive the semiconductor recycling technology adoption globally.

Key players:

Some of the major players in the semiconductor recycling & sustainability market are Intel, GlobalWafers, ASML, Veolia North America, Entegris, Umicore, Reciprocity, SungEel HiTech, Siemens, and KLA Corporation.

Recent Trends:

  • In December 2023, Siemens and Intel announced a strategic collaboration to advance semiconductor manufacturing, focusing on sustainability, energy efficiency, and digitalization.

  • In March 2025, ASML and imec signed a five-year partnership to advance semiconductor research and sustainable innovation. The collaboration aims to develop cutting-edge technologies and promote environmental responsibility, reinforcing Europe's position in the semiconductor industry

Semiconductor Recycling & Sustainability Market Report Scope:

Report Attributes Details
Market Size in 2024 USD 20.45 Billion
Market Size by 2032 USD  222.66 Billion
CAGR CAGR of 34.84% From 2024 to 2032
Base Year 2024
Forecast Period 2025-2032
Historical Data 2020-2022
Report Scope & Coverage Market Size, Segments Analysis, Competitive  Landscape, Regional Analysis, DROC & SWOT Analysis, Forecast Outlook
Key Segments • By Material (Silicon Semiconductors, Compound Semiconductors, Other Semiconductor Materials)
• By Application (Consumer Electronics, Automotive, IT & Telecom, Industrial, Energy, Others)
Regional Analysis/Coverage North America (US, Canada, Mexico), Europe (Eastern Europe [Poland, Romania, Hungary, Turkey, Rest of Eastern Europe] Western Europe] Germany, France, UK, Italy, Spain, Netherlands, Switzerland, Austria, Rest of Western Europe]), Asia Pacific (China, India, Japan, South Korea, Vietnam, Singapore, Australia, Rest of Asia Pacific), Middle East & Africa (Middle East [UAE, Egypt, Saudi Arabia, Qatar, Rest of Middle East], Africa [Nigeria, South Africa, Rest of Africa], Latin America (Brazil, Argentina, Colombia, Rest of Latin America)
Company Profiles Cree Inc., Citizen Electronics, Philips Lumileds, Bridgelux, Samsung LED, Osram Opto Semiconductors, Seoul Semiconductor, Luminus Devices, Toyoda Gosei, Epistar.

Frequently Asked Questions

Ans: The Semiconductor Recycling & Sustainability Market is expected to grow at a CAGR of 34.84% from 2025-2032.

Ans: The Semiconductor Recycling & Sustainability Market size was USD 20.45 billion in 2024 and is expected to reach USD 222.66 billion by 2032.

Ans: The major growth factor of the Semiconductor Recycling & Sustainability Market is the increasing demand for eco-friendly practices and resource efficiency in semiconductor production.

Ans: The Silicon Semiconductors segment dominated the Semiconductor Recycling & Sustainability Market in 2024.

Ans: Asia Pacific dominated the Semiconductor Recycling & Sustainability Market in 2024.

Table of Contents

1. Introduction

1.1 Market Definition

1.2 Scope (Inclusion and Exclusions)

1.3 Research Assumptions

2. Executive Summary

2.1 Market Overview

2.2 Regional Synopsis

2.3 Competitive Summary

3. Research Methodology

3.1 Top-Down Approach

3.2 Bottom-up Approach

3.3. Data Validation

3.4 Primary Interviews

4. Market Dynamics Impact Analysis

4.1 Market Driving Factors Analysis

4.1.2 Drivers

4.1.2 Restraints

4.1.3 Opportunities

4.1.4 Challenges

4.2 PESTLE Analysis

4.3 Porter’s Five Forces Model

5. Statistical Insights and Trends Reporting

5.1 Wafer Utilization Rate

5.2 Die Per Wafer Ratio

5.3 Energy Consumption per Wafer

5.4 Cycle Time Reduction Trends

6. Competitive Landscape

6.1 List of Major Companies, By Region

6.2 Market Share Analysis, By Region

6.3 Product Benchmarking

6.3.1 Product specifications and features

6.3.2 Pricing

6.4 Strategic Initiatives

6.4.1 Marketing and promotional activities

6.4.2 Distribution and supply chain strategies

6.4.3 Expansion plans and new product launches

6.4.4 Strategic partnerships and collaborations

6.5 Technological Advancements

6.6 Market Positioning and Branding

7. Semiconductor Recycling & Sustainability Market Segmentation, By Material

7.1 Chapter Overview

7.2 Silicon Semiconductors

7.2.1 Silicon Semiconductors Market Trends Analysis (2020-2032)

7.2.2 Silicon Semiconductors Market Size Estimates and Forecasts to 2032 (USD Million)

7.3 Compound Semiconductors

7.3.1 Compound Semiconductors Market Trends Analysis (2020-2032)

7.3.2 Compound Semiconductors Market Size Estimates and Forecasts to 2032 (USD Million)

7.4 Other Semiconductor Materials

7.4.1 Other Semiconductor Materials Market Trends Analysis (2020-2032)

7.4.2 Other Semiconductor Materials Market Size Estimates and Forecasts to 2032 (USD Million)

8. Semiconductor Recycling & Sustainability Market Segmentation, By Application

8.1 Chapter Overview

8.2 Consumer Electronics

8.2.1 Consumer Electronics Market Trends Analysis (2020-2032)

8.2.2 Consumer Electronics Market Size Estimates and Forecasts to 2032 (USD Million)

8.3 Automotive

8.3. Automotive Market Trends Analysis (2020-2032)

8.3.2 Automotive Market Size Estimates and Forecasts to 2032 (USD Million)

8.4 IT & Telecom

8.4.1 IT & Telecom Market Trends Analysis (2020-2032)

8.4.2 IT & Telecom Market Size Estimates and Forecasts to 2032 (USD Million)

8.5 Industrial

8.5.1 Industrial Market Trends Analysis (2020-2032)

8.5.2 Industrial Market Size Estimates and Forecasts to 2032 (USD Million)

8.6 Energy

8.6.1 Energy Market Trends Analysis (2020-2032)

8.6.2 Energy Market Size Estimates and Forecasts to 2032 (USD Million)

8.7 Others

8.7.1 Others Market Trends Analysis (2020-2032)

8.7.2 Others Market Size Estimates and Forecasts to 2032 (USD Million)

9. Regional Analysis

9.1 Chapter Overview

9.2 North America

9.2.1 Trends Analysis

9.2.2 North America Semiconductor Recycling & Sustainability Market Estimates and Forecasts, by Country (2020-2032) (USD Million)

9.2.3 North America Semiconductor Recycling & Sustainability Market Estimates and Forecasts, By Material (2020-2032) (USD Million) 

9.2.4 North America Semiconductor Recycling & Sustainability Market Estimates and Forecasts, By Application (2020-2032) (USD Million)

9.2.5 USA

9.2.5.1 USA Semiconductor Recycling & Sustainability Market Estimates and Forecasts, By Material (2020-2032) (USD Million)

9.2.5.2 USA Semiconductor Recycling & Sustainability Market Estimates and Forecasts, By Application (2020-2032) (USD Million)

9.2.6 Canada

9.2.6.1 Canada Semiconductor Recycling & Sustainability Market Estimates and Forecasts, By Material (2020-2032) (USD Million)

9.2.6.2 Canada Semiconductor Recycling & Sustainability Market Estimates and Forecasts, By Application (2020-2032) (USD Million)

9.2.7 Mexico

9.2.7.1 Mexico Semiconductor Recycling & Sustainability Market Estimates and Forecasts, By Material (2020-2032) (USD Million)

9.2.7.2 Mexico Semiconductor Recycling & Sustainability Market Estimates and Forecasts, By Application (2020-2032) (USD Million)

9.3 Europe

9.3.1 Trends Analysis

9.3.2 Europe Semiconductor Recycling & Sustainability Market Estimates and Forecasts, by Country (2020-2032) (USD Million)

9.3.3 Europe Semiconductor Recycling & Sustainability Market Estimates and Forecasts, By Material (2020-2032) (USD Million) 

9.3.4 Europe Semiconductor Recycling & Sustainability Market Estimates and Forecasts, By Application (2020-2032) (USD Million)

9.3.5 Germany

9.3.5.1 Germany Semiconductor Recycling & Sustainability Market Estimates and Forecasts, By Material (2020-2032) (USD Million)

9.3.5.2 Germany Semiconductor Recycling & Sustainability Market Estimates and Forecasts, By Application (2020-2032) (USD Million)

9.3.6 France

9.3.6.1 France Semiconductor Recycling & Sustainability Market Estimates and Forecasts, By Material (2020-2032) (USD Million)

9.3.6.2 France Semiconductor Recycling & Sustainability Market Estimates and Forecasts, By Application (2020-2032) (USD Million)

9.3.7 UK

9.3.7.1 UK Semiconductor Recycling & Sustainability Market Estimates and Forecasts, By Material (2020-2032) (USD Million)

9.3.7.2 UK Semiconductor Recycling & Sustainability Market Estimates and Forecasts, By Application (2020-2032) (USD Million)

9.3.8 Italy

9.3.8.1 Italy Semiconductor Recycling & Sustainability Market Estimates and Forecasts, By Material (2020-2032) (USD Million)

9.3.8.2 Italy Semiconductor Recycling & Sustainability Market Estimates and Forecasts, By Application (2020-2032) (USD Million)

9.3.9 Spain

9.3.9.1 Spain Semiconductor Recycling & Sustainability Market Estimates and Forecasts, By Material (2020-2032) (USD Million)

9.3.9.2 Spain Semiconductor Recycling & Sustainability Market Estimates and Forecasts, By Application (2020-2032) (USD Million)

9.3.10 Poland

9.3.10.1 Poland Semiconductor Recycling & Sustainability Market Estimates and Forecasts, By Material (2020-2032) (USD Million)

9.3.10.2 Poland Semiconductor Recycling & Sustainability Market Estimates and Forecasts, By Application (2020-2032) (USD Million)

9.3.11 Turkey

9.3.11.1 France Semiconductor Recycling & Sustainability Market Estimates and Forecasts, By Material (2020-2032) (USD Million)

9.3.11.2 France Semiconductor Recycling & Sustainability Market Estimates and Forecasts, By Application (2020-2032) (USD Million)

9.3.12 Rest of Europe

9.3.12.1 UK Semiconductor Recycling & Sustainability Market Estimates and Forecasts, By Material (2020-2032) (USD Million)

9.3.12.2 UK Semiconductor Recycling & Sustainability Market Estimates and Forecasts, By Application (2020-2032) (USD Million)

9.4 Asia-Pacific

9.4.1 Trends Analysis

9.4.2 Asia-Pacific Semiconductor Recycling & Sustainability Market Estimates and Forecasts, by Country (2020-2032) (USD Million)

9.4.3 Asia-Pacific Semiconductor Recycling & Sustainability Market Estimates and Forecasts, By Material (2020-2032) (USD Million) 

9.4.4 Asia-Pacific Semiconductor Recycling & Sustainability Market Estimates and Forecasts, By Application (2020-2032) (USD Million)

9.4.5 China

9.4.5.1 China Semiconductor Recycling & Sustainability Market Estimates and Forecasts, By Material (2020-2032) (USD Million)

9.4.5.2 China Semiconductor Recycling & Sustainability Market Estimates and Forecasts, By Application (2020-2032) (USD Million)

9.4.6 India

9.4.5.1 India Semiconductor Recycling & Sustainability Market Estimates and Forecasts, By Material (2020-2032) (USD Million)

9.4.5.2 India Semiconductor Recycling & Sustainability Market Estimates and Forecasts, By Application (2020-2032) (USD Million)

9.4.5 Japan

9.4.5.1 Japan Semiconductor Recycling & Sustainability Market Estimates and Forecasts, By Material (2020-2032) (USD Million)

9.4.5.2 Japan Semiconductor Recycling & Sustainability Market Estimates and Forecasts, By Application (2020-2032) (USD Million)

9.4.6 South Korea

9.4.6.1 South Korea Semiconductor Recycling & Sustainability Market Estimates and Forecasts, By Material (2020-2032) (USD Million)

9.4.6.2 South Korea Semiconductor Recycling & Sustainability Market Estimates and Forecasts, By Application (2020-2032) (USD Million)

9.4.7 Singapore

9.4.7.1 Singapore Semiconductor Recycling & Sustainability Market Estimates and Forecasts, By Material (2020-2032) (USD Million)

9.4.7.2 Singapore Semiconductor Recycling & Sustainability Market Estimates and Forecasts, By Application (2020-2032) (USD Million)

9.4.8 Australia

9.4.8.1 Australia Semiconductor Recycling & Sustainability Market Estimates and Forecasts, By Material (2020-2032) (USD Million)

9.4.8.2 Australia Semiconductor Recycling & Sustainability Market Estimates and Forecasts, By Application (2020-2032) (USD Million)

9.4.9 Taiwan

9.4.9.1 Taiwan Semiconductor Recycling & Sustainability Market Estimates and Forecasts, By Material (2020-2032) (USD Million)

9.4.9.2 Taiwan Semiconductor Recycling & Sustainability Market Estimates and Forecasts, By Application (2020-2032) (USD Million)

9.4.10 Rest of Asia-Pacific

9.4.10.1 Rest of Asia-Pacific Semiconductor Recycling & Sustainability Market Estimates and Forecasts, By Material (2020-2032) (USD Million)

9.4.10.2 Rest of Asia-Pacific Semiconductor Recycling & Sustainability Market Estimates and Forecasts, By Application (2020-2032) (USD Million)

9.5 Middle East and Africa

9.5.1 Trends Analysis

9.5.2 Middle East Semiconductor Recycling & Sustainability Market Estimates and Forecasts, by Country (2020-2032) (USD Million)

9.5.3 Middle East Semiconductor Recycling & Sustainability Market Estimates and Forecasts, By Material (2020-2032) (USD Million) 

9.5.4 Middle East Semiconductor Recycling & Sustainability Market Estimates and Forecasts, By Application (2020-2032) (USD Million)

9.5.5 UAE

9.5.5.1 UAE Semiconductor Recycling & Sustainability Market Estimates and Forecasts, By Material (2020-2032) (USD Million)

9.5.5.2 UAE Semiconductor Recycling & Sustainability Market Estimates and Forecasts, By Application (2020-2032) (USD Million)

9.5.6 Saudi Arabia

9.5.6.1 Saudi Arabia Semiconductor Recycling & Sustainability Market Estimates and Forecasts, By Material (2020-2032) (USD Million)

9.5.6.2 Saudi Arabia Semiconductor Recycling & Sustainability Market Estimates and Forecasts, By Application (2020-2032) (USD Million)

9.5.7 Qatar

9.5.7.1 Qatar Semiconductor Recycling & Sustainability Market Estimates and Forecasts, By Material (2020-2032) (USD Million)

9.5.7.2 Qatar Semiconductor Recycling & Sustainability Market Estimates and Forecasts, By Application (2020-2032) (USD Million)

9.5.8 South Africa

9.5.8.1 South Africa Semiconductor Recycling & Sustainability Market Estimates and Forecasts, By Material (2020-2032) (USD Million)

9.5.8.2 South Africa Semiconductor Recycling & Sustainability Market Estimates and Forecasts, By Application (2020-2032) (USD Million)

9.5.9 Rest of Middle East

9.5.9.1 Rest of Middle East Semiconductor Recycling & Sustainability Market Estimates and Forecasts, By Material (2020-2032) (USD Million)

9.5.9.2 Rest of Middle East Semiconductor Recycling & Sustainability Market Estimates and Forecasts, By Application (2020-2032) (USD Million)

9.6 Latin America

9.6.1 Trends Analysis

9.6.2 Latin America Semiconductor Recycling & Sustainability Market Estimates and Forecasts, by Country (2020-2032) (USD Million)

9.6.3 Latin America Semiconductor Recycling & Sustainability Market Estimates and Forecasts, By Material (2020-2032) (USD Million) 

9.6.4 Latin America Semiconductor Recycling & Sustainability Market Estimates and Forecasts, By Application (2020-2032) (USD Million)

9.6.5 Brazil

9.6.5.1 Brazil Semiconductor Recycling & Sustainability Market Estimates and Forecasts, By Material (2020-2032) (USD Million)

9.6.5.2 Brazil Semiconductor Recycling & Sustainability Market Estimates and Forecasts, By Application (2020-2032) (USD Million)

9.6.6 Argentina

9.6.6.1 Argentina Semiconductor Recycling & Sustainability Market Estimates and Forecasts, By Material (2020-2032) (USD Million)

9.6.6.2 Argentina Semiconductor Recycling & Sustainability Market Estimates and Forecasts, By Application (2020-2032) (USD Million)

9.6.8 Rest of Latin America

9.6.8.1 Rest of Latin America Semiconductor Recycling & Sustainability Market Estimates and Forecasts, By Material (2020-2032) (USD Million)

9.6.8.2 Rest of Latin America Semiconductor Recycling & Sustainability Market Estimates and Forecasts, By Application (2020-2032) (USD Million)

10. Company Profiles

10.1 Intel Corporation,

              10.1.1 Company Overview

10.1.2 Financial

10.1.3 Products/ Services Offered

10.1.4 SWOT Analysis

10.2 GlobalWafers.

10.2.1 Company Overview

10.2.2 Financial

10.2.3 Products/ Services Offered

10.2.4 SWOT Analysis

10.3 ASML.

              10.3.1 Company Overview

10.3.2 Financial

10.3.3 Products/ Services Offered

10.3.4 SWOT Analysis

10.4 Veolia North America.

10.4.1 Company Overview

10.4.2 Financial

10.4.3 Products/ Services Offered

10.4.4 SWOT Analysis

10.5 Entegris

              10.5.1 Company Overview

10.5.2 Financial

10.5.3 Products/ Services Offered

10.5.4 SWOT Analysis

10.6 Umicore

10.6.1 Company Overview

10.6.2 Financial

10.6.3 Products/ Services Offered

10.6.4 SWOT Analysis

10.7 Recipro.

              10.7.1 Company Overview

10.7.2 Financial

10.7.3 Products/ Services Offered

10.7.4 SWOT Analysis

10.8 SungEel HiTech

              10.8.1 Company Overview

10.8.2 Financial

10.8.3 Products/ Services Offered

10.8.4 SWOT Analysis

10.9 Siemens

10.9.1 Company Overview

10.9.2 Financial

10.9.3 Products/ Services Offered

10.9.4 SWOT Analysis

10.10 KLA Corporation.

             10.10.1 Company Overview

10.10.2 Financial

10.10.3 Products/ Services Offered

10.10.4 SWOT Analysis

11. Use Cases and Best Practices

12. Conclusion

An accurate research report requires proper strategizing as well as implementation. There are multiple factors involved in the completion of good and accurate research report and selecting the best methodology to compete the research is the toughest part. Since the research reports we provide play a crucial role in any company’s decision-making process, therefore we at SNS Insider always believe that we should choose the best method which gives us results closer to reality. This allows us to reach at a stage wherein we can provide our clients best and accurate investment to output ratio.

Each report that we prepare takes a timeframe of 350-400 business hours for production. Starting from the selection of titles through a couple of in-depth brain storming session to the final QC process before uploading our titles on our website we dedicate around 350 working hours. The titles are selected based on their current market cap and the foreseen CAGR and growth.


The 5 steps process:

Step 1: Secondary Research:

Secondary Research or Desk Research is as the name suggests is a research process wherein, we collect data through the readily available information. In this process we use various paid and unpaid databases which our team has access to and gather data through the same. This includes examining of listed companies’ annual reports, Journals, SEC filling etc. Apart from this our team has access to various associations across the globe across different industries. Lastly, we have exchange relationships with various university as well as individual libraries.

Secondary Research

Step 2: Primary Research

When we talk about primary research, it is a type of study in which the researchers collect relevant data samples directly, rather than relying on previously collected data.  This type of research is focused on gaining content specific facts that can be sued to solve specific problems. Since the collected data is fresh and first hand therefore it makes the study more accurate and genuine.

We at SNS Insider have divided Primary Research into 2 parts.

Part 1 wherein we interview the KOLs of major players as well as the upcoming ones across various geographic regions. This allows us to have their view over the market scenario and acts as an important tool to come closer to the accurate market numbers. As many as 45 paid and unpaid primary interviews are taken from both the demand and supply side of the industry to make sure we land at an accurate judgement and analysis of the market.

This step involves the triangulation of data wherein our team analyses the interview transcripts, online survey responses and observation of on filed participants. The below mentioned chart should give a better understanding of the part 1 of the primary interview.

Primary Research

Part 2: In this part of primary research the data collected via secondary research and the part 1 of the primary research is validated with the interviews from individual consultants and subject matter experts.

Consultants are those set of people who have at least 12 years of experience and expertise within the industry whereas Subject Matter Experts are those with at least 15 years of experience behind their back within the same space. The data with the help of two main processes i.e., FGDs (Focused Group Discussions) and IDs (Individual Discussions). This gives us a 3rd party nonbiased primary view of the market scenario making it a more dependable one while collation of the data pointers.

Step 3: Data Bank Validation

Once all the information is collected via primary and secondary sources, we run that information for data validation. At our intelligence centre our research heads track a lot of information related to the market which includes the quarterly reports, the daily stock prices, and other relevant information. Our data bank server gets updated every fortnight and that is how the information which we collected using our primary and secondary information is revalidated in real time.

Data Bank Validation

Step 4: QA/QC Process

After all the data collection and validation our team does a final level of quality check and quality assurance to get rid of any unwanted or undesired mistakes. This might include but not limited to getting rid of the any typos, duplication of numbers or missing of any important information. The people involved in this process include technical content writers, research heads and graphics people. Once this process is completed the title gets uploader on our platform for our clients to read it.

Step 5: Final QC/QA Process:

This is the last process and comes when the client has ordered the study. In this process a final QA/QC is done before the study is emailed to the client. Since we believe in giving our clients a good experience of our research studies, therefore, to make sure that we do not lack at our end in any way humanly possible we do a final round of quality check and then dispatch the study to the client.

Key Segments: 

By Material

  • Silicon Semiconductors

  • Compound Semiconductors

  • Other Semiconductor Materials

By Application

  • Consumer Electronics

  • Automotive

  • IT & Telecom

  • Industrial

  • Energy

  • Others

Request for Segment Customization as per your Business Requirement: Segment Customization Request

Regional Coverage: 

North America

  • US

  • Canada

  • Mexico

Europe

  • Germany

  • France

  • UK

  • Italy

  • Spain

  • Poland

  • Turkey

  • Rest of Europe

Asia Pacific

  • China

  • India

  • Japan

  • South Korea

  • Singapore

  • Australia

  • Taiwan

  • Rest of Asia Pacific

Middle East & Africa

  • UAE

  • Saudi Arabia

  • Qatar

  • South Africa

  • Rest of Middle East & Africa

Latin America

  • Brazil

  • Argentina

  • Rest of Latin America

Request for Country Level Research Report: Country Level Customization Request

Available Customization 

With the given market data, SNS Insider offers customization as per the company’s specific needs. The following customization options are available for the report: 

  • Detailed Volume Analysis 

  • Criss-Cross segment analysis (e.g. Product X Application) 

  • Competitive Product Benchmarking 

  • Geographic Analysis 

  • Additional countries in any of the regions 

  • Customized Data Representation 

  • Detailed analysis and profiling of additional market players


  •            5000 (33% Discount)


  •            8950 (40% Discount)


  •            3050 (23% Discount)

Start a Conversation

Hi! Click one of our member below to chat on Phone