image

Recovered Carbon Black Market Key Insights:

Recovered Carbon Black Market Revenue Analysis

To Get More Information on Recovered Carbon Black Market - Request Sample Report

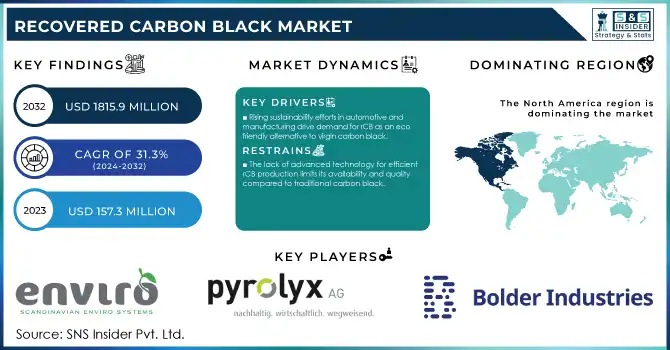
The Recovered Carbon Black Market Size was valued at USD 157.3 Million in 2023 and is expected to reach USD 1815.9 Million by 2032, growing at a CAGR of 31.3% over the forecast period 2024-2032.

The Recovered Carbon Black (rCB) market has experienced a significant boom owing to several key drivers, one of the main being a global push towards sustainability and reducing carbon footprint. As the environmental risks associated with carbon emissions and plastic pollution gain more global consciousness, many governments are enforcing strict regulations while encouraging the implementation of recycled materials such as recovered carbon black. According to a report from the U.S. Environmental Protection Agency (EPA), carbon black production contributes significantly to carbon emissions, creating a growing push towards recycling this valuable material.

In 2020 the European Union’s Circular Economy Action Plan announced plans to promote recycling and reuse of materials like carbon black for waste reduction. The ambitious targets set by countries such as the U.S., Germany, and China for reducing carbon emissions had a direct bearing on the carbon black industry, which has served to create demand for rCB. Recycled carbon black, derived from used tires and other rubber products, plays an essential role in meeting these sustainability targets. This allows the automotive and rubber industries to rely on less virgin carbon black, reducing their carbon footprints. As manufacturers look for less expensive, more sustainable substitutes, rCB is likely to see a significant increase in demand over the next few years. The government’s focus on environmental policies and sustainability initiatives is driving the demand for rCB, offering a promising future for its market.

Recovered Carbon Black Market Dynamics

Drivers

  • The increasing focus on sustainability in industries like automotive and manufacturing is pushing demand for rCB, as it serves as an eco-friendly alternative to virgin carbon black.

  • The global push towards circular economy practices, including the recycling of tires, enhances the availability and adoption of rCB in tire manufacturing and other applications​.

The recovered carbon black (rCB) market is driven by, the increased environmentally friendly focus of manufacturers and consumers, there is a substantial drive for more sustainable replacements within production methods. To address this, rCB has the potential to be a viable solution, as carbon black can be reused from waste tires and thus reintroduced into the production of recycled rubber products, decreasing waste and the dependence on virgin raw materials. This provides a more carbon footprint reduction to those industries which are highly dependent on carbon black.

For instance, the tire industry is increasingly adopting rCB in response to sustainability goals. By 2024, tire manufacturers in Europe are expected to use more than 30% recycled materials in tire production, a move supported by initiatives such as the European Union's Circular Economy Action Plan​. Additionally, companies like Scandinavian Enviro Systems have developed innovative technologies to recover up to 95% of carbon black from used tires, showcasing the advancements in recycling technologies​. The demand for sustainable rCB is also fueled by regulatory pressures. As an example, new tire regulatory rules implemented in 2022 by the European Commission established new requirements for waste tire management, encouraging increased recycling rates and the implementation of rCB, as a unique and necessary part of the recycling loop​. This shift aligns with broader sustainability trends, as industries strive for circular economy models and reduce their environmental impact.

Restraints

  • The lack of advanced technology for efficient rCB production limits its availability and quality compared to traditional carbon black​.

  • Despite the environmental benefits, the cost of recovered carbon black production is often higher than that of virgin carbon black, posing a challenge to widespread adoption.

High production cost is one of the primary restraints in the recovered carbon black (rCB) market. Due to the advanced technology and chemical process taken to harvest carbon black from waste sources i.e. used tires, the production of rCB heavily relied on rCB. Such processes usually require high-energy methods like pyrolysis and grinding, making operational costs higher than the production of virgin carbon black. This naturally drives up prices and limits the adoption of rCB products, particularly by price-sensitive industries. In addition, the infrastructure to process the waste materials and to produce high-quality rCB has yet to be established in many places, increasing costs. These differences in cost are prohibitive, aiding in preventing the recovery of carbon black from competing against traditional, but less eco-friendly options such as virgin carbon black, making it difficult for it to reach widespread implementation across various markets such as automotive or manufacturing.

Recovered Carbon Black Market Segmentation Analysis

By application

Tire manufacturing has been the most dominant segment in the recovered carbon black market, holding a market share of 72% in 2023. Tires represent the largest consumer of carbon black due to its essential role in enhancing the strength, durability, and performance of rubber compounds used in tires. Consequently, the tire manufacturing sector has been the single most driving sector for rCB demand. due to the increase in the production of automobiles along with the expansion of the automotive industry in developing countries such as India and China, the need for tires has also increased, which also adds to the consumption of recovered carbon black even in the production of tires. The global tire market is expected to grow at a steady pace in the forthcoming timeframe which will propel the carbon black demand. Due to growing use by tire manufacturers due to sustainability purposes, rCB is expected to remain on the rise.

The rubber segment is also projected to grow with the highest compound annual growth rate growth rate. One major factor behind this growth is government regulations encouraging the re-utilization of materials and decreasing carbon footprints. An example of a sustainability initiative for rubber was the European Union directive on End-of-Life Vehicles (ELV) that encourages higher recycling rates for automotive waste (such as tires) and thus, promotes demand for recycled carbon black in the rubber industry. As sustainable production takes center stage, the transition that will be critical for the rubber industry during the coming years includes replacement with recovered carbon black. With continued support for promoting the recycling of tire waste and other rubber products by the government is expected to sustain significant growth in this segment.

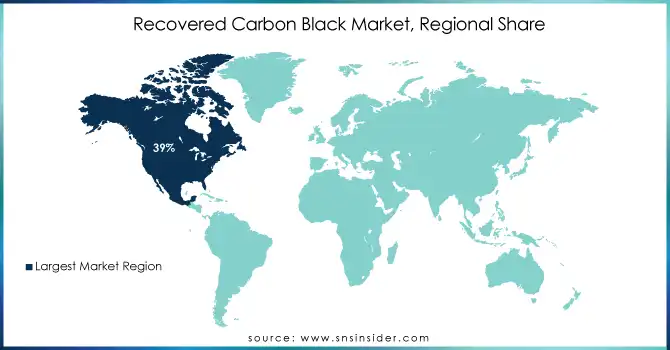
Recovered Carbon Black Market Regional Insights

North America dominated the market, with over 39% of the global recovered carbon black market share in 2023. Promoting recycling and sustainability has been largely driven by the U.S. Federal Government policy initiatives such as the EPA sustainable materials management program. As a result of these initiatives, there has been a noticeable rise in the adoption of reclaimed carbon black across various sectors such as automotive and manufacturing. Implementation of circular economy practices, along with an increasing understanding of environmental issues, has triggered massive investments in the recovered carbon black industry in North America.

The Asia Pacific (APAC) region is projected to be the fastest-growing market for recovered carbon black, with a compound annual growth rate (CAGR) from 2024 to 2032. The rCB demand in this region is mainly triggered by the fast-growing industries such as automotive manufacturing, especially in the nations like China and India, where the automotive industry is growing at an unparalleled pace. China National Tire & Rubber Corp told the CCAG that Chinese manufacturers exceeded 300 million tires of production in 2023 alone, and as China implements more stringent environmental policies there will be increasing interest in sustainable alternatives, including recovered carbon black. Moreover, government initiatives to improve recycling and decrease carbon emissions by regulated items like the 14th Five-Year Plan of Ecological and Environmental Protection will further enhance the market of rCB. The National Action Plan on Climate Change (NAPCC) by the Indian government is also encouraging the use of environmentally friendly practices in the manufacturing sectors including the automotive sector which will boost the market growth of recovered carbon black in the region.

Recovered-Carbon-Black-Market-Regional-Share

Do You Need any Customization Research on Recovered Carbon Black Market - Inquire Now

Key Players

Key Service Providers

  • Bolder Industries (BolderBlack, BolderInnovate)

  • Black Bear Carbon B.V. (Black Bear Carbon Black, Rubber Carbon Black)

  • Pyrolyx AG (Pyrolyx rCB, Pyrolyx Carbon Black)

  • Scandinavian Enviro Systems AB (Enviro, Ecoloop)

  • Radhe Group of Energy (Radhe Carbon Black, Radhe Pyrolysis Oil)

  • Delta-Energy Group (Delta Carbon Black, Delta Black™)

  • DVA Renewable Energy JSC (DVA rCB, DVA Black Products)

  • Alpha Carbone (Alpha Carbon Black, Alpha Tiers)

  • Integrated Resource Recovery (IRR Carbon, IRR Pyrolysis Carbon)

  • SR2O Holdings (SR2O Carbon, SR2O Pyrolyzed Carbon)

Key Users

  • Bridgestone Corporation

  • Goodyear Tire & Rubber Company

  • Michelin

  • Continental AG

  • Pirelli

  • Sumitomo Rubber Industries

  • Tire and Rubber Manufacturing Inc.

  • ExxonMobil Chemical

  • LANXESS

  • Cabot Corporation

Recent Developments

  • In February 2024, Michelin joined forces with Antin and Enviro to build the first plant dedicated to recycling end-of-life tires. The collaboration focuses on supplying used tires, recovered carbon black, and pyrolysis oil for the facility.

  • In March 2023, Enviro and Antin Infrastructure teamed up with Michelin to establish the world's first large-scale tire recycling facility. This initiative is expected to significantly boost the recovered carbon black market.

Recovered Carbon Black Market Report Scope:

Report Attributes Details
Market Size in 2023 USD 157.3 million 
Market Size by 2032 USD 1815.9 million 
CAGR CAGR of 31.3% From 2024 to 2032
Base Year 2023
Forecast Period 2024-2032
Historical Data 2020-2022
Report Scope & Coverage Market Size, Segments Analysis, Competitive  Landscape, Regional Analysis, DROC & SWOT Analysis, Forecast Outlook
Key Segments • By Application (Tires, Rubber, High-Performance Coatings, Plastics, Others
Regional Analysis/Coverage North America (US, Canada, Mexico), Europe (Eastern Europe [Poland, Romania, Hungary, Turkey, Rest of Eastern Europe] Western Europe] Germany, France, UK, Italy, Spain, Netherlands, Switzerland, Austria, Rest of Western Europe]), Asia Pacific (China, India, Japan, South Korea, Vietnam, Singapore, Australia, Rest of Asia Pacific), Middle East & Africa (Middle East [UAE, Egypt, Saudi Arabia, Qatar, Rest of Middle East], Africa [Nigeria, South Africa, Rest of Africa], Latin America (Brazil, Argentina, Colombia, Rest of Latin America)
Company Profiles Bolder Industries, Black Bear Carbon B.V., Pyrolyx AG, Scandinavian Enviro Systems AB, Radhe Group of Energy, Delta-Energy Group, DVA Renewable Energy JSC, Alpha Carbone, Integrated Resource Recovery, SR2O Holdings.
Key Drivers • The increasing focus on sustainability in industries like automotive and manufacturing is pushing demand for rCB, as it serves as an eco-friendly alternative to virgin carbon black.
• The global push towards circular economy practices, including the recycling of tires, enhances the availability and adoption of rCB in tire manufacturing and other applications.
Restraints • The lack of advanced technology for efficient rCB production limits its availability and quality compared to traditional carbon black.
• Despite the environmental benefits, the cost of recovered carbon black production is often higher than that of virgin carbon black, posing a challenge to widespread adoption.

Frequently Asked Questions

Ans. The projected market size for the Recovered Carbon Black Market is USD 1815.9 Million by 2032.

Ans: The North American region dominated the Recovered Carbon Black Market in 2023.

Ans. The CAGR of the Recovered Carbon Black Market is 31.3% During the forecast period of 2024-2032.

And: The tire application segment dominated the Recovered Carbon Black Market in 2023.

Ans:  

  • The increasing focus on sustainability in industries like automotive and manufacturing is pushing demand for rCB, as it serves as an eco-friendly alternative to virgin carbon black.
  • The global push towards circular economy practices, including the recycling of tires, enhances the availability and adoption of rCB in tire manufacturing and other applications.

Table of Contents:

1. Introduction

1.1 Market Definition

1.2 Scope (Inclusion and Exclusions)

1.3 Research Assumptions

2. Executive Summary

2.1 Market Overview

2.2 Regional Synopsis

2.3 Competitive Summary

3. Research Methodology

3.1 Top-Down Approach

3.2 Bottom-up Approach

3.3. Data Validation

3.4 Primary Interviews

4. Market Dynamics Impact Analysis

4.1 Market Driving Factors Analysis

4.1.1 Drivers

4.1.2 Restraints

4.1.3 Opportunities

4.1.4 Challenges

4.2 PESTLE Analysis

4.3 Porter’s Five Forces Model

5. Statistical Insights and Trends Reporting

5.1 Production Capacity and Utilization, by Country, by Type, 2023

5.2 Feedstock Prices, by Country, by Type, 2023

5.3 Regulatory Impact, by Country, by Type, 2023

5.4 Environmental Metrics: Emissions Data, Waste Management Practices, and Sustainability Initiatives, by Region

5.5 Innovation and R&D, by Type, 2023

6. Competitive Landscape

6.1 List of Major Companies, By Region

6.2 Market Share Analysis, By Region

6.3 Product Benchmarking

6.3.1 Product specifications and features

6.3.2 Pricing

6.4 Strategic Initiatives

6.4.1 Marketing and promotional activities

6.4.2 Distribution and Supply Chain Strategies

6.4.3 Expansion plans and new product launches

6.4.4 Strategic partnerships and collaborations

6.5 Technological Advancements

6.6 Market Positioning and Branding

7. Recovered Carbon Black Market Segmentation, By Application

     7.1 Chapter Overview

      7.2 Tires

             7.2.1 Tires Market Trends Analysis (2020-2032)

7.2.2 Tires Market Size Estimates and Forecasts to 2032 (USD Million)

      7.3 Rubber

             7.3.1 Rubber Market Trends Analysis (2020-2032)

7.3.2 Rubber Market Size Estimates and Forecasts to 2032 (USD Million)

        7.4 High Performance Coatings

        7.4.1 High-Performance Coatings Market Trends Analysis (2020-2032)

        7.4.2 High Performance Coatings Market Size Estimates and Forecasts to 2032 (USD Million)

     7.5 Plastics

        7.5.1 Plastics Market Trends Analysis (2020-2032)

         7.5.2 Plastics Market Size Estimates and Forecasts to 2032 (USD Million)

     7.6 Others

         7.6.1 Others Market Trends Analysis (2020-2032)

          7.6.2 Others Market Size Estimates and Forecasts to 2032 (USD Million)

8. Regional Analysis

8.1 Chapter Overview

8.2 North America

8.2.1 Trends Analysis

8.2.2 North America Recovered Carbon Black Market Estimates and Forecasts, by Country (2020-2032) (USD Million)

8.2.3 North America Recovered Carbon Black Market Estimates and Forecasts, by Application (2020-2032) (USD Million)  

8.2.2 USA

8.2.2.1 USA Recovered Carbon Black Market Estimates and Forecasts, by Application (2020-2032) (USD Million)

8.2.3 Canada

8.2.3.1 Canada Recovered Carbon Black Market Estimates and Forecasts, by Application (2020-2032) (USD Million)

8.2.4 Mexico

8.2.4.1 Mexico Recovered Carbon Black Market Estimates and Forecasts, by Application (2020-2032) (USD Million)

8.3 Europe

8.3.1 Eastern Europe

8.3.1.1 Trends Analysis

8.3.1.2 Eastern Europe Recovered Carbon Black Market Estimates and Forecasts, by Country (2020-2032) (USD Million)

8.3.1.3 Eastern Europe Recovered Carbon Black Market Estimates and Forecasts, by Application (2020-2032) (USD Million)  

8.3.1.4 Poland

8.3.1.4.1 Poland Recovered Carbon Black Market Estimates and Forecasts, by Application (2020-2032) (USD Million)

8.3.1.5 Romania

8.3.1.5.1 Romania Recovered Carbon Black Market Estimates and Forecasts, by Application (2020-2032) (USD Million)

8.3.1.6 Hungary

10.3.1.8.1 Hungary Recovered Carbon Black Market Estimates and Forecasts, by Application (2020-2032) (USD Million)

8.3.1.7 Turkey

8.3.1.7.1 Turkey Recovered Carbon Black Market Estimates and Forecasts, by Application (2020-2032) (USD Million)

8.3.1.8 Rest of Eastern Europe

8.3.1.8.1 Rest of Eastern Europe Recovered Carbon Black Market Estimates and Forecasts, by Application (2020-2032) (USD Million)

8.3.2 Western Europe

8.3.2.1 Trends Analysis

 8.3.2.2 Western Europe Recovered Carbon Black Market Estimates and Forecasts, by Country (2020-2032) (USD Million)

8.3.2.3 Western Europe Recovered Carbon Black Market Estimates and Forecasts, by Application (2020-2032) (USD Million)  

8.3.2.4 Germany

8.3.2.4.1 Germany Recovered Carbon Black Market Estimates and Forecasts, by Application (2020-2032) (USD Million)

8.3.2.5 France

8.3.2.5.1 France Recovered Carbon Black Market Estimates and Forecasts, by Application (2020-2032) (USD Million)

8.3.2.6 UK

8.3.2.6.1 UK Recovered Carbon Black Market Estimates and Forecasts, by Application (2020-2032) (USD Million)

8.3.2.7 Italy

8.3.2.7.1 Italy Recovered Carbon Black Market Estimates and Forecasts, by Application (2020-2032) (USD Million)

8.3.2.8 Spain

8.3.2.8.1 Spain Recovered Carbon Black Market Estimates and Forecasts, by Application (2020-2032) (USD Million)

8.3.2.9 Netherlands

8.3.2.9.1 Netherlands Recovered Carbon Black Market Estimates and Forecasts, by Application (2020-2032) (USD Million)

8.3.2.10 Switzerland

8.3.2.10.1 Switzerland Recovered Carbon Black Market Estimates and Forecasts, by Application (2020-2032) (USD Million)

8.3.2.11 Austria

8.3.2.11.1 Austria Recovered Carbon Black Market Estimates and Forecasts, by Application (2020-2032) (USD Million)

8.3.2.12 Rest of Western Europe

8.3.2.12.1 Rest of Western Europe Recovered Carbon Black Market Estimates and Forecasts, by Application (2020-2032) (USD Million)

8.4 Asia-Pacific

8.4.1 Trends Analysis

8.4.2 Asia-Pacific Recovered Carbon Black Market Estimates and Forecasts, by Country (2020-2032) (USD Million)

8.4.3 Asia-Pacific Recovered Carbon Black Market Estimates and Forecasts, by Application (2020-2032) (USD Million)  

8.4.4 China

8.4.4.1 China Recovered Carbon Black Market Estimates and Forecasts, by Application (2020-2032) (USD Million)

8.4.5 India

8.4.5.1 India Recovered Carbon Black Market Estimates and Forecasts, by Application (2020-2032) (USD Million)

8.4.6 Japan

8.4.6.1 Japan Recovered Carbon Black Market Estimates and Forecasts, by Application (2020-2032) (USD Million)

8.4.7 South Korea

8.4.7.1 South Korea Recovered Carbon Black Market Estimates and Forecasts, by Application (2020-2032) (USD Million)

8.4.8 Vietnam

8.4.8.1 Vietnam Recovered Carbon Black Market Estimates and Forecasts, by Application (2020-2032) (USD Million)

8.4.9 Singapore

8.4.9.1 Singapore Recovered Carbon Black Market Estimates and Forecasts, by Application (2020-2032) (USD Million)

8.4.10 Australia

8.4.10.1 Australia Recovered Carbon Black Market Estimates and Forecasts, by Application (2020-2032) (USD Million)

8.4.11 Rest of Asia-Pacific

8.4.11.1 Rest of Asia-Pacific Recovered Carbon Black Market Estimates and Forecasts, by Application (2020-2032) (USD Million)

8.5 Middle East and Africa

8.5.1 Middle East

8.5.1.1 Trends Analysis

8.5.1.2 Middle East Recovered Carbon Black Market Estimates and Forecasts, by Country (2020-2032) (USD Million)

10.5.1.3 Middle East Recovered Carbon Black Market Estimates and Forecasts, by Application (2020-2032) (USD Million)  

8.5.1.4 UAE

8.5.1.4.1 UAE Recovered Carbon Black Market Estimates and Forecasts, by Application (2020-2032) (USD Million)

8.5.1.5 Egypt

8.5.1.5.1 Egypt Recovered Carbon Black Market Estimates and Forecasts, by Application (2020-2032) (USD Million)

8.5.1.6 Saudi Arabia

8.5.1.6.1 Saudi Arabia Recovered Carbon Black Market Estimates and Forecasts, by Application (2020-2032) (USD Million)

8.5.1.7 Qatar

8.5.1.7.1 Qatar Recovered Carbon Black Market Estimates and Forecasts, by Application (2020-2032) (USD Million)

8.5.1.8 Rest of Middle East

8.5.1.8.1 Rest of Middle East Recovered Carbon Black Market Estimates and Forecasts, by Application (2020-2032) (USD Million)

8.5.2 Africa

8.5.2.1 Trends Analysis

8.5.2.2 Africa Recovered Carbon Black Market Estimates and Forecasts, by Country (2020-2032) (USD Million)

8.5.2.3 Africa Recovered Carbon Black Market Estimates and Forecasts, by Application (2020-2032) (USD Million)  

8.5.2.4 South Africa

8.5.2.4.1 South Africa Recovered Carbon Black Market Estimates and Forecasts, by Application (2020-2032) (USD Million)

8.5.2.5 Nigeria

8.5.2.5.1 Nigeria Recovered Carbon Black Market Estimates and Forecasts, by Application (2020-2032) (USD Million)

8.5.2.6 Rest of Africa

8.5.2.6.1 Rest of Africa Recovered Carbon Black Market Estimates and Forecasts, by Application (2020-2032) (USD Million)

8.6 Latin America

8.6.1 Trends Analysis

8.6.2 Latin America Recovered Carbon Black Market Estimates and Forecasts, by Country (2020-2032) (USD Million)

8.6.3 Latin America Recovered Carbon Black Market Estimates and Forecasts, by Application (2020-2032) (USD Million)  

8.6.4 Brazil

8.6.4.1 Brazil Recovered Carbon Black Market Estimates and Forecasts, by Application (2020-2032) (USD Million)

8.6.5 Argentina

8.6.5.1 Argentina Recovered Carbon Black Market Estimates and Forecasts, by Application (2020-2032) (USD Million)

8.6.6 Colombia

8.6.6.1 Colombia Recovered Carbon Black Market Estimates and Forecasts, by Application (2020-2032) (USD Million)

8.6.7 Rest of Latin America

8.6.7.1 Rest of Latin America Recovered Carbon Black Market Estimates and Forecasts, by Application (2020-2032) (USD Million)

9. Company Profiles

9.1 Bolder Industries

9.1.1 Company Overview

9.1.2 Financial

9.1.3 Products/ Services Offered

9.1.4 SWOT Analysis

9.2 Black Bear Carbon B.V.

9.2.1 Company Overview

9.2.2 Financial

9.2.3 Products/ Services Offered

9.2.4 SWOT Analysis

9.3 Pyrolyx AG

9.3.1 Company Overview

9.3.2 Financial

9.3.3 Products/ Services Offered

9.3.4 SWOT Analysis

9.4 Scandinavian Enviro Systems AB

9.4.1 Company Overview

9.4.2 Financial

9.4.3 Products/ Services Offered

9.4.4 SWOT Analysis

9.5 Radhe Group of Energy

9.5.1 Company Overview

9.5.2 Financial

9.5.3 Products/ Services Offered

9.5.4 SWOT Analysis

9.6 Delta-Energy Group

9.6.1 Company Overview

9.6.2 Financial

9.6.3 Products/ Services Offered

9.6.4 SWOT Analysis

9.7 DVA Renewable Energy JSC

9.7.1 Company Overview

9.7.2 Financial

9.7.3 Products/ Services Offered

9.7.4 SWOT Analysis

9.8 Alpha Carbone

9.8.1 Company Overview

9.8.2 Financial

9.8.3 Products/ Services Offered

9.8.4 SWOT Analysis

9.9 Integrated Resource Recovery

9.9.1 Company Overview

9.9.2 Financial

9.9.3 Products/ Services Offered

9.9.4 SWOT Analysis

9.10 SR2O Holdings.

9.10.1 Company Overview

9.10.2 Financial

9.10.3 Products/ Services Offered

9.10.4 SWOT Analysis

10. Use Cases and Best Practices

11. Conclusion

An accurate research report requires proper strategizing as well as implementation. There are multiple factors involved in the completion of good and accurate research report and selecting the best methodology to compete the research is the toughest part. Since the research reports we provide play a crucial role in any company’s decision-making process, therefore we at SNS Insider always believe that we should choose the best method which gives us results closer to reality. This allows us to reach at a stage wherein we can provide our clients best and accurate investment to output ratio.

Each report that we prepare takes a timeframe of 350-400 business hours for production. Starting from the selection of titles through a couple of in-depth brain storming session to the final QC process before uploading our titles on our website we dedicate around 350 working hours. The titles are selected based on their current market cap and the foreseen CAGR and growth.


The 5 steps process:

Step 1: Secondary Research:

Secondary Research or Desk Research is as the name suggests is a research process wherein, we collect data through the readily available information. In this process we use various paid and unpaid databases which our team has access to and gather data through the same. This includes examining of listed companies’ annual reports, Journals, SEC filling etc. Apart from this our team has access to various associations across the globe across different industries. Lastly, we have exchange relationships with various university as well as individual libraries.

Secondary Research

Step 2: Primary Research

When we talk about primary research, it is a type of study in which the researchers collect relevant data samples directly, rather than relying on previously collected data.  This type of research is focused on gaining content specific facts that can be sued to solve specific problems. Since the collected data is fresh and first hand therefore it makes the study more accurate and genuine.

We at SNS Insider have divided Primary Research into 2 parts.

Part 1 wherein we interview the KOLs of major players as well as the upcoming ones across various geographic regions. This allows us to have their view over the market scenario and acts as an important tool to come closer to the accurate market numbers. As many as 45 paid and unpaid primary interviews are taken from both the demand and supply side of the industry to make sure we land at an accurate judgement and analysis of the market.

This step involves the triangulation of data wherein our team analyses the interview transcripts, online survey responses and observation of on filed participants. The below mentioned chart should give a better understanding of the part 1 of the primary interview.

Primary Research

Part 2: In this part of primary research the data collected via secondary research and the part 1 of the primary research is validated with the interviews from individual consultants and subject matter experts.

Consultants are those set of people who have at least 12 years of experience and expertise within the industry whereas Subject Matter Experts are those with at least 15 years of experience behind their back within the same space. The data with the help of two main processes i.e., FGDs (Focused Group Discussions) and IDs (Individual Discussions). This gives us a 3rd party nonbiased primary view of the market scenario making it a more dependable one while collation of the data pointers.

Step 3: Data Bank Validation

Once all the information is collected via primary and secondary sources, we run that information for data validation. At our intelligence centre our research heads track a lot of information related to the market which includes the quarterly reports, the daily stock prices, and other relevant information. Our data bank server gets updated every fortnight and that is how the information which we collected using our primary and secondary information is revalidated in real time.

Data Bank Validation

Step 4: QA/QC Process

After all the data collection and validation our team does a final level of quality check and quality assurance to get rid of any unwanted or undesired mistakes. This might include but not limited to getting rid of the any typos, duplication of numbers or missing of any important information. The people involved in this process include technical content writers, research heads and graphics people. Once this process is completed the title gets uploader on our platform for our clients to read it.

Step 5: Final QC/QA Process:

This is the last process and comes when the client has ordered the study. In this process a final QA/QC is done before the study is emailed to the client. Since we believe in giving our clients a good experience of our research studies, therefore, to make sure that we do not lack at our end in any way humanly possible we do a final round of quality check and then dispatch the study to the client.

Key Segmentation

By Application

  • Tires

  • Rubber

  • High Performance Coatings

  • Plastics

  • Others

Request for Segment Customization as per your Business Requirement: Segment Customization Request

REGIONAL COVERAGE:

North America

  • US

  • Canada

  • Mexico

Europe

  • Eastern Europe

    • Poland

    • Romania

    • Hungary

    • Turkey

    • Rest of Eastern Europe

  • Western Europe

    • Germany

    • France

    • UK

    • Italy

    • Spain

    • Netherlands

    • Switzerland

    • Austria

    • Rest of Western Europe

Asia Pacific

  • China

  • India

  • Japan

  • South Korea

  • Vietnam

  • Singapore

  • Australia

  • Rest of Asia Pacific

Middle East & Africa

  • Middle East

    • UAE

    • Egypt

    • Saudi Arabia

    • Qatar

    • Rest of the Middle East

  • Africa

    • Nigeria

    • South Africa

    • Rest of Africa

Latin America

  • Brazil

  • Argentina

  • Colombia

  • Rest of Latin America

Request for Country Level Research Report: Country Level Customization Request

Available Customization

With the given market data, SNS Insider offers customization as per the company’s specific needs. The following customization options are available for the report:

  • Product Analysis

    •   Criss-Cross segment analysis (e.g. Product X Application)

  • Product Matrix which gives a detailed comparison of product portfolio of each company

  • Geographic Analysis

  • Additional countries in any of the regions

  • Company Information

  • Detailed analysis and profiling of additional market players (Up to five)


  •            5000 (33% Discount)


  •            8950 (40% Discount)


  •            3050 (23% Discount)

Start a Conversation

Hi! Click one of our member below to chat on Phone