Suppression Capacitors Market Size Analysis:
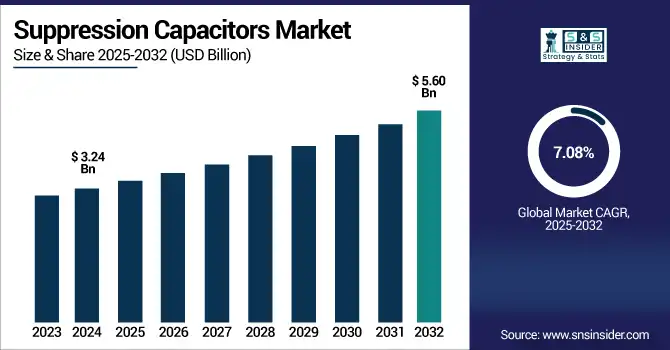
The Suppression Capacitors Market size was valued at USD 3.24 Billion in 2024 and is projected to reach USD 5.60 Billion by 2032, growing at a CAGR of 7.08% during 2025-2032.
To Get more information on Suppression-Capacitors-Market- Request Free Sample Report
The suppression capacitors market is witnessing steady growth driven by the increasing need for electromagnetic interference (EMI) and radio frequency interference (RFI) suppression of electronic systems. These capacitors play an important role in meeting stringent regulatory requirements as well as improving equipment reliability / durability. The market is fueled by the growth of automotive electronics, industrial automation, consumer gadgets, and renewable energy infrastructure. This is driving the growth of power electronics adoption as EVs, solar inverters, and smart appliances become increasingly integrated. The rising awareness regarding the electrical noise attenuation & circuit protection is further increasing the demand for EMI Filters in both AC & DC applications. Especially in especially harsh operating environments, long-term reliability and performance are further ensured by advances in high temperature, high voltage capacitors.
Panasonic’s ZV series hybrid capacitors, now available via TTI Europe, offer 50% higher ripple current and ultra-low ESR, ideal for demanding automotive and power electronics applications.
The U.S Suppression Capacitors Market size was valued at USD 0.58 Billion in 2024 and is projected to reach USD 1.05 Billion by 2032, growing at a CAGR of 7.71% during 2025-2032. Suppression Capacitors Market growth is mainly attributed to the increasing demand for EMI/RFI filtering in electric vehicles, industrial automation, and renewable energy systems, as well as the increasing adoption of high reliability, temperature- and vibration-resisting capacitor technologies in modern electronic applications.
Suppression Capacitors Market trends include rise in high-temperature, vibration-resistant designs that are well-suited for harsh environments, increasing use in ADAS and EV power electronics, and compact, low-ESR, components engineered for fast response time for next-gen automotive and energy infrastructure.
Suppression Capacitors Market Dynamics:
Drivers:
-
Rising EMI Challenges Fuel Demand for Advanced Suppression Capacitor Solutions
The growing need for compact and high-performance electronic systems is a major factor driving the Suppression Capacitors Market. As industries push toward miniaturized devices with increased functionality, managing electromagnetic interference (EMI) without adding bulk or complexity becomes essential. Suppression capacitors play a vital role in enhancing circuit reliability by filtering noise, maintaining power integrity, and ensuring compliance with EMI standards. This demand is particularly strong in sectors like electric vehicles, renewable energy, medical electronics, and industrial automation, where space-saving, thermally stable, and vibration-resistant solutions are increasingly critical.
Murata's L Cancel Transformer (LCT), introduced in May 2024, takes the next step in power supply noise prevention by removing capacitor ESL while simultaneously reducing component count and improving EMI filtering from MHz to GHz.
Restraints:
-
Harsh Operating Conditions Lead to Reliability and Integration Barriers in Suppression Capacitor Deployment
The Suppression Capacitors Market faces significant restraints driven by reliability concerns under harsh operating conditions. Automotive and other industrial environments expose capacitors to high temperatures, voltage shocks, and mechanical stress that can reduce their life and degrade performance. This requires high quality materials and sophisticated designs that only drive production costs up, making them undesirable in cost-sensitive applications. Moreover, expansion issues like volume restrictions, mounting compatibility, and absence of common standards further complicate the work for designers to implement suppression capacitors on varying platforms. In fast-moving fields such as EVs and smart electronics, where space, thermal management and cost control are key, these technical hurdles and life-time reliability issues are a growth barrier.
Opportunities:
-
Surge in RF System Complexity Drives Demand for Advanced Suppression Capacitor Solutions
The increasing complexity and miniaturization of high-frequency RF systems is creating significant growth opportunities in the Suppression Capacitors Market. With the higher integration of RF components on a smaller footprint, EMI/RFI suppression has an urgent demand. As a result, suppression capacitors that are not only stable over temperature and frequency but also impervious to hostile environmental stressors, and of low ESL, are strategically more important now than ever before. This trend creates a demand for next-gen capacitors in mobile infrastructure, connected vehicles, satellite systems, and IoT networks that require high signal integrity while also being space efficient.
On July 1, 2025 KYOCERA AVX launched its new ultra-reliable DB0402 3dB 90° hybrid couplers to provide compact and efficient RF solutions for 5G, 6G, SATCOM and GPS applications
Challenges:
-
Miniaturization Pressure and Cost Sensitivity Limit Suppression Capacitor Deployment
The Suppression Capacitors market is challenged by increasing demands for miniaturization and cost efficiency, particularly in compact consumer electronics and next-gen automotive platforms. While the active devices are getting smaller and the number of devices inside a circuit is getting higher, EMI/RFI suppression is a key part of any design and is one of the last things that would be desired to be integrated more efficiently into a design without taking up a lot of board space or impacting thermal performance. At the same time, high price sensitivity especially for mass-produced electronics limits the degree to which higher-grade or custom-designed suppression capacitors are used. This lands manufacturers in a position where they have to pick between performance and cost. Moreover, this presents design and reliability challenges in being able to contain high-frequency noise and maintain high durability in the limited space provided by PCB. Such issues prevent high-volume adoption of suppression capacitors in next generation applications and demand novel forms, materials, and low-cost integration methods.
Suppression Capacitors Market Segmentation Analysis:
By Type
In 2024, the Ceramic Capacitors segment accounted for approximately 38% of the Suppression Capacitor market share, driven by their excellent high-frequency noise filtering, small size, and low-cost compared to other types of suppression capacitor products. Segment dominance was aided by their increasing usage in consumer electronics, automotive electronics, and industrial equipment. The growing need for miniaturized devices with stable electrical performance drove the use of ceramic capacitors to be the primary component for EMI/RFI suppression in applications surrounding the globe.
The Tantalum Capacitors segment is expected to experience the fastest growth in Suppression Capacitor market over 2025-2032 with a CAGR of 8.14%, driven by their stable electrical performance, longer life, and compact high capacitance compared with ceramic capacitor or aluminum electrolytic capacitor characteristic, through the technology already reach high maturity; mainly used for automotive, aerospace, and telecom applications. These components further lend themselves to be adopted in critical systems owing to their relatively high reliance.
By Application
In 2024, the Consumer Electronics segment accounted for approximately 34% of the Suppression Capacitor market share, owing to high demand for compact, energy-efficient electronic devices including smartphones, tablets, consumer wearables, smart home appliances etc. Recent trends like device miniaturization and the requirement to control EMI noise are fast propelling the rapid acceptance of suppression capacitors in the industry.
The Automotive segment is expected to experience the fastest growth in Suppression Capacitor market over 2025-2032 with a CAGR of 9.50%, This growth is fueled by the rapid adoption of electric vehicles (EVs), advanced driver-assistance systems (ADAS), and infotainment systems, all of which require robust EMI/RFI suppression. The shift toward electrification and connected mobility further boosts demand for high-reliability suppression capacitors.
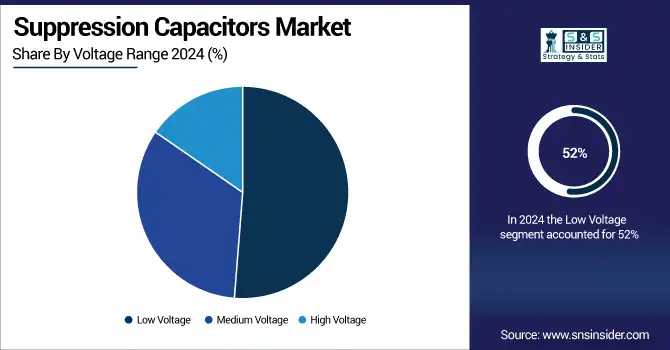
By Voltage Range
In 2024, the Low Voltage segment accounted for approximately 52% of the Suppression Capacitor market share, driven by widespread applications in consumer electronics, LED lighting, and portable devices. These applications typically operate below 100V and require compact, cost-effective EMI/RFI suppression components, making low-voltage capacitors the preferred choice for mass-market, energy-efficient electronics across residential and commercial environments.
The Automotive segment is expected to experience the fastest growth in Suppression Capacitor market over 2025-2032 with a CAGR of 8.91%, driven by the increasing adoption of EVs, ADAS, infotainment system, and onboard power electronics, to provide significant charge fitness in EV. The rising EMI concerns from high voltage automotive platforms are fast-tracking the need for high capacitance suppression capacitors for signal integrity, safety, and regulatory compliance in next generation vehicles.
By End –User
In 2024, the Industrial segment accounted for approximately 41% of the Suppression Capacitor market share, is expected to experience the fastest growth in Suppression Capacitor over 2025-2032 with a CAGR of 8.70%. This expansion is driven by the rapid adoption of automation, Industry 4.0 technologies, and the growing deployment of advanced machinery that requires effective electromagnetic interference (EMI) suppression. The rising demand for robust, high-reliability components in harsh operating conditions across manufacturing, energy, and heavy equipment sectors is further accelerating segment growth.
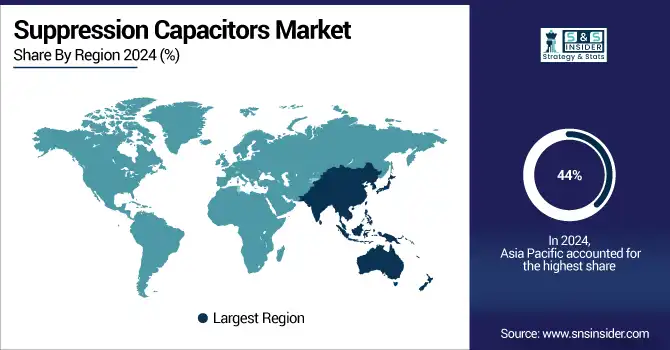
Suppression Capacitors Market Regional Analysis:
In 2024, Asia Pacific dominated the Suppression Capacitor market and accounted for 44% of revenue share, owing to strong electronics manufacturing ecosystem, increasing automotive production in the region and growing acceptance towards consumer electronics in the region. The growth of the market is still driven by government initiatives to promote industrial growth and a steady demand from China, Japan, South Korea, and India. Moreover, the growing adoption of EMI suppression solutions in 5G infrastructure and electric vehicles will strengthen the leadership of Asia Pacific in the global market.
North America is expected to witness the fastest growth in the Suppression Capacitor market over 2025-2032, with a projected CAGR of 8.75%, This growth is fueled by increasing adoption of EVs, industrial automation, and advanced consumer electronics. Rising investments in renewable energy infrastructure and stringent EMI/EMC regulations further drive demand. Additionally, the presence of key tech players and ongoing R&D initiatives enhance regional market development.
In 2024, Europe in 2024 is the region with a well-sustained Suppression Capacitor market with strong developments in automotive electronics, industrial automation, and energy-saving technologies. Stringent regulatory frameworks for electromagnetic compliance and rising demand for renewable energy systems is likely to augment demand in this region. Moreover, the integration of Europe in this report includes countries such as Germany and France where the adoption is on the rise, owing to the presence of strong manufacture base along with supportive policies are expected to contribute towards driven Acoustics Markets in Europe during the forecasting period.
LATAM and MEA are experiencing steady growth in the Suppression Capacitor market, supported by expanding industrialization, infrastructure development, and rising adoption of automotive and consumer electronics. Increasing investments in renewable energy projects and government initiatives to improve electrical grid reliability are also driving demand. Although market penetration is lower compared to mature regions, growing awareness of EMI compliance and the need for robust suppression solutions are fueling gradual market expansion in these emerging economies.
Get Customized Report as per Your Business Requirement - Enquiry Now
Suppression Capacitors Companies are:
The Key Players in Suppression Capacitor market are Murata Manufacturing Co., Ltd., KEMET Corporation, TDK Corporation, AVX Corporation, Panasonic Corporation, Vishay Intertechnology, Inc., Würth Elektronik Group, Nichicon Corporation, Yageo Corporation, EPCOS AG (a TDK Group Company), Rubycon Corporation, Cornell Dubilier Electronics, Inc., TE Connectivity Ltd., KOA Speer Electronics, Inc., Xiamen Faratronic Co., Ltd., WIMA GmbH & Co. KG, Kendeil S.r.l., CapXon International Electronic Co., Ltd., Hitachi AIC Inc., Nippon Chemi-Con Corporation and Others.
Recent Developments:
-
On February 11, 2025, TDK launched the compact EPCOS B3292xM3/N3 X2 EMI suppression capacitors, featuring a 20% size reduction and enhanced humidity resistance, ideal for automotive on-board chargers and industrial power systems. These capacitors offer high reliability with AEC-Q200 compliance and operate in harsh environments up to +110 °C.
| Report Attributes | Details |
|---|---|
| Market Size in 2024 | USD 3.24 Billion |
| Market Size by 2032 | USD 5.60 Billion |
| CAGR | CAGR of 7.08% From 2024 to 2032 |
| Base Year | 2024 |
| Forecast Period | 2025-2032 |
| Historical Data | 2021-2023 |
| Report Scope & Coverage | Market Size, Segments Analysis, Competitive Landscape, Regional Analysis, DROC & SWOT Analysis, Forecast Outlook |
| Key Segments | • By Type(Ceramic Capacitors, Film Capacitors and Aluminum Electrolytic Capacitors, Tantalum Capacitors and Others) • By Application(Consumer Electronics, Automotive, Industrial, Telecommunications and Others) • By Voltage Range (Low Voltage, Medium Voltage, High Voltage) • By End -User (Residential, Commercial and Industrial) |
| Regional Analysis/Coverage | North America (US, Canada), Europe (Germany, UK, France, Italy, Spain, Russia, Poland, Rest of Europe), Asia Pacific (China, India, Japan, South Korea, Australia, ASEAN Countries, Rest of Asia Pacific), Middle East & Africa (UAE, Saudi Arabia, Qatar, South Africa, Rest of Middle East & Africa), Latin America (Brazil, Argentina, Mexico, Colombia, Rest of Latin America). |
| Company Profiles | The Suppression Capacitor market Companies are Murata Manufacturing Co., Ltd., KEMET Corporation, TDK Corporation, AVX Corporation, Panasonic Corporation, Vishay Intertechnology, Inc., Würth Elektronik Group, Nichicon Corporation, Yageo Corporation, EPCOS AG (a TDK Group Company), Rubycon Corporation, Cornell Dubilier Electronics, Inc., TE Connectivity Ltd., KOA Speer Electronics, Inc., Xiamen Faratronic Co., Ltd., WIMA GmbH & Co. KG, Kendeil S.r.l., CapXon International Electronic Co., Ltd., Hitachi AIC Inc., Nippon Chemi-Con Corporation and Others. |
Frequently Asked Questions
Asia-Pacific dominated the Suppression Capacitors Market in 2024.
The “Ceramic Capacitors” segment dominated the Suppression Capacitors Market
Rising demand for advanced semiconductor nodes and increased adoption of IoT, AI, and 5G technologies are key drivers of the Suppression Capacitors market.
The Suppression Capacitors Market size was valued at USD 3.24 Billion in 2024 and is projected to reach USD 5.60 Billion by 2032
The Suppression Capacitors Market is expected to grow at a CAGR of 7.08% during 2025-2032.
Get in Touch
