IoT in Retail Market Report Scope & Overview:

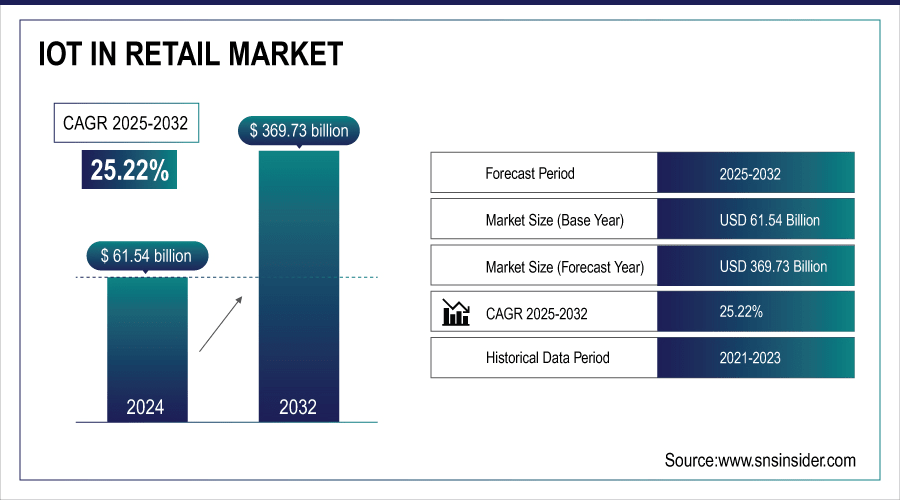
IoT in Retail Market was valued at USD 61.54 billion in 2024 and is expected to reach USD 369.73 billion by 2032, growing at a CAGR of 25.22% from 2025-2032. 

The growth of the IoT in Retail Market is driven by increasing adoption of connected devices for inventory management, real-time analytics, and personalized customer experiences. Rising demand for smart shelves, RFID technology, and automated checkout systems enhances operational efficiency. Additionally, the expansion of e-commerce, digital payment integration, and advanced supply chain monitoring fuels market growth across retail sectors.

According to the U.S. Census Bureau of the Department of Commerce, in the second quarter of 2025, U.S. retail e-commerce sales reached USD 304.2 billion, marking a 1.4% increase from the previous quarter, with e-commerce accounting for 16.3% of total retail sales.

The U.S. Census Bureau's "Tech Stats" initiative further centralizes data collections and research products that focus on technology's impact on the economy, including advancements in supply chain monitoring and predictive analytics.

Key IoT in Retail Market Trends

  • Growing adoption of IoT for inventory management, supply chain optimization, and smart shelves.

  • Integration with AI and analytics is enabling personalized customer experiences and predictive insights.

  • Use of IoT-enabled sensors and beacons is enhancing in-store engagement and operational efficiency.

  • Rising demand for contactless payments, smart checkout, and automated retail processes is driving growth.

  • Cloud-based IoT platforms are supporting scalable, real-time data monitoring and decision-making.

  • Retailers are leveraging IoT for energy management, asset tracking, and loss prevention.

  • Expansion of omnichannel retail and smart store concepts is accelerating IoT adoption.

U.S. IoT in Retail Market was valued at USD 15.15 billion in 2024 and is expected to reach USD 89.37 billion by 2032, growing at a CAGR of 24.83% from 2025-2032. 

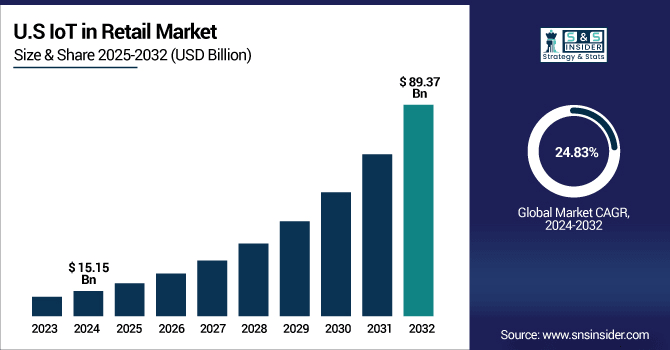
The U.S. IoT in Retail Market is growing due to increased adoption of smart devices for inventory tracking, personalized shopping experiences, automated checkouts, and advanced analytics, alongside rising e-commerce demand and digital payment integration driving operational efficiency and customer engagement.

IoT in Retail Market Growth Drivers:

  • Rising demand for personalized shopping experiences through real-time data analytics, smart shelves, and connected devices in retail environments

Rising demand for personalized shopping experiences through IoT-powered analytics is transforming retail by enabling businesses to understand consumer behavior in real time. Smart shelves, RFID tags, and connected devices help retailers track inventory, monitor customer preferences, and deliver tailored recommendations. This data-driven personalization improves customer satisfaction, enhances brand loyalty, and drives repeat purchases. Retailers can offer dynamic promotions, adjust pricing instantly, and optimize in-store product placement. With e-commerce competition intensifying, physical stores must leverage IoT to remain competitive by merging convenience with customization. This growing emphasis on personalized experiences remains a significant driver for IoT adoption in retail markets globally.

IoT in Retail Market Restraints:

  • Data privacy concerns and security vulnerabilities pose serious limitations to IoT adoption in retail, creating risks around consumer trust and regulatory compliance

Data privacy concerns significantly restrain IoT growth in retail due to the sensitive nature of consumer information collected through connected devices. Security vulnerabilities in IoT systems can expose retailers to risks such as hacking, identity theft, and data breaches. Consumers are increasingly cautious about sharing personal data, and any breach can damage trust and brand reputation. Additionally, retailers face strict regulatory requirements related to data protection, compliance, and cybersecurity. Failure to meet these standards can lead to legal penalties and financial losses. These challenges make retailers hesitant to adopt IoT technologies fully, thereby limiting the market’s growth potential.

IoT in Retail Market Opportunities:

  • Growing adoption of smart checkout systems and contactless payment solutions enhances customer convenience and drives IoT expansion in retail stores worldwide

Growing adoption of smart checkout systems presents a major opportunity for IoT in retail, as customers increasingly demand faster and seamless shopping experiences. IoT-enabled solutions such as cashier-less checkout, RFID-powered billing, and mobile payment systems minimize waiting times while improving customer convenience. Retailers benefit from reduced operational costs, higher throughput, and enhanced customer satisfaction. The rise of contactless payment adoption during the pandemic accelerated this trend, and retailers continue to invest heavily in digital-first in-store experiences. As consumer preferences evolve toward speed and efficiency, IoT-driven smart checkout systems provide a strong growth opportunity to reshape the future of retail operations.

  • The U.S. Department of the Treasury has mandated that, beginning September 30, 2025, all federal payments including Social Security benefits, tax refunds, and vendor payments will be made electronically, eliminating paper checks. This shift aims to reduce fraud risks associated with paper-based payments.

IoT in Retail Market Segment Highlights

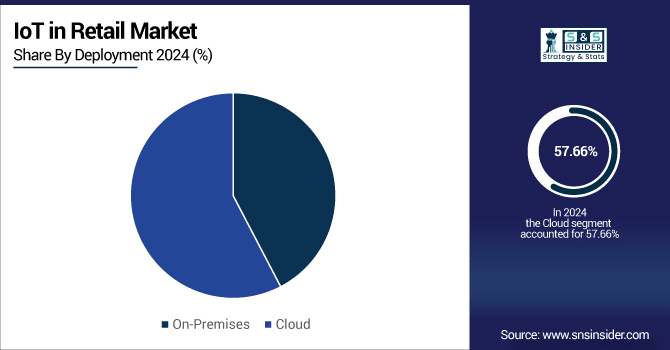
  • By Deployment, Cloud dominated with ~42% share in 2024; On-Premises fastest growing (CAGR 26.56%).

  • By Application, Operations Management dominated with ~33% share in 2024; Customer Management fastest growing (CAGR 27.58%).

  • By Connectivity, Near Field Communication dominated with ~35% share in 2024; Bluetooth Low Energy fastest growing (CAGR 27.18%).

  • By Component, Hardware dominated with ~47% share in 2024; Platform fastest growing (CAGR 27.88%).

IoT in Retail Market Segment Analysis

  • By Deployment, Cloud led while On-Premises is expected to grow fastest

Cloud segment dominated the IoT in Retail Market in 2024 with the highest revenue share due to its scalability, cost efficiency, and ease of deployment. Retailers increasingly rely on cloud-based IoT for real-time analytics, remote monitoring, and seamless integration, enabling faster innovation and greater flexibility across multi-location retail operations.

On-Premises segment is expected to grow at the fastest CAGR from 2025–2032 as retailers seek greater data security, regulatory compliance, and control over infrastructure. Sensitive customer information and operational data management needs drive preference for on-premises models, particularly among enterprises handling critical workloads and aiming for customized IoT solutions.

  • By Application, Operations Management dominated while Customer Management is projected to expand fastest

Operations Management segment dominated the IoT in Retail Market in 2024 with the highest revenue share as retailers prioritize process automation, workforce efficiency, and resource optimization. IoT enables real-time monitoring of operations, streamlined workflows, and cost reduction, making operations management central to retail digital transformation strategies worldwide.

Customer Management segment is expected to grow at the fastest CAGR from 2025–2032 driven by increasing demand for personalized shopping experiences, targeted promotions, and loyalty programs. IoT technologies such as beacons, smart shelves, and connected applications enable retailers to track consumer behavior and enhance engagement across multiple touchpoints.

  • By Technology, Near Field Communication led while Bluetooth Low Energy is expected to grow fastest

Near Field Communication segment dominated the IoT in Retail Market in 2024 with the highest revenue share due to its role in enabling contactless payments and secure transactions. Retailers widely adopted NFC for enhancing checkout speed, improving customer convenience, and integrating loyalty systems seamlessly with mobile devices.

Bluetooth Low Energy segment is expected to grow at the fastest CAGR from 2025–2032 as retailers increasingly deploy it for in-store navigation, proximity marketing, and personalized promotions. Its low energy consumption and cost-effectiveness make it ideal for enhancing customer engagement through location-based services within retail environments.

  • By Component, Hardware dominated while Platform is projected to grow fastest

Hardware segment dominated the IoT in Retail Market in 2024 with the highest revenue share due to the essential role of sensors, RFID tags, beacons, and devices in enabling IoT ecosystems. Hardware remains the backbone for data collection, real-time monitoring, and connectivity within retail operations globally.

Platform segment is expected to grow at the fastest CAGR from 2025–2032 as retailers increasingly adopt IoT platforms for centralized data integration, predictive analytics, and scalable connectivity management. Platforms help unify diverse IoT systems, offering actionable insights and supporting the shift toward data-driven retail transformation strategies.

IoT in Retail Market Regional Highlights

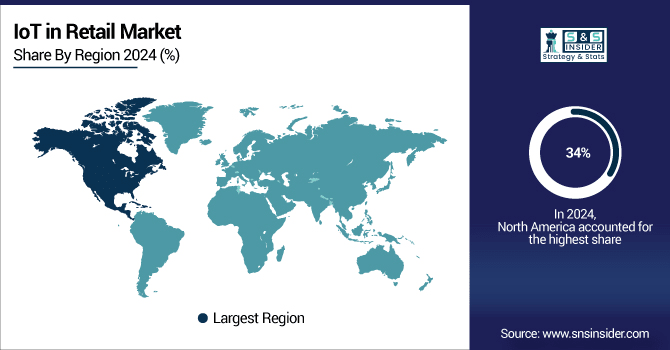
  • By Region, North America dominated with ~34% share in 2024; Asia Pacific fastest growing (CAGR 27.41%).

IoT in Retail Market Regional Analysis

North America IoT in Retail Market Insights

North America dominated the IoT in Retail Market in 2024 with the highest revenue share due to strong technological infrastructure, early adoption of digital solutions, and widespread presence of major retail chains. Retailers in the region leverage IoT for advanced analytics, inventory automation, and personalized shopping experiences, supported by high consumer demand for convenience and integration of innovative retail technologies.

Asia Pacific IoT in Retail Market Insights

Asia Pacific is expected to grow at the fastest CAGR from 2025–2032 driven by rapid urbanization, expanding retail ecosystems, and increasing smartphone and internet penetration. Rising consumer expectations for personalized, tech-driven shopping experiences and government initiatives promoting digital transformation further fuel IoT adoption. Emerging economies in the region are investing heavily in connected retail infrastructure, driving strong market growth momentum.

Europe IoT in Retail Market Insights

Europe holds a significant position in the IoT in Retail Market, supported by strong regulatory frameworks, advanced retail infrastructure, and growing consumer demand for digital shopping experiences. Retailers in the region increasingly adopt IoT solutions for supply chain optimization, smart payment systems, and customer engagement. Sustainability-focused initiatives and investment in smart stores further accelerate IoT adoption across European retail markets.

Middle East & Africa and Latin America IoT in Retail Market Insights

Middle East & Africa and Latin America are experiencing steady growth in the IoT in Retail Market, driven by expanding digital adoption, rising e-commerce, and modernizing retail infrastructure. Retailers increasingly deploy IoT for inventory optimization, personalized promotions, and seamless payments. While infrastructure and cost challenges persist, government initiatives and digital transformation efforts are creating strong opportunities for future market expansion.

IoT in Retail Market Competitive Landscape:

Cisco Systems

Cisco Systems, Inc., a global leader in networking and IoT solutions, plays a pivotal role in the IoT in Retail Market by providing end-to-end connectivity, IoT platforms, and data analytics solutions. Its offerings enable retailers to optimize supply chains, enhance customer experiences through real-time insights, and implement smart store technologies. Cisco’s focus on secure, scalable IoT infrastructure and partnerships with retail technology providers strengthens its market presence and adoption worldwide.

  • In 2025, Cisco launched the “Collaboratory” in Manhattan, a pop-up retail space using IoT integration with Wi-Fi 7, Meraki smart cameras, PoE-powered POS, and AR displays to deliver immersive, interactive shopping experiences.

Microsoft

Microsoft Corporation leverages its Azure IoT platform to drive innovation in the IoT in Retail Market. Its solutions enable retailers to enhance inventory management, implement predictive analytics, and deliver personalized customer experiences. By integrating AI, cloud computing, and connected devices, Microsoft helps retailers optimize operations, reduce costs, and improve engagement. Strategic partnerships and continuous advancements in IoT and AI technologies strengthen Microsoft’s position and adoption across the global retail sector.

  • In 2024, Major updates to AI Store Assistant and Smart Store Analytics enhanced personalization, supported in-store employees, and integrated analytics with Microsoft Fabric, improving operational efficiency and customer experiences across retail environments.

  • In 2024, Microsoft introduced new Copilot templates, prebuilt applications, and retail data solutions, enabling generative AI across shopper journeys and in-store associate experiences, enhancing decision-making, engagement, and operational efficiency in retail stores.

Honeywell International

Honeywell International Inc. delivers advanced IoT solutions that transform retail operations by enhancing supply chain visibility, inventory management, and store automation. Its smart sensors, connected devices, and analytics platforms enable real-time monitoring, predictive maintenance, and efficient workforce management. Honeywell’s technologies support seamless integration of automated checkout systems, smart shelving, and safety monitoring, helping retailers improve operational efficiency, reduce costs, and elevate customer experiences, strengthening its position in the global IoT in Retail Market.

  • In 2024, Honeywell integrated AI and machine learning into its Guided Work Solutions, enhancing operational efficiency and improving shopper experiences across retail environments.

  • In 2024, In collaboration with Qualcomm, Honeywell developed an AI-enabled Multi-Modal Intelligent Agent for mobile devices, allowing natural interactions via voice, images, and barcodes in retail and distribution settings.

Key Players

Some of the IoT in Retail Market Companies

  • Cisco Systems, Inc.

  • IBM Corporation

  • Microsoft Corporation

  • Honeywell International Inc.

  • SAP SE

  • Oracle Corporation

  • Intel Corporation

  • Zebra Technologies Corporation

  • Amazon Web Services (AWS)

  • Google LLC

  • PTC Inc.

  • Siemens AG

  • Hitachi, Ltd.

  • Schneider Electric SE

  • Accenture plc

  • Broadcom

  • NXP Semiconductors

  • AT&T

  • Telit

  • Avery Dennison Corporation

IoT in Retail Market Report Scope:

Report Attributes Details
Market Size in 2024 USD 61.54 Billion 
Market Size by 2032 USD 369.73 Billion 
CAGR CAGR of 25.22% From 2025 to 2032
Base Year 2024
Forecast Period 2025-2032
Historical Data 2021-2023
Report Scope & Coverage Market Size, Segments Analysis, Competitive Landscape, Regional Analysis, DROC & SWOT Analysis, Forecast Outlook
Key Segments • By Component (Hardware, Platform, Services)
• By Technology (Bluetooth Low Energy, Near Field Communication, Zigbee, Others)
• By Deployment (On-Premises, Cloud)
• By Application (Operations Management, Customer Management, Asset Management, Advertising and Marketing, Others)
Regional Analysis/Coverage North America (US, Canada), Europe (Germany, UK, France, Italy, Spain, Russia, Poland, Rest of Europe), Asia Pacific (China, India, Japan, South Korea, Australia, ASEAN Countries, Rest of Asia Pacific), Middle East & Africa (UAE, Saudi Arabia, Qatar, South Africa, Rest of Middle East & Africa), Latin America (Brazil, Argentina, Mexico, Colombia, Rest of Latin America).
Company Profiles Cisco Systems, Inc., IBM Corporation, Microsoft Corporation, Honeywell International Inc., SAP SE, Oracle Corporation, Intel Corporation, Zebra Technologies Corporation, Amazon Web Services (AWS), Google LLC, PTC Inc., Siemens AG, Hitachi, Ltd., Schneider Electric SE, Accenture plc, Broadcom, NXP Semiconductors, AT&T, Telit, Avery Dennison Corporation

Table Of Contents

1. Introduction

1.1 Market Definition & Scope

 1.2 Research Assumptions & Abbreviations

 1.3 Research Methodology

2. Executive Summary

2.1 Market Snapshot

 2.2 Market Absolute $ Opportunity Assessment & Y-o-Y Analysis, 2021–2032

 2.3 Market Size & Forecast, By Segmentation, 2021–2032

  2.3.1 Market Size By Component

  2.3.2 Market Size By Application

  2.3.3 Market Size By Technology

  2.3.4 Market Size By Deployment

 2.4 Market Share & Bps Analysis By Region, 2024

 2.5 Industry Growth Scenarios – Conservative, Likely & Optimistic

 2.6 Industry CxO’s Perspective

3. Market Overview

3.1 Market Dynamics

  3.1.1 Drivers

  3.1.2 Restraints

  3.1.3 Opportunities

  3.1.4 Key Market Trends

 3.2 Industry PESTLE Analysis

 3.3 Key Industry Forces (Porter’s) Impacting Market Growth

 3.4 Industry Supply Chain Analysis

  3.4.1 Raw Material Suppliers

  3.4.2 Manufacturers

  3.4.3 Distributors/Suppliers

  3.4.4 Customers/End-Users

 3.5 Industry Life Cycle Assessment

 3.6 Parent Market Overview

 3.7 Market Risk Assessment

4. Statistical Insights & Trends Reporting

4.1 Pricing & Cost Structure Analysis

  4.1.1 Average Cost of IoT Deployment per Store

  4.1.2 Pricing Trends in IoT Sensors, Beacons, and RFID Tags

  4.1.3 Cloud vs. On-Premise IoT Solution Pricing Comparison

  4.1.4 Total Cost of Ownership (TCO) for IoT Systems

  4.1.5 ROI Timeline for IoT Investments in Retail

4.2 Infrastructure & Deployment Metrics

  4.2.1 Number of Connected Devices per Store (Average)

  4.2.2 Average Bandwidth Consumption by IoT Retail Applications

  4.2.3 Sensor Density (Devices per 1,000 sq. ft.)

  4.2.4 Integration Rate with Legacy Retail Systems (%)

  4.2.5 Cloud Storage Utilization for IoT Data (Petabytes per Year)

4.3 Operational Efficiency Metrics

  4.3.1 % Reduction in Stock-Outs Due to IoT Solutions

  4.3.2 % Improvement in Inventory Accuracy with RFID/Beacon Systems

  4.3.3 Average Reduction in Shrinkage/Theft (%)

  4.3.4 Improvement in Supply Chain Visibility (Lead Time Reduction %)

  4.3.5 Energy Savings per Store through IoT Smart Energy Management (%)

4.4 Customer Experience Metrics

  4.4.1 % of Retailers Using IoT for Personalized Shopping Experiences

  4.4.2 Average Increase in Customer Dwell Time with IoT Engagement Tools

  4.4.3 Conversion Rate Improvement (%) with Smart Shelves & Beacons

  4.4.4 Customer Satisfaction Index Linked to IoT Implementations

  4.4.5 Loyalty Program Participation Growth through IoT Integration (%)

4.5 Technology Utilization Metrics

  4.5.1 IoT Device Connectivity Distribution (Wi-Fi, Bluetooth, LPWAN, 5G)

  4.5.2 AI & Data Analytics Integration Rate with IoT Platforms (%)

  4.5.3 Edge vs. Cloud IoT Data Processing (%)

  4.5.4 Cybersecurity Investment in Retail IoT (% of Total IoT Budget)

  4.5.5 % of IoT Retail Devices with Predictive Maintenance Features

4.6 Business & Investment Metrics

  4.6.1 Average IT/IoT Spending by Retailers (% of Revenue)

  4.6.2 Vendor Partnership & Outsourcing Rate (%)

  4.6.3 Venture Capital Funding Trends in IoT Retail Startups (USD Millions)

  4.6.4 Payback Period for IoT Investments (Years)

  4.6.5 Growth in IoT-Driven Retail Revenue Contribution (%)

5. IoT in Retail Market Segmental Analysis & Forecast, By Component, 2021 – 2032, Value (Usd Billion)

5.1 Introduction

 5.2 Hardware

  5.2.1 Key Trends

  5.2.2 Market Size & Forecast, 2021 – 2032

 5.3 Platform

  5.3.1 Key Trends

  5.3.2 Market Size & Forecast, 2021 – 2032

 5.4 Services

  5.4.1 Key Trends

  5.4.2 Market Size & Forecast, 2021 – 2032

6. IoT in Retail Market Segmental Analysis & Forecast, By Application, 2021 – 2032, Value (Usd Billion)

    6.1 Introduction

 6.2 Operations Management

  6.2.1 Key Trends

  6.2.2 Market Size & Forecast, 2021 – 2032

 6.3 Customer Management

  6.3.1 Key Trends

  6.3.2 Market Size & Forecast, 2021 – 2032

 6.4 Asset Management

  6.4.1 Key Trends

  6.4.2 Market Size & Forecast, 2021 – 2032

 6.5 Advertising and Marketing

  6.5.1 Key Trends

  6.5.2 Market Size & Forecast, 2021 – 2032

 6.6 Others

  6.6.1 Key Trends

  6.6.2 Market Size & Forecast, 2021 – 2032

7. IoT in Retail Market Segmental Analysis & Forecast, By Technology, 2021 – 2032, Value (Usd Billion)

    7.1 Introduction

 7.2 Bluetooth Low Energy

  7.2.1 Key Trends

  7.2.2 Market Size & Forecast, 2021 – 2032

 7.3 Near Field Communication

  7.3.1 Key Trends

  7.3.2 Market Size & Forecast, 2021 – 2032

 7.4 Zigbee

  7.4.1 Key Trends

  7.4.2 Market Size & Forecast, 2021 – 2032

 7.5 Others

  7.5.1 Key Trends

  7.5.2 Market Size & Forecast, 2021 – 2032

8. IoT in Retail Market Segmental Analysis & Forecast, By Deployment, 2021 – 2032, Value (Usd Billion)

    8.1 Introduction

 8.2 On-Premises

  8.2.1 Key Trends

  8.2.2 Market Size & Forecast, 2021 – 2032

 8.3 Cloud

  8.3.1 Key Trends

  8.3.2 Market Size & Forecast, 2021 – 2032

9. IoT in Retail Market Segmental Analysis & Forecast By Region, 2021 – 2025, Value (Usd Billion)

9.1 Introduction

9.2 North America

 9.2.1 Key Trends

 9.2.2 IoT in Retail Market Size & Forecast, By Component, 2021 – 2032

 9.2.3 IoT in Retail Market Size & Forecast, By Application, 2021 – 2032

 9.2.4 IoT in Retail Market Size & Forecast, By Technology, 2021 – 2032

 9.2.5 IoT in Retail Market Size & Forecast, By Deployment, 2021 – 2032

 9.2.6 IoT in Retail Market Size & Forecast, By Country, 2021 – 2032

  9.2.6.1 USA

   9.2.6.1.1 IoT in Retail Market Size & Forecast, By Component, 2021 – 2032

   9.2.6.1.2 IoT in Retail Market Size & Forecast, By Application, 2021 – 2032

   9.2.6.1.3 IoT in Retail Market Size & Forecast, By Technology, 2021 – 2032

   9.2.6.1.4 IoT in Retail Market Size & Forecast, By Deployment, 2021 – 2032

  9.2.6.2 Canada

   9.2.6.2.1 IoT in Retail Market Size & Forecast, By Component, 2021 – 2032

   9.2.6.2.2 IoT in Retail Market Size & Forecast, By Application, 2021 – 2032

   9.2.6.2.3 IoT in Retail Market Size & Forecast, By Technology, 2021 – 2032

   9.2.6.2.4 IoT in Retail Market Size & Forecast, By Deployment, 2021 – 2032

9.3 Europe

 9.3.1 Key Trends

 9.3.2 IoT in Retail Market Size & Forecast, By Component, 2021 – 2032

 9.3.3 IoT in Retail Market Size & Forecast, By Application, 2021 – 2032

 9.3.4 IoT in Retail Market Size & Forecast, By Technology, 2021 – 2032

 9.3.5 IoT in Retail Market Size & Forecast, By Deployment, 2021 – 2032

 9.3.6 IoT in Retail Market Size & Forecast, By Country, 2021 – 2032

  9.3.6.1 Germany

   9.3.6.1.1 IoT in Retail Market Size & Forecast, By Component, 2021 – 2032

   9.3.6.1.2 IoT in Retail Market Size & Forecast, By Application, 2021 – 2032

   9.3.6.1.3 IoT in Retail Market Size & Forecast, By Technology, 2021 – 2032

   9.3.6.1.4 IoT in Retail Market Size & Forecast, By Deployment, 2021 – 2032

  9.3.6.2 UK

   9.3.6.2.1 IoT in Retail Market Size & Forecast, By Component, 2021 – 2032

   9.3.6.2.2 IoT in Retail Market Size & Forecast, By Application, 2021 – 2032

   9.3.6.2.3 IoT in Retail Market Size & Forecast, By Technology, 2021 – 2032

   9.3.6.2.4 IoT in Retail Market Size & Forecast, By Deployment, 2021 – 2032

  9.3.6.3 France

   9.3.6.3.1 IoT in Retail Market Size & Forecast, By Component, 2021 – 2032

   9.3.6.3.2 IoT in Retail Market Size & Forecast, By Application, 2021 – 2032

   9.3.6.3.3 IoT in Retail Market Size & Forecast, By Technology, 2021 – 2032

   9.3.6.3.4 IoT in Retail Market Size & Forecast, By Deployment, 2021 – 2032

  9.3.6.4 Italy

   9.3.6.4.1 IoT in Retail Market Size & Forecast, By Component, 2021 – 2032

   9.3.6.4.2 IoT in Retail Market Size & Forecast, By Application, 2021 – 2032

   9.3.6.4.3 IoT in Retail Market Size & Forecast, By Technology, 2021 – 2032

   9.3.6.4.4 IoT in Retail Market Size & Forecast, By Deployment, 2021 – 2032

  9.3.6.5 Spain

   9.3.6.5.1 IoT in Retail Market Size & Forecast, By Component, 2021 – 2032

   9.3.6.5.2 IoT in Retail Market Size & Forecast, By Application, 2021 – 2032

   9.3.6.5.3 IoT in Retail Market Size & Forecast, By Technology, 2021 – 2032

   9.3.6.5.4 IoT in Retail Market Size & Forecast, By Deployment, 2021 – 2032

  9.3.6.6 Russia

   9.3.6.6.1 IoT in Retail Market Size & Forecast, By Component, 2021 – 2032

   9.3.6.6.2 IoT in Retail Market Size & Forecast, By Application, 2021 – 2032

   9.3.6.6.3 IoT in Retail Market Size & Forecast, By Technology, 2021 – 2032

   9.3.6.6.4 IoT in Retail Market Size & Forecast, By Deployment, 2021 – 2032

  9.3.6.7 Poland

   9.3.6.7.1 IoT in Retail Market Size & Forecast, By Component, 2021 – 2032

   9.3.6.7.2 IoT in Retail Market Size & Forecast, By Application, 2021 – 2032

   9.3.6.7.3 IoT in Retail Market Size & Forecast, By Technology, 2021 – 2032

   9.3.6.7.4 IoT in Retail Market Size & Forecast, By Deployment, 2021 – 2032

  9.3.6.8 Rest of Europe

   9.3.6.8.1 IoT in Retail Market Size & Forecast, By Component, 2021 – 2032

   9.3.6.8.2 IoT in Retail Market Size & Forecast, By Application, 2021 – 2032

   9.3.6.8.3 IoT in Retail Market Size & Forecast, By Technology, 2021 – 2032

   9.3.6.8.4 IoT in Retail Market Size & Forecast, By Deployment, 2021 – 2032   

9.4 Asia-Pacific

 9.4.1 Key Trends

 9.4.2 IoT in Retail Market Size & Forecast, By Component, 2021 – 2032

 9.4.3 IoT in Retail Market Size & Forecast, By Application, 2021 – 2032

 9.4.4 IoT in Retail Market Size & Forecast, By Technology, 2021 – 2032

 9.4.5 IoT in Retail Market Size & Forecast, By Deployment, 2021 – 2032

 9.4.6 IoT in Retail Market Size & Forecast, By Country, 2021 – 2032

  9.4.6.1 China

   9.4.6.1.1 IoT in Retail Market Size & Forecast, By Component, 2021 – 2032

   9.4.6.1.2 IoT in Retail Market Size & Forecast, By Application, 2021 – 2032

   9.4.6.1.3 IoT in Retail Market Size & Forecast, By Technology, 2021 – 2032

   9.4.6.1.4 IoT in Retail Market Size & Forecast, By Deployment, 2021 – 2032

  9.4.6.2 India

   9.4.6.2.1 IoT in Retail Market Size & Forecast, By Component, 2021 – 2032

   9.4.6.2.2 IoT in Retail Market Size & Forecast, By Application, 2021 – 2032

   9.4.6.2.3 IoT in Retail Market Size & Forecast, By Technology, 2021 – 2032

   9.4.6.2.4 IoT in Retail Market Size & Forecast, By Deployment, 2021 – 2032

  9.4.6.3 Japan

   9.4.6.3.1 IoT in Retail Market Size & Forecast, By Component, 2021 – 2032

   9.4.6.3.2 IoT in Retail Market Size & Forecast, By Application, 2021 – 2032

   9.4.6.3.3 IoT in Retail Market Size & Forecast, By Technology, 2021 – 2032

   9.4.6.3.4 IoT in Retail Market Size & Forecast, By Deployment, 2021 – 2032

  9.4.6.4 South Korea

   9.4.6.4.1 IoT in Retail Market Size & Forecast, By Component, 2021 – 2032

   9.4.6.4.2 IoT in Retail Market Size & Forecast, By Application, 2021 – 2032

   9.4.6.4.3 IoT in Retail Market Size & Forecast, By Technology, 2021 – 2032

   9.4.6.4.4 IoT in Retail Market Size & Forecast, By Deployment, 2021 – 2032

  9.4.6.5 Australia

   9.4.6.5.1 IoT in Retail Market Size & Forecast, By Component, 2021 – 2032

   9.4.6.5.2 IoT in Retail Market Size & Forecast, By Application, 2021 – 2032

   9.4.6.5.3 IoT in Retail Market Size & Forecast, By Technology, 2021 – 2032

   9.4.6.5.4 IoT in Retail Market Size & Forecast, By Deployment, 2021 – 2032

  9.4.6.6 ASEAN Countries

   9.4.6.6.1 IoT in Retail Market Size & Forecast, By Component, 2021 – 2032

   9.4.6.6.2 IoT in Retail Market Size & Forecast, By Application, 2021 – 2032

   9.4.6.6.3 IoT in Retail Market Size & Forecast, By Technology, 2021 – 2032

   9.4.6.6.4 IoT in Retail Market Size & Forecast, By Deployment, 2021 – 2032

  9.4.6.7 Rest of Asia-Pacific

   9.4.6.7.1 IoT in Retail Market Size & Forecast, By Component, 2021 – 2032

   9.4.6.7.2 IoT in Retail Market Size & Forecast, By Application, 2021 – 2032

   9.4.6.7.3 IoT in Retail Market Size & Forecast, By Technology, 2021 – 2032

   9.4.6.7.4 IoT in Retail Market Size & Forecast, By Deployment, 2021 – 2032

9.5 Latin America

 9.5.1 Key Trends

 9.5.2 IoT in Retail Market Size & Forecast, By Component, 2021 – 2032

 9.5.3 IoT in Retail Market Size & Forecast, By Application, 2021 – 2032

 9.5.4 IoT in Retail Market Size & Forecast, By Technology, 2021 – 2032

 9.5.5 IoT in Retail Market Size & Forecast, By Deployment, 2021 – 2032

 9.5.6 IoT in Retail Market Size & Forecast, By Country, 2021 – 2032

  9.5.6.1 Brazil

   9.5.6.1.1 IoT in Retail Market Size & Forecast, By Component, 2021 – 2032

   9.5.6.1.2 IoT in Retail Market Size & Forecast, By Application, 2021 – 2032

   9.5.6.1.3 IoT in Retail Market Size & Forecast, By Technology, 2021 – 2032

   9.5.6.1.4 IoT in Retail Market Size & Forecast, By Deployment, 2021 – 2032

  9.5.6.2 Argentina

   9.5.6.2.1 IoT in Retail Market Size & Forecast, By Component, 2021 – 2032

   9.5.6.2.2 IoT in Retail Market Size & Forecast, By Application, 2021 – 2032

   9.5.6.2.3 IoT in Retail Market Size & Forecast, By Technology, 2021 – 2032

   9.5.6.2.4 IoT in Retail Market Size & Forecast, By Deployment, 2021 – 2032

  9.5.6.3 Mexico

   9.5.6.3.1 IoT in Retail Market Size & Forecast, By Component, 2021 – 2032

   9.5.6.3.2 IoT in Retail Market Size & Forecast, By Application, 2021 – 2032

   9.5.6.3.3 IoT in Retail Market Size & Forecast, By Technology, 2021 – 2032

   9.5.6.3.4 IoT in Retail Market Size & Forecast, By Deployment, 2021 – 2032

  9.5.6.4 Colombia

   9.5.6.4.1 IoT in Retail Market Size & Forecast, By Component, 2021 – 2032

   9.5.6.4.2 IoT in Retail Market Size & Forecast, By Application, 2021 – 2032

   9.5.6.4.3 IoT in Retail Market Size & Forecast, By Technology, 2021 – 2032

   9.5.6.4.4 IoT in Retail Market Size & Forecast, By Deployment, 2021 – 2032

  9.5.6.5 Rest of Latin America

   9.5.6.5.1 IoT in Retail Market Size & Forecast, By Component, 2021 – 2032

   9.5.6.5.2 IoT in Retail Market Size & Forecast, By Application, 2021 – 2032

   9.5.6.5.3 IoT in Retail Market Size & Forecast, By Technology, 2021 – 2032

   9.5.6.5.4 IoT in Retail Market Size & Forecast, By Deployment, 2021 – 2032

9.6 Middle East & Africa

 9.6.1 Key Trends

 9.6.2 IoT in Retail Market Size & Forecast, By Component, 2021 – 2032

 9.6.3 IoT in Retail Market Size & Forecast, By Application, 2021 – 2032

 9.6.4 IoT in Retail Market Size & Forecast, By Technology, 2021 – 2032

 9.6.5 IoT in Retail Market Size & Forecast, By Deployment, 2021 – 2032

 9.6.6 IoT in Retail Market Size & Forecast, By Country, 2021 – 2032

  9.6.6.1 UAE

   9.6.6.1.1 IoT in Retail Market Size & Forecast, By Component, 2021 – 2032

   9.6.6.1.2 IoT in Retail Market Size & Forecast, By Application, 2021 – 2032

   9.6.6.1.3 IoT in Retail Market Size & Forecast, By Technology, 2021 – 2032

   9.6.6.1.4 IoT in Retail Market Size & Forecast, By Deployment, 2021 – 2032

  9.6.6.2 Saudi Arabia

   9.6.6.2.1 IoT in Retail Market Size & Forecast, By Component, 2021 – 2032

   9.6.6.2.2 IoT in Retail Market Size & Forecast, By Application, 2021 – 2032

   9.6.6.2.3 IoT in Retail Market Size & Forecast, By Technology, 2021 – 2032

   9.6.6.2.4 IoT in Retail Market Size & Forecast, By Deployment, 2021 – 2032

  9.6.6.3 Qatar

   9.6.6.3.1 IoT in Retail Market Size & Forecast, By Component, 2021 – 2032

   9.6.6.3.2 IoT in Retail Market Size & Forecast, By Application, 2021 – 2032

   9.6.6.3.3 IoT in Retail Market Size & Forecast, By Technology, 2021 – 2032

   9.6.6.3.4 IoT in Retail Market Size & Forecast, By Deployment, 2021 – 2032

  9.6.6.4 Egypt

   9.6.6.4.1 IoT in Retail Market Size & Forecast, By Component, 2021 – 2032

   9.6.6.4.2 IoT in Retail Market Size & Forecast, By Application, 2021 – 2032

   9.6.6.4.3 IoT in Retail Market Size & Forecast, By Technology, 2021 – 2032

   9.6.6.4.4 IoT in Retail Market Size & Forecast, By Deployment, 2021 – 2032

  9.6.6.5 South Africa

   9.6.6.5.1 IoT in Retail Market Size & Forecast, By Component, 2021 – 2032

   9.6.6.5.2 IoT in Retail Market Size & Forecast, By Application, 2021 – 2032

   9.6.6.5.3 IoT in Retail Market Size & Forecast, By Technology, 2021 – 2032

   9.6.6.5.4 IoT in Retail Market Size & Forecast, By Deployment, 2021 – 2032

  9.6.6.6 Rest of Middle East & Africa

   9.6.6.6.1 IoT in Retail Market Size & Forecast, By Component, 2021 – 2032

   9.6.6.6.2 IoT in Retail Market Size & Forecast, By Application, 2021 – 2032

   9.6.6.6.3 IoT in Retail Market Size & Forecast, By Technology, 2021 – 2032

   9.6.6.6.4 IoT in Retail Market Size & Forecast, By Deployment, 2021 – 2032

10. Competitive Landscape

 10.1 Key Players' Positioning

 10.2 Competitive Developments

  10.2.1 Key Strategies Adopted (%), By Key Players, 2024

  10.2.2 Year-Wise Strategies & Development, 2021 – 2025

  10.2.3 Number Of Strategies Adopted By Key Players, 2024

 10.3 Market Share Analysis, 2024

 10.4 Product/Service & Application Benchmarking

  10.4.1 Product/Service Specifications & Features By Key Players

  10.4.2 Product/Service Heatmap By Key Players

  10.4.3 Application Heatmap By Key Players

 10.5 Industry Start-Up & Innovation Landscape

10.6 Key Company Profiles

10.6.1 Cisco Systems, Inc.

 10.6.1.1 Company Overview & Snapshot

 10.6.1.2 Product/Service Portfolio

 10.6.1.3 Key Company Financials

 10.6.1.4 SWOT Analysis

10.6.2 IBM Corporation

 10.6.2.1 Company Overview & Snapshot

 10.6.2.2 Product/Service Portfolio

 10.6.2.3 Key Company Financials

 10.6.2.4 SWOT Analysis

10.6.3 Microsoft Corporation

 10.6.3.1 Company Overview & Snapshot

 10.6.3.2 Product/Service Portfolio

 10.6.3.3 Key Company Financials

 10.6.3.4 SWOT Analysis

10.6.4 Honeywell International Inc.

 10.6.4.1 Company Overview & Snapshot

 10.6.4.2 Product/Service Portfolio

 10.6.4.3 Key Company Financials

 10.6.4.4 SWOT Analysis

10.6.5 SAP SE

 10.6.5.1 Company Overview & Snapshot

 10.6.5.2 Product/Service Portfolio

 10.6.5.3 Key Company Financials

 10.6.5.4 SWOT Analysis

10.6.6 Oracle Corporation

 10.6.6.1 Company Overview & Snapshot

 10.6.6.2 Product/Service Portfolio

 10.6.6.3 Key Company Financials

 10.6.6.4 SWOT Analysis

10.6.7 Intel Corporation

 10.6.7.1 Company Overview & Snapshot

 10.6.7.2 Product/Service Portfolio

 10.6.7.3 Key Company Financials

 10.6.7.4 SWOT Analysis

10.6.8 Zebra Technologies Corporation

 10.6.8.1 Company Overview & Snapshot

 10.6.8.2 Product/Service Portfolio

 10.6.8.3 Key Company Financials

 10.6.8.4 SWOT Analysis

10.6.9 Amazon Web Services (AWS)

 10.6.9.1 Company Overview & Snapshot

 10.6.9.2 Product/Service Portfolio

 10.6.9.3 Key Company Financials

 10.6.9.4 SWOT Analysis

10.6.10 Google LLC

 10.6.10.1 Company Overview & Snapshot

 10.6.10.2 Product/Service Portfolio

 10.6.10.3 Key Company Financials

 10.6.10.4 SWOT Analysis

10.6.11 PTC Inc.

 10.6.11.1 Company Overview & Snapshot

 10.6.11.2 Product/Service Portfolio

 10.6.11.3 Key Company Financials

 10.6.11.4 SWOT Analysis

10.6.12 Siemens AG

 10.6.12.1 Company Overview & Snapshot

 10.6.12.2 Product/Service Portfolio

 10.6.12.3 Key Company Financials

 10.6.12.4 SWOT Analysis

10.6.13 Hitachi, Ltd.

 10.6.13.1 Company Overview & Snapshot

 10.6.13.2 Product/Service Portfolio

 10.6.13.3 Key Company Financials

 10.6.13.4 SWOT Analysis

10.6.14 Schneider Electric SE

 10.6.14.1 Company Overview & Snapshot

 10.6.14.2 Product/Service Portfolio

 10.6.14.3 Key Company Financials

 10.6.14.4 SWOT Analysis

10.6.15 Accenture plc

 10.6.15.1 Company Overview & Snapshot

 10.6.15.2 Product/Service Portfolio

 10.6.15.3 Key Company Financials

 10.6.15.4 SWOT Analysis

10.6.16 Broadcom

 10.6.16.1 Company Overview & Snapshot

 10.6.16.2 Product/Service Portfolio

 10.6.16.3 Key Company Financials

 10.6.16.4 SWOT Analysis

10.6.17 NXP Semiconductors

 10.6.17.1 Company Overview & Snapshot

 10.6.17.2 Product/Service Portfolio

 10.6.17.3 Key Company Financials

 10.6.17.4 SWOT Analysis

10.6.18 AT&T

 10.6.18.1 Company Overview & Snapshot

 10.6.18.2 Product/Service Portfolio

 10.6.18.3 Key Company Financials

 10.6.18.4 SWOT Analysis

10.6.19 Telit

 10.6.19.1 Company Overview & Snapshot

 10.6.19.2 Product/Service Portfolio

 10.6.19.3 Key Company Financials

 10.6.19.4 SWOT Analysis

10.6.20 Avery Dennison Corporation

 10.6.20.1 Company Overview & Snapshot

 10.6.20.2 Product/Service Portfolio

 10.6.20.3 Key Company Financials

 10.6.20.4 SWOT Analysis

11. Analyst Recommendations

 11.1 SNS Insider Opportunity Map

 11.2 Industry Low-Hanging Fruit Assessment

 11.3 Market Entry & Growth Strategy

 11.4 Analyst Viewpoint & Suggestions On Market Growth

12. Assumptions

13. Disclaimer

14. Appendix

 14.1 List Of Tables

 14.2 List Of Figures

Key Segments: 

By Component

    • Hardwar

    • Platform

    • Service

By Technology

    • Bluetooth Low Energy

    • Near Field Communication

    • Zigbee

    • Others

By Deployment

    • On-Premises

    • Cloud

By Application

    • Operations Managemen

    • Customer Managemen

    • Asset Managemen

    • Advertising and Marketin

    • Others

Request for Segment Customization as per your Business Requirement: Segment Customization Request

Regional Coverage: 

North America

  • US

  • Canada

Europe

  • Germany

  • France

  • UK

  • Italy

  • Spain

  • Poland

  • Russia

  • Rest of Europe

Asia Pacific

  • China

  • India

  • Japan

  • South Korea

  • Australia

  • ASEAN Countries

  • Rest of Asia Pacific

Middle East & Africa

  • UAE

  • Saudi Arabia

  • Qatar

  • South Africa

  • Rest of Middle East & Africa

Latin America

  • Brazil

  • Argentina

  • Mexico

  • Colombia

  • Rest of Latin America

Request for Country Level Research Report: Country Level Customization Request

Available Customization 

With the given market data, SNS Insider offers customization as per the company’s specific needs. The following customization options are available for the report: 

  • Detailed Volume Analysis 

  • Criss-Cross segment analysis (e.g. Product X Application) 

  • Competitive Product Benchmarking 

  • Geographic Analysis 

  • Additional countries in any of the regions 

  • Customized Data Representation 

  • Detailed analysis and profiling of additional market players

An accurate research report requires proper strategizing as well as implementation. There are multiple factors involved in the completion of good and accurate research report and selecting the best methodology to compete the research is the toughest part. Since the research reports we provide play a crucial role in any company’s decision-making process, therefore we at SNS Insider always believe that we should choose the best method which gives us results closer to reality. This allows us to reach at a stage wherein we can provide our clients best and accurate investment to output ratio.

Each report that we prepare takes a timeframe of 350-400 business hours for production. Starting from the selection of titles through a couple of in-depth brain storming session to the final QC process before uploading our titles on our website we dedicate around 350 working hours. The titles are selected based on their current market cap and the foreseen CAGR and growth.


The 5 steps process:

Step 1: Secondary Research:

Secondary Research or Desk Research is as the name suggests is a research process wherein, we collect data through the readily available information. In this process we use various paid and unpaid databases which our team has access to and gather data through the same. This includes examining of listed companies’ annual reports, Journals, SEC filling etc. Apart from this our team has access to various associations across the globe across different industries. Lastly, we have exchange relationships with various university as well as individual libraries.

Secondary Research

Step 2: Primary Research

When we talk about primary research, it is a type of study in which the researchers collect relevant data samples directly, rather than relying on previously collected data.  This type of research is focused on gaining content specific facts that can be sued to solve specific problems. Since the collected data is fresh and first hand therefore it makes the study more accurate and genuine.

We at SNS Insider have divided Primary Research into 2 parts.

Part 1 wherein we interview the KOLs of major players as well as the upcoming ones across various geographic regions. This allows us to have their view over the market scenario and acts as an important tool to come closer to the accurate market numbers. As many as 45 paid and unpaid primary interviews are taken from both the demand and supply side of the industry to make sure we land at an accurate judgement and analysis of the market.

This step involves the triangulation of data wherein our team analyses the interview transcripts, online survey responses and observation of on filed participants. The below mentioned chart should give a better understanding of the part 1 of the primary interview.

Primary Research

Part 2: In this part of primary research the data collected via secondary research and the part 1 of the primary research is validated with the interviews from individual consultants and subject matter experts.

Consultants are those set of people who have at least 12 years of experience and expertise within the industry whereas Subject Matter Experts are those with at least 15 years of experience behind their back within the same space. The data with the help of two main processes i.e., FGDs (Focused Group Discussions) and IDs (Individual Discussions). This gives us a 3rd party nonbiased primary view of the market scenario making it a more dependable one while collation of the data pointers.

Step 3: Data Bank Validation

Once all the information is collected via primary and secondary sources, we run that information for data validation. At our intelligence centre our research heads track a lot of information related to the market which includes the quarterly reports, the daily stock prices, and other relevant information. Our data bank server gets updated every fortnight and that is how the information which we collected using our primary and secondary information is revalidated in real time.

Data Bank Validation

Step 4: QA/QC Process

After all the data collection and validation our team does a final level of quality check and quality assurance to get rid of any unwanted or undesired mistakes. This might include but not limited to getting rid of the any typos, duplication of numbers or missing of any important information. The people involved in this process include technical content writers, research heads and graphics people. Once this process is completed the title gets uploader on our platform for our clients to read it.

Step 5: Final QC/QA Process:

This is the last process and comes when the client has ordered the study. In this process a final QA/QC is done before the study is emailed to the client. Since we believe in giving our clients a good experience of our research studies, therefore, to make sure that we do not lack at our end in any way humanly possible we do a final round of quality check and then dispatch the study to the client.