IT Asset Management (ITAM) Software Market Report Scope & Overview:

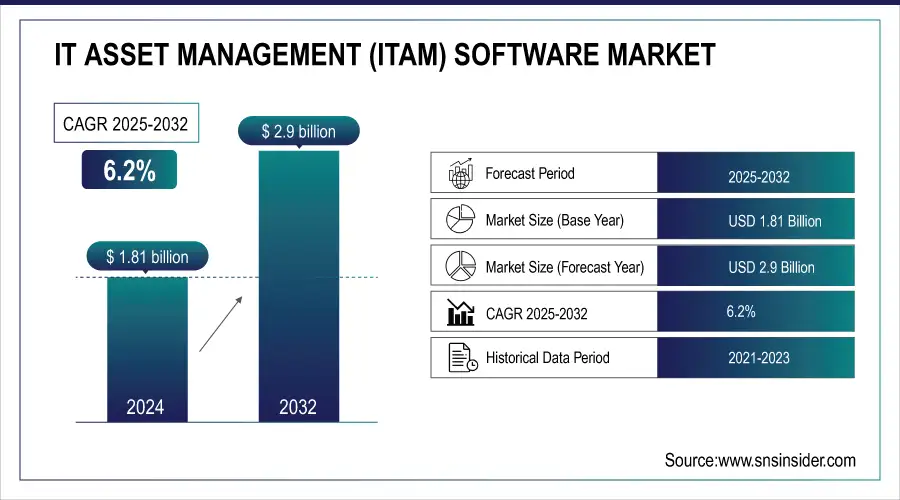
IT Asset Management (ITAM) Software Market Size was valued at USD 1.81 Billion in 2024 and is expected to reach USD 2.9 Billion by 2032, growing at a CAGR of 6.2% over the forecast period 2025-2032.

IT-Asset-Management-ITAM-Software-Market

Get more information on IT Asset Management (ITAM) Software Market - Request Sample Report

The IT Asset Management (ITAM) software market is growing as businesses seek efficient tracking, optimization, and compliance of IT assets across hardware, software, and cloud environments. Market growth is driven by digital transformation, remote and hybrid work, regulatory compliance, and government IT spending, including the U.S. $92 billion federal plan and the EU Digital Europe Programme. Advances in AI, IoT, and cloud infrastructure further enhance ITAM capabilities, improving operational efficiency and cybersecurity.

IT-Asset-Management-ITAM-Software-Market-US

IT Asset Management (ITAM) Software Market Report Trends:

  • Rising digital transformation and hybrid work models drive demand for efficient tracking, optimization, and lifecycle management of IT assets.

  • Cloud adoption, AI, machine learning, and IoT integration enhance ITAM capabilities, improving operational efficiency, cost management, and cybersecurity.

  • Regulatory compliance requirements, including FISMA and GDPR, boost adoption across enterprises and government organizations.

  • Shift toward cloud and remote infrastructure increases need for centralized asset management solutions.

  • Complex IT environments and growing software/hardware inventories challenge organizations, further driving ITAM software adoption.

IT Asset Management (ITAM) Software Market Key Driver:

  • ITAM software helps organizations optimize IT spending by identifying unused or underutilized assets, negotiating better licensing deals, and automating license compliance tasks.

  • ITAM software helps organizations track assets, identify vulnerabilities, and ensure compliance with regulations like GDPR and SOX.

The IT Asset Management (ITAM) software market has been growing with key drivers such as IT environments which include a combination of hardware, software, and cloud services. As more businesses follow digital transformation strategies, their IT landscapes have tended to increase in complexity and may extend across multiple vendors, platforms, and locations. ITAM software helps address this complexity by providing a unified view of all assets and related data, which in turn equips organizations to execute processes more efficiently and on the basis of enhanced information. Many organizations struggle with managing their hybrid IT environments, due to the inability to trace physical and virtual assets as was stated by 75% of respondents on the Global IT Report for 2023. Another 56% of enterprises were wasting budget on unused or underutilized software licenses in 2023, according to a report from managed services provider Flexera. For example, according to the 2023 Global IT Report, 75% of businesses reported difficulties in managing their hybrid IT environments, citing challenges in tracking both physical and virtual assets. Additionally, 56% of enterprises had unused or underutilized software licenses in 2023, leading to inefficient IT spending. ITAM software enables organizations to pinpoint these inefficiencies and renegotiate for better licensing terms or automate compliance tasks. With the ever-increasing enforcement of compliance requirements mandated by regulatory frameworks such as GDPR and Sarbanes-Oxley Act (SOX), a capability like this one is vital non-compliance can result in heavy fines. ITAM solutions automate asset tracking and compliance management, thus lowering the risk while increasing operational efficiency in these complex IT environments.

IT Asset Management (ITAM) Software Market Restraints:

  • Organizations may become dependent on a particular ITAM software vendor, making it difficult to switch to another solution.

  • ITAM software stores sensitive information about IT assets, so data security breaches can be a major risk.

  • Integrating ITAM software with other enterprise systems can be complex and time-consuming.

Integrating IT Asset Management (ITAM) software with other enterprise systems can be complex and time-consuming. This complexity arises because ITAM systems need to interact seamlessly with a variety of other platforms, such as ERP (Enterprise Resource Planning), CRM (Customer Relationship Management), and ITSM (IT Service Management) systems, to provide a holistic view of an organization's IT assets. Each of these systems may have different data formats, protocols, and integration requirements, making the integration process technically challenging. Additionally, achieving real-time data synchronization and ensuring data consistency across systems require careful planning and robust technical solutions.

IT Asset Management (ITAM) Software Market Opportunities:

  • The rise of cloud computing is creating new opportunities for ITAM software vendors to develop solutions that can manage assets across both on-premises and cloud environments.

  • The Bring Your Device (BYOD) trend is increasing the need for ITAM solutions that can manage personal devices used for work purposes.

The Bring Your Own Device (BYOD) trend, where employees use personal smartphones, laptops, and tablets for work, is driving the demand for IT Asset Management (ITAM) solutions. Organizations face challenges in tracking, securing, and managing diverse devices while ensuring compliance with software licensing and data protection regulations. ITAM solutions help businesses monitor device usage, enforce security policies, and maintain an accurate inventory of both corporate and personal assets accessing the network. By providing centralized visibility and automated management, ITAM platforms reduce risks associated with data breaches, software misuse, and operational inefficiencies, enabling organizations to leverage BYOD initiatives without compromising security or compliance.

IT Asset Management (ITAM) Software Market Segmentation Analysis:

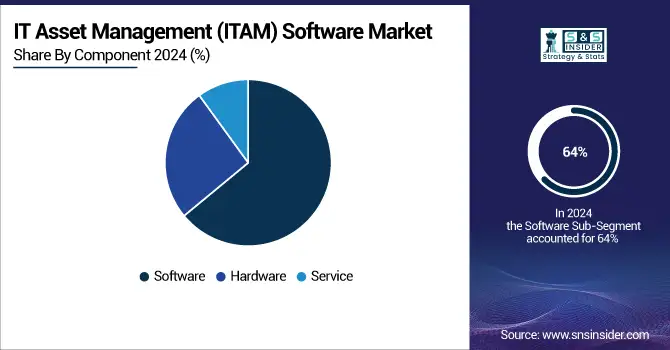
By Component, Software Segment Leads ITAM Market with 64% Share Driven by Software Asset Management and BYOD Adoption

In 2024, software dominated the market, accounted for around 64% share of the total revenue. Software Asset Management (SAM) encompasses managing and enhancing the acquisition, deployment, upkeep, utilization, and disposal of software applications within a company. SAM aids in lowering software expenses, ensuring compliance, and establishing procedures for employee requests. During SAM implementation, enterprises need to consider their Bring Your Device (BYOD) strategy, which enables employees to access software licenses from personal devices.

IT-Asset-Management-ITAM-Software-Market-By-Component

By Organization, Large Enterprises Dominate ITAM Market in 2024 Driven by Software Asset Management Adoption

The IT Asset Management Software Market is segmented based on organization size into Small and Medium Enterprises (SMEs) and Large Enterprises, with the large enterprise dominating the market in 2024. Large enterprises often make substantial investments in sophisticated software to boost productivity. Consequently, they typically require Software Asset Management (SAM) tools to manage their software effectively. SAM tools automate, expedite, and enhance manual processes, ensuring efficient software management. Furthermore, SAM facilitates organizations across diverse industries in enhancing the performance and agility of their IT assets.

By Tools, Automated Inventory/Discovery Leads ITAM Market in 2024 with 33% Revenue Share Driven by Compliance and Cybersecurity Benefits

In 2024, Automated Inventory/ Discovery appeared as the leading segment in IT Asset Management (ITAM) software market-tool type and this held approximately 33% of revenue share. This growth is driven by there are many reasons why businesses need up-to-date visibility of their IT assets hardware and software. Now governments have also realized the importance of asset discovery and tracking. For example, the NCSC (National Cyber Security Centre) in the U.K., emphasized this point accurate inventory management can reduce overall cyber risks by up to 40%. Discovery orchestration automated discovery tools can be used to ensure organizations have up-to-date visibility into their asset inventory in order to discover unused or redundant assets and get IT spending under control. This software ensures that businesses maintain the necessary level of compliance with government regulations. These tools are automation-centric and hence require the least human intervention during the upgrading process, such minimum involvement of humans also reduces errors that humans can make while keeping faster IT operation health.

By End-User, IT & Telecom Sector Leads Global ITAM Market in 2024 with 29% Revenue Share Driven by 5G and Data Center Expansion

The IT & Telecom sector led the global ITAM software market in 2024 with around 29% revenue shares of the market. This position is because of its heavy use in the IT infrastructure sector, which incorporates workplaces and information centers. The increasing penetration of 5G technology coupled with the considerable rise in data center installations around the world has driven new avenues for investments by IT & Telecom companies in a multitude of expanding hardware, software, and network resources that increase reliance on ITAM solutions. According to a 2023 report by the International Telecommunication Union (ITU), global telecom companies spent an estimated $120 billion on IT infrastructure upgrades, reflecting the increasing demand for effective asset management solutions. Furthermore, the necessity to implement and comply with a range of regulatory measures such as the General Data Protection Regulation (GDPR) in the EU along with data protection laws for U.S. businesses is driving IT & telecom companies towards deploying advanced level ICT management solutions that secure sensitive information while tracking asset lifecycles.

IT Asset Management (ITAM) Software Market Regional Insights:

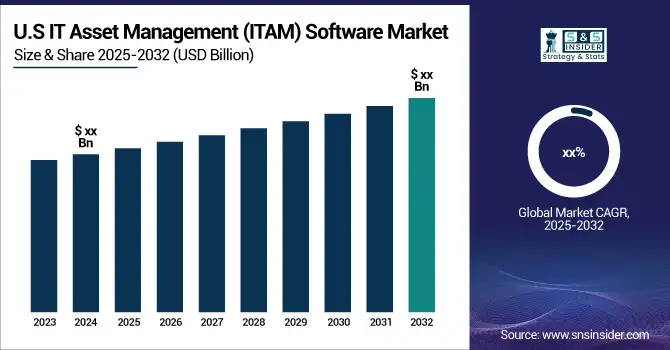
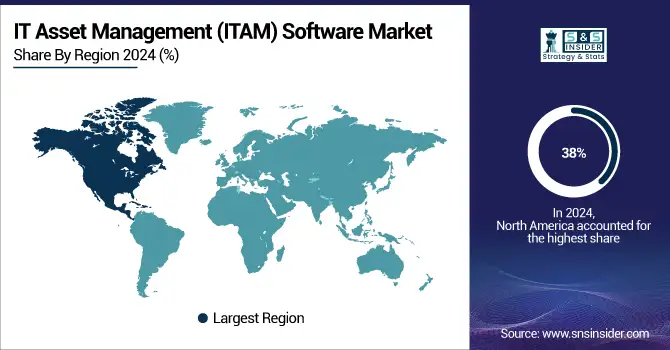
North America ITAM Market Leads with 38% Share Driven by Federal Investments, Cloud Adoption, and Regulatory Compliance

In 2024, the North American region held approximately 38% of the total market share and is projected to grow with a significant Compound Annual Growth Rate (CAGR) throughout the forecast period 2025-2032. This growth can be attributed to substantial investments in technology, addressing the intricate requirements of software lifecycle management, and adhering to stringent laws and regulations regarding asset procurement. These factors drive organizations to embrace technologies that reduce variable purchase costs and maintain equilibrium by monitoring demand and supply records. Advanced IT infrastructure in the region with higher cloud technologies adoption along with stringent governmental regulations pertaining to IT asset management. According to the U.S. Federal Government, its Federal IT Dashboard reported that federal agencies spent over $58 billion on IT services in 2023, with a significant portion allocated to asset management and cybersecurity solutions. Moreover, many major participants of innovation in asset management solutions such as IBM, Microsoft, and ServiceNow are located in North America. The stringent regulatory environment in the region, governed by legislations such as the Federal Information Security Modernization Act (FISMA) and Sarbanes-Oxley Act has driven organizations to deploy ITAM software to remain compliant with these regulations thus avoiding fines and loss of data. Additionally, the growing deployment of hybrid work models after the pandemic has increased remote device management, which in turn drives ITAM solutions adoption across North America.

IT-Asset-Management-ITAM-Software-Market-By-region

Get Customized Report as per Your Business Requirement - Enquiry Now

Asia-Pacific ITAM Market to Experience Fastest Growth in 2024 with 15.8% CAGR Driven by Digital Transformation

Asia-Pacific is the fastest-growing region in the ITAM software market in 2024, with an estimated CAGR of 15.8%. Growth is driven by rapid digital transformation, increasing cloud adoption, and rising IT infrastructure complexity.

  • China Leads Asia-Pacific ITAM Market Through Government Initiatives and Expanding Cloud Infrastructure

China dominates the Asia-Pacific ITAM market due to extensive government initiatives and massive investments in enterprise IT infrastructure. Its rapidly growing cloud and digital economy, coupled with increasing adoption of hybrid work models, has led organizations to prioritize IT asset visibility, compliance, and cybersecurity, making China the leading contributor to the region’s ITAM software growth.

Europe Holds Second-Largest Share in ITAM Software Market in 2024 Supported by Enterprise Modernization

In 2024, Europe holds the second-largest share in the ITAM software market. Market growth is driven by industrialized countries focusing on software licensing optimization, regulatory compliance, and enterprise IT modernization. Organizations are increasingly adopting ITAM tools to manage complex IT environments and reduce operational costs.

  • Germany Dominates European ITAM Market Due to Industrialization, IT Infrastructure, and Regulatory Compliance

Germany dominates the European ITAM market due to its highly industrialized economy, widespread IT infrastructure, and strict regulatory framework, prompting enterprises to deploy advanced ITAM solutions to manage hardware, software, and cloud assets effectively.

MEA and Latin America Emerging as Growth Markets for ITAM Software in 2024 Amid Digitalization Initiatives

In 2024, the MEA and Latin America regions are emerging markets for ITAM software. Growth is driven by increasing IT infrastructure investment, government digitalization initiatives, and the need for efficient IT asset management across organizations. Companies in these regions are adopting ITAM solutions to track hardware, software, and cloud assets, reduce IT costs, and ensure compliance with evolving local regulations.

  • UAE and Brazil Lead Regional ITAM Adoption Through Investment in Cloud, Digital Transformation, and Compliance Frameworks

Countries like the UAE in MEA and Brazil in LATAM lead regional adoption due to significant investments in digital transformation, cloud adoption, and the implementation of regulatory frameworks promoting asset management efficiency.

IT Asset Management (ITAM) Software Market Competitive Landscape:

Flexera, headquartered in Itasca, Illinois, is a leading provider of IT asset management (ITAM), software asset management (SAM), and cloud management solutions. The company helps enterprises maximize the value of their technology investments by offering tools for software license optimization, cloud cost management, and IT asset tracking. Flexera’s solutions enable organizations to maintain compliance, reduce costs, and improve operational efficiency. With a global customer base across multiple industries, Flexera integrates advanced analytics and automation to provide insights into software usage, deployment, and lifecycle management. Its platforms support both on-premises and cloud environments, driving digital transformation initiatives worldwide.

  • February 2025: Flexera expanded cloud capabilities by acquiring Spot by NetApp, adding automated optimization to its ITAM portfolio.

BMC, headquartered in Houston, Texas, is a global leader in IT service management (ITSM), IT operations, and IT asset management solutions. The company provides software that helps enterprises monitor, manage, and optimize their IT infrastructure, including hardware, software, and cloud resources. BMC’s ITAM and SAM solutions enable organizations to ensure compliance, reduce costs, and improve service delivery. With AI-driven automation, advanced analytics, and scalable platforms, BMC serves businesses of all sizes across various industries. Its comprehensive offerings support digital transformation, cloud migration, and hybrid IT environments, empowering enterprises to enhance operational efficiency and governance of IT assets.

  • February 2025: BMC Software agreed to acquire Netreo, bolstering the BMC Helix suite with full-stack observability and AIOps.

TeamViewer, headquartered in Göppingen, Germany, is a leading provider of remote connectivity, support, and collaboration solutions. The company enables secure remote access to devices, IT systems, and networks, supporting IT management, troubleshooting, and business continuity. TeamViewer’s platform is widely used for IT support, remote monitoring, and management of IT assets, as well as cross-functional collaboration across enterprises. The company serves millions of users globally, spanning small businesses to large enterprises. With features including remote control, file transfer, and IoT device management, TeamViewer combines security, scalability, and user-friendliness, supporting digital transformation initiatives and enhancing operational efficiency in hybrid and distributed IT environments.

  • February 2025: TeamViewer announced purchase of 1E to strengthen digital-workspace and ITAM capabilities.

IT Asset Management (ITAM) Software Market Companies:

  • Dell Technologies Inc.

  • Microsoft Corporation

  • International Business Machines Corporation

  • BMC Software, Inc.

  • HP Inc.

  • ServiceNow, Inc.

  • Oracle Corporation

  • Flexera Software LLC

  • Ivanti, Inc.

  • USU Software AG (Aspera GmbH)

  • Cherwell Software, LLC

  • Snow Software AB

  • Broadcom Inc.

  • Freshworks Inc.

  • Axonius, Inc.

  • Zoho Corporation Pvt. Ltd. (ManageEngine)

  • SolarWinds Corporation

  • Micro Focus International plc (an OpenText company)

  • Lansweeper NV

  • Qualys, Inc.

IT Asset Management (ITAM) Software Market Report Scope:

Report Attributes Details
 Market Size in 2024

 USD 1.81 Billion

 Market Size by 2032

 USD 2.9 Billion

 CAGR 

 CAGR of 6.2% From 2025 to 2032

 Base Year

 2024

 Forecast Period

 2025-2032

 Historical Data

 2021-2023

 Report Scope & Coverage

Market Size, Segments Analysis, Competitive  Landscape, Regional Analysis, DROC & SWOT Analysis, Forecast Outlook

 Key Segments

• By Component (Hardware, Software, Service)
• By Deployment (On-Cloud, On-Premise)
• By Organization (SME, Large Enterprise)
• By End-User (BFSI, Retail, Aerospace & Defense, IT & Telecom)
• By Tools (Discovery/ Automated Inventory, License Management, Patch & Version Management, Request Management, Product/Service Catalog, Digital Asset Management, Others)

 Regional Analysis/Coverage North America (US, Canada), Europe (Germany, UK, France, Italy, Spain, Russia, Poland, Rest of Europe), Asia Pacific (China, India, Japan, South Korea, Australia, ASEAN Countries, Rest of Asia Pacific), Middle East & Africa (UAE, Saudi Arabia, Qatar, South Africa, Rest of Middle East & Africa), Latin America (Brazil, Argentina, Mexico, Colombia, Rest of Latin America).
 Company Profiles

Dell Inc., Microsoft Corporation, IBM Corporation, BMC Software Inc., HP Inc., ServiceNow Inc., Oracle Corp, Flexera Software LLC, Ivanti, Aspera Technologies Inc.

Table Of Contents

1. Introduction

1.1 Market Definition & Scope

 1.2 Research Assumptions & Abbreviations

 1.3 Research Methodology

2. Executive Summary

2.1 Market Snapshot

 2.2 Market Absolute $ Opportunity Assessment & Y-o-Y Analysis, 2021–2032

 2.3 Market Size & Forecast, By Segmentation, 2021–2032

  2.3.1 Market Size By Component

  2.3.2 Market Size By Organization

         2.3.2 Market Size By Tools

         2.3.2 Market Size By End-User

         2.3.2 Market Size By Deployment

 2.4 Market Share & BPS Analysis By Region, 2024

 2.5 Industry Growth Scenarios – Conservative, Likely & Optimistic

 2.6 Industry CxO’s Perspective

3. Market Overview

3.1 Market Dynamics

  3.1.1 Drivers

  3.1.2 Restraints

  3.1.3 Opportunities

  3.1.4 Key Market Trends

 3.2 Industry PESTLE Analysis

 3.3 Key Industry Forces (Porter’s) Impacting Market Growth

 3.4 Industry Supply Chain Analysis

  3.4.1 Raw Material Suppliers

  3.4.2 Manufacturers

  3.4.3 Distributors/Suppliers

  3.4.4 Customers/End-Users

 3.5 Industry Life Cycle Assessment

 3.6 Parent Market Overview

 3.7 Market Risk Assessment

4. Statistical Insights & Trends Reporting

     4.1 Asset Deployment & Usage Statistics

4.1.1 Average number of IT assets managed per enterprise using ITAM software

4.1.2 Share of hardware vs. software assets tracked in ITAM systems

4.1.3 Growth rate of cloud-based ITAM adoption compared to on-premise solutions

     4.2 License & Compliance Metrics

4.2.1 Percentage of organizations achieving 100% software license compliance

4.2.2 Average cost savings (%) from automated license management

4.2.3 Incidence rate of audit penalties before vs. after ITAM implementation

     4.3 Operational Efficiency & Productivity Indicators

4.3.1 Average time (hours) saved per month in asset tracking with ITAM software

4.3.2 Reduction in asset downtime (%) after ITAM deployment

4.3.3 Share of ITAM systems integrated with service desk and ITSM tools

     4.4 Security & Risk Management Statistics

4.4.1 Percentage of assets monitored for cybersecurity vulnerabilities

4.4.2 Average number of security incidents avoided annually due to ITAM visibility

4.4.3 Rate of unauthorized software or device detection using ITAM solutions

5. IT Asset Management (ITAM) Software Market Segmental Analysis & Forecast, By Component, 2021 – 2032, Value (USD Billion)

5.1 Introduction

 5.2 Hardware

  5.2.1 Key Trends

  5.2.2 Market Size & Forecast, 2021 – 2032

 5.3 Software

  5.3.1 Key Trends

  5.3.2 Market Size & Forecast, 2021 – 2032

 5.4 Services

  5.4.1 Key Trends

  5.4.2 Market Size & Forecast, 2021 – 2032

6. IT Asset Management (ITAM) Software Market Segmental Analysis & Forecast, By Organization, 2021 – 2032, Value (USD Billion)

    6.1 Introduction

 6.2 SME

  6.2.1 Key Trends

  6.2.2 Market Size & Forecast, 2021 – 2032

 6.3 Large Enterprise

  6.3.1 Key Trends

  6.3.2 Market Size & Forecast, 2021 – 2032

7. IT Asset Management (ITAM) Software Market Segmental Analysis & Forecast, By Tools, 2021 – 2032, Value (USD Billion)

    7.1 Introduction

 7.2 Discovery/ Automated Inventory

  7.2.1 Key Trends

  7.2.2 Market Size & Forecast, 2021 – 2032

 7.3 License Management

  7.3.1 Key Trends

  7.3.2 Market Size & Forecast, 2021 – 2032

 7.4 Patch & Version Management

  7.4.1 Key Trends

  7.4.2 Market Size & Forecast, 2021 – 2032

 7.5 Request Management

  7.5.1 Key Trends

  7.5.2 Market Size & Forecast, 2021 – 2032

 7.6 Product/Service Catalog

  7.6.1 Key Trends

  7.6.2 Market Size & Forecast, 2021 – 2032

 7.7 Digital Asset Management

  7.7.1 Key Trends

  7.7.2 Market Size & Forecast, 2021 – 2032

 7.8 Others

  7.8.1 Key Trends

  7.8.2 Market Size & Forecast, 2021 – 2032

8. IT Asset Management (ITAM) Software Market Segmental Analysis & Forecast, By End-User, 2021 – 2032, Value (USD Billion)

    8.1 Introduction

 8.2 BFSI

  8.2.1 Key Trends

  8.2.2 Market Size & Forecast, 2021 – 2032

 8.3 Retail

  8.3.1 Key Trends

  8.3.2 Market Size & Forecast, 2021 – 2032

 8.4 Aerospace & Defense

  8.4.1 Key Trends

  8.4.2 Market Size & Forecast, 2021 – 2032

 8.5 IT & Telecom

  8.5.1 Key Trends

  8.5.2 Market Size & Forecast, 2021 – 2032

9. IT Asset Management (ITAM) Software Market Segmental Analysis & Forecast, By Deployment, 2021 – 2032, Value (USD Billion)

    9.1 Introduction 

  9.2 Cloud

   9.2.1 Key Trends 

   9.2.2 Market Size & Forecast, 2021 – 2032 

  9.3 On-premises

   9.3.1 Key Trends 

   9.3.2 Market Size & Forecast, 2021 – 2032 

10. IT Asset Management (ITAM) Software Market Segmental Analysis & Forecast By Region, 2021 – 2032, Value (USD Billion)

 10.1 Introduction

 10.2 North America

  10.2.1 Key Trends

  10.2.2 IT Asset Management (ITAM) Software Market Size & Forecast, By Component, 2021 – 2032

  10.2.3 IT Asset Management (ITAM) Software Market Size & Forecast, By Organization, 2021 – 2032

  10.2.4 IT Asset Management (ITAM) Software Market Size & Forecast, By Tools, 2021 – 2032

  10.2.5 IT Asset Management (ITAM) Software Market Size & Forecast, By End-User, 2021 – 2032

  10.2.6 IT Asset Management (ITAM) Software Market Size & Forecast, By Deployment, 2021 – 2032

  10.2.7 IT Asset Management (ITAM) Software Market Size & Forecast, By Country, 2021 – 2032

   10.2.7.1 USA

    10.2.7.1.1 IT Asset Management (ITAM) Software Market Size & Forecast, By Component, 2021 – 2032

    10.2.7.1.2 IT Asset Management (ITAM) Software Market Size & Forecast, By Organization, 2021 – 2032

    10.2.7.1.3 IT Asset Management (ITAM) Software Market Size & Forecast, By Tools, 2021 – 2032

    10.2.7.1.4 IT Asset Management (ITAM) Software Market Size & Forecast, By End-User, 2021 – 2032

    10.2.7.1.5 IT Asset Management (ITAM) Software Market Size & Forecast, By Deployment, 2021 – 2032

   10.2.7.2 Canada

    10.2.7.2.1 IT Asset Management (ITAM) Software Market Size & Forecast, By Component, 2021 – 2032

    10.2.7.2.2 IT Asset Management (ITAM) Software Market Size & Forecast, By Organization, 2021 – 2032

    10.2.7.2.3 IT Asset Management (ITAM) Software Market Size & Forecast, By Tools, 2021 – 2032

    10.2.7.2.4 IT Asset Management (ITAM) Software Market Size & Forecast, By End-User, 2021 – 2032

    10.2.7.2.5 IT Asset Management (ITAM) Software Market Size & Forecast, By Deployment, 2021 – 2032

10.3 Europe

 10.3.1 Key Trends

 10.3.2 IT Asset Management (ITAM) Software Market Size & Forecast, By Component, 2021 – 2032

 10.3.3 IT Asset Management (ITAM) Software Market Size & Forecast, By Organization, 2021 – 2032

 10.3.4 IT Asset Management (ITAM) Software Market Size & Forecast, By Tools, 2021 – 2032

 10.3.5 IT Asset Management (ITAM) Software Market Size & Forecast, By End-User, 2021 – 2032

 10.3.6 IT Asset Management (ITAM) Software Market Size & Forecast, By Deployment, 2021 – 2032

 10.3.7 IT Asset Management (ITAM) Software Market Size & Forecast, By Country, 2021 – 2032

  10.3.7.1 Germany

   10.3.7.1.1 IT Asset Management (ITAM) Software Market Size & Forecast, By Component, 2021 – 2032

   10.3.7.1.2 IT Asset Management (ITAM) Software Market Size & Forecast, By Organization, 2021 – 2032

   10.3.7.1.3 IT Asset Management (ITAM) Software Market Size & Forecast, By Tools, 2021 – 2032

   10.3.7.1.4 IT Asset Management (ITAM) Software Market Size & Forecast, By End-User, 2021 – 2032

   10.3.7.1.5 IT Asset Management (ITAM) Software Market Size & Forecast, By Deployment, 2021 – 2032

  10.3.7.2 UK

   10.3.7.2.1 IT Asset Management (ITAM) Software Market Size & Forecast, By Component, 2021 – 2032

   10.3.7.2.2 IT Asset Management (ITAM) Software Market Size & Forecast, By Organization, 2021 – 2032

   10.3.7.2.3 IT Asset Management (ITAM) Software Market Size & Forecast, By Tools, 2021 – 2032

   10.3.7.2.4 IT Asset Management (ITAM) Software Market Size & Forecast, By End-User, 2021 – 2032

   10.3.7.2.5 IT Asset Management (ITAM) Software Market Size & Forecast, By Deployment, 2021 – 2032

  10.3.7.3 France

   10.3.7.3.1 IT Asset Management (ITAM) Software Market Size & Forecast, By Component, 2021 – 2032

   10.3.7.3.2 IT Asset Management (ITAM) Software Market Size & Forecast, By Organization, 2021 – 2032

   10.3.7.3.3 IT Asset Management (ITAM) Software Market Size & Forecast, By Tools, 2021 – 2032

   10.3.7.3.4 IT Asset Management (ITAM) Software Market Size & Forecast, By End-User, 2021 – 2032

   10.3.7.3.5 IT Asset Management (ITAM) Software Market Size & Forecast, By Deployment, 2021 – 2032

  10.3.7.4 Italy

   10.3.7.4.1 IT Asset Management (ITAM) Software Market Size & Forecast, By Component, 2021 – 2032

   10.3.7.4.2 IT Asset Management (ITAM) Software Market Size & Forecast, By Organization, 2021 – 2032

   10.3.7.4.3 IT Asset Management (ITAM) Software Market Size & Forecast, By Tools, 2021 – 2032

   10.3.7.4.4 IT Asset Management (ITAM) Software Market Size & Forecast, By End-User, 2021 – 2032

   10.3.7.4.5 IT Asset Management (ITAM) Software Market Size & Forecast, By Deployment, 2021 – 2032

  10.3.7.5 Spain

   10.3.7.5.1 IT Asset Management (ITAM) Software Market Size & Forecast, By Component, 2021 – 2032

   10.3.7.5.2 IT Asset Management (ITAM) Software Market Size & Forecast, By Organization, 2021 – 2032

   10.3.7.5.3 IT Asset Management (ITAM) Software Market Size & Forecast, By Tools, 2021 – 2032

   10.3.7.5.4 IT Asset Management (ITAM) Software Market Size & Forecast, By End-User, 2021 – 2032

   10.3.7.5.5 IT Asset Management (ITAM) Software Market Size & Forecast, By Deployment, 2021 – 2032

  10.3.7.6 Russia

   10.3.7.6.1 IT Asset Management (ITAM) Software Market Size & Forecast, By Component, 2021 – 2032

   10.3.7.6.2 IT Asset Management (ITAM) Software Market Size & Forecast, By Organization, 2021 – 2032

   10.3.7.6.3 IT Asset Management (ITAM) Software Market Size & Forecast, By Tools, 2021 – 2032

   10.3.7.6.4 IT Asset Management (ITAM) Software Market Size & Forecast, By End-User, 2021 – 2032

   10.3.7.6.5 IT Asset Management (ITAM) Software Market Size & Forecast, By Deployment, 2021 – 2032

  10.3.7.7 Poland

   10.3.7.7.1 IT Asset Management (ITAM) Software Market Size & Forecast, By Component, 2021 – 2032

   10.3.7.7.2 IT Asset Management (ITAM) Software Market Size & Forecast, By Organization, 2021 – 2032

   10.3.7.7.3 IT Asset Management (ITAM) Software Market Size & Forecast, By Tools, 2021 – 2032

   10.3.7.7.4 IT Asset Management (ITAM) Software Market Size & Forecast, By End-User, 2021 – 2032

   10.3.7.7.5 IT Asset Management (ITAM) Software Market Size & Forecast, By Deployment, 2021 – 2032

  10.3.7.8 Rest of Europe

   10.3.7.8.1 IT Asset Management (ITAM) Software Market Size & Forecast, By Component, 2021 – 2032

   10.3.7.8.2 IT Asset Management (ITAM) Software Market Size & Forecast, By Organization, 2021 – 2032

   10.3.7.8.3 IT Asset Management (ITAM) Software Market Size & Forecast, By Tools, 2021 – 2032

   10.3.7.8.4 IT Asset Management (ITAM) Software Market Size & Forecast, By End-User, 2021 – 2032

   10.3.7.8.5 IT Asset Management (ITAM) Software Market Size & Forecast, By Deployment, 2021 – 2032

10.4 Asia-Pacific

 10.4.1 Key Trends

 10.4.2 IT Asset Management (ITAM) Software Market Size & Forecast, By Component, 2021 – 2032

 10.4.3 IT Asset Management (ITAM) Software Market Size & Forecast, By Organization, 2021 – 2032

 10.4.4 IT Asset Management (ITAM) Software Market Size & Forecast, By Tools, 2021 – 2032

 10.4.5 IT Asset Management (ITAM) Software Market Size & Forecast, By End-User, 2021 – 2032

 10.4.6 IT Asset Management (ITAM) Software Market Size & Forecast, By Deployment, 2021 – 2032

 10.4.7 IT Asset Management (ITAM) Software Market Size & Forecast, By Country, 2021 – 2032

  10.4.7.1 China

   10.4.7.1.1 IT Asset Management (ITAM) Software Market Size & Forecast, By Component, 2021 – 2032

   10.4.7.1.2 IT Asset Management (ITAM) Software Market Size & Forecast, By Organization, 2021 – 2032

   10.4.7.1.3 IT Asset Management (ITAM) Software Market Size & Forecast, By Tools, 2021 – 2032

   10.4.7.1.4 IT Asset Management (ITAM) Software Market Size & Forecast, By End-User, 2021 – 2032

   10.4.7.1.5 IT Asset Management (ITAM) Software Market Size & Forecast, By Deployment, 2021 – 2032

  10.4.7.2 India

   10.4.7.2.1 IT Asset Management (ITAM) Software Market Size & Forecast, By Component, 2021 – 2032

   10.4.7.2.2 IT Asset Management (ITAM) Software Market Size & Forecast, By Organization, 2021 – 2032

   10.4.7.2.3 IT Asset Management (ITAM) Software Market Size & Forecast, By Tools, 2021 – 2032

   10.4.7.2.4 IT Asset Management (ITAM) Software Market Size & Forecast, By End-User, 2021 – 2032

   10.4.7.2.5 IT Asset Management (ITAM) Software Market Size & Forecast, By Deployment, 2021 – 2032

  10.4.7.3 Japan

   10.4.7.3.1 IT Asset Management (ITAM) Software Market Size & Forecast, By Component, 2021 – 2032

   10.4.7.3.2 IT Asset Management (ITAM) Software Market Size & Forecast, By Organization, 2021 – 2032

   10.4.7.3.3 IT Asset Management (ITAM) Software Market Size & Forecast, By Tools, 2021 – 2032

   10.4.7.3.4 IT Asset Management (ITAM) Software Market Size & Forecast, By End-User, 2021 – 2032

   10.4.7.3.5 IT Asset Management (ITAM) Software Market Size & Forecast, By Deployment, 2021 – 2032

  10.4.7.4 South Korea

   10.4.7.4.1 IT Asset Management (ITAM) Software Market Size & Forecast, By Component, 2021 – 2032

   10.4.7.4.2 IT Asset Management (ITAM) Software Market Size & Forecast, By Organization, 2021 – 2032

   10.4.7.4.3 IT Asset Management (ITAM) Software Market Size & Forecast, By Tools, 2021 – 2032

   10.4.7.4.4 IT Asset Management (ITAM) Software Market Size & Forecast, By End-User, 2021 – 2032

   10.4.7.4.5 IT Asset Management (ITAM) Software Market Size & Forecast, By Deployment, 2021 – 2032

  10.4.7.5 Australia

   10.4.7.5.1 IT Asset Management (ITAM) Software Market Size & Forecast, By Component, 2021 – 2032

   10.4.7.5.2 IT Asset Management (ITAM) Software Market Size & Forecast, By Organization, 2021 – 2032

   10.4.7.5.3 IT Asset Management (ITAM) Software Market Size & Forecast, By Tools, 2021 – 2032

   10.4.7.5.4 IT Asset Management (ITAM) Software Market Size & Forecast, By End-User, 2021 – 2032

   10.4.7.5.5 IT Asset Management (ITAM) Software Market Size & Forecast, By Deployment, 2021 – 2032

  10.4.7.6 ASEAN Countries

   10.4.7.6.1 IT Asset Management (ITAM) Software Market Size & Forecast, By Component, 2021 – 2032

   10.4.7.6.2 IT Asset Management (ITAM) Software Market Size & Forecast, By Organization, 2021 – 2032

   10.4.7.6.3 IT Asset Management (ITAM) Software Market Size & Forecast, By Tools, 2021 – 2032

   10.4.7.6.4 IT Asset Management (ITAM) Software Market Size & Forecast, By End-User, 2021 – 2032

   10.4.7.6.5 IT Asset Management (ITAM) Software Market Size & Forecast, By Deployment, 2021 – 2032

  10.4.7.7 Rest of Asia-Pacific

   10.4.7.7.1 IT Asset Management (ITAM) Software Market Size & Forecast, By Component, 2021 – 2032

   10.4.7.7.2 IT Asset Management (ITAM) Software Market Size & Forecast, By Organization, 2021 – 2032

   10.4.7.7.3 IT Asset Management (ITAM) Software Market Size & Forecast, By Tools, 2021 – 2032

   10.4.7.7.4 IT Asset Management (ITAM) Software Market Size & Forecast, By End-User, 2021 – 2032

   10.4.7.7.5 IT Asset Management (ITAM) Software Market Size & Forecast, By Deployment, 2021 – 2032

10.5 Latin America

 10.5.1 Key Trends

 10.5.2 IT Asset Management (ITAM) Software Market Size & Forecast, By Component, 2021 – 2032

 10.5.3 IT Asset Management (ITAM) Software Market Size & Forecast, By Organization, 2021 – 2032

 10.5.4 IT Asset Management (ITAM) Software Market Size & Forecast, By Tools, 2021 – 2032

 10.5.5 IT Asset Management (ITAM) Software Market Size & Forecast, By End-User, 2021 – 2032

 10.5.6 IT Asset Management (ITAM) Software Market Size & Forecast, By Deployment, 2021 – 2032

 10.5.7 IT Asset Management (ITAM) Software Market Size & Forecast, By Country, 2021 – 2032

  10.5.7.1 Brazil

   10.5.7.1.1 IT Asset Management (ITAM) Software Market Size & Forecast, By Component, 2021 – 2032

   10.5.7.1.2 IT Asset Management (ITAM) Software Market Size & Forecast, By Organization, 2021 – 2032

   10.5.7.1.3 IT Asset Management (ITAM) Software Market Size & Forecast, By Tools, 2021 – 2032

   10.5.7.1.4 IT Asset Management (ITAM) Software Market Size & Forecast, By End-User, 2021 – 2032

   10.5.7.1.5 IT Asset Management (ITAM) Software Market Size & Forecast, By Deployment, 2021 – 2032

  10.5.7.2 Argentina

   10.5.7.2.1 IT Asset Management (ITAM) Software Market Size & Forecast, By Component, 2021 – 2032

   10.5.7.2.2 IT Asset Management (ITAM) Software Market Size & Forecast, By Organization, 2021 – 2032

   10.5.7.2.3 IT Asset Management (ITAM) Software Market Size & Forecast, By Tools, 2021 – 2032

   10.5.7.2.4 IT Asset Management (ITAM) Software Market Size & Forecast, By End-User, 2021 – 2032

   10.5.7.2.5 IT Asset Management (ITAM) Software Market Size & Forecast, By Deployment, 2021 – 2032

  10.5.7.3 Mexico

   10.5.7.3.1 IT Asset Management (ITAM) Software Market Size & Forecast, By Component, 2021 – 2032

   10.5.7.3.2 IT Asset Management (ITAM) Software Market Size & Forecast, By Organization, 2021 – 2032

   10.5.7.3.3 IT Asset Management (ITAM) Software Market Size & Forecast, By Tools, 2021 – 2032

   10.5.7.3.4 IT Asset Management (ITAM) Software Market Size & Forecast, By End-User, 2021 – 2032

   10.5.7.3.5 IT Asset Management (ITAM) Software Market Size & Forecast, By Deployment, 2021 – 2032

  10.5.7.4 Colombia

   10.5.7.4.1 IT Asset Management (ITAM) Software Market Size & Forecast, By Component, 2021 – 2032

   10.5.7.4.2 IT Asset Management (ITAM) Software Market Size & Forecast, By Organization, 2021 – 2032

   10.5.7.4.3 IT Asset Management (ITAM) Software Market Size & Forecast, By Tools, 2021 – 2032

   10.5.7.4.4 IT Asset Management (ITAM) Software Market Size & Forecast, By End-User, 2021 – 2032

   10.5.7.4.5 IT Asset Management (ITAM) Software Market Size & Forecast, By Deployment, 2021 – 2032

  10.5.7.5 Rest of Latin America

   10.5.7.5.1 IT Asset Management (ITAM) Software Market Size & Forecast, By Component, 2021 – 2032

   10.5.7.5.2 IT Asset Management (ITAM) Software Market Size & Forecast, By Organization, 2021 – 2032

   10.5.7.5.3 IT Asset Management (ITAM) Software Market Size & Forecast, By Tools, 2021 – 2032

   10.5.7.5.4 IT Asset Management (ITAM) Software Market Size & Forecast, By End-User, 2021 – 2032

   10.5.7.5.5 IT Asset Management (ITAM) Software Market Size & Forecast, By Deployment, 2021 – 2032

10.6 Middle East & Africa

 10.6.1 Key Trends

 10.6.2 IT Asset Management (ITAM) Software Market Size & Forecast, By Component, 2021 – 2032

 10.6.3 IT Asset Management (ITAM) Software Market Size & Forecast, By Organization, 2021 – 2032

 10.6.4 IT Asset Management (ITAM) Software Market Size & Forecast, By Tools, 2021 – 2032

 10.6.5 IT Asset Management (ITAM) Software Market Size & Forecast, By End-User, 2021 – 2032

 10.6.6 IT Asset Management (ITAM) Software Market Size & Forecast, By Deployment, 2021 – 2032

 10.6.7 IT Asset Management (ITAM) Software Market Size & Forecast, By Country, 2021 – 2032

  10.6.7.1 UAE

   10.6.7.1.1 IT Asset Management (ITAM) Software Market Size & Forecast, By Component, 2021 – 2032

   10.6.7.1.2 IT Asset Management (ITAM) Software Market Size & Forecast, By Organization, 2021 – 2032

   10.6.7.1.3 IT Asset Management (ITAM) Software Market Size & Forecast, By Tools, 2021 – 2032

   10.6.7.1.4 IT Asset Management (ITAM) Software Market Size & Forecast, By End-User, 2021 – 2032

   10.6.7.1.5 IT Asset Management (ITAM) Software Market Size & Forecast, By Deployment, 2021 – 2032

  10.6.7.2 Saudi Arabia

   10.6.7.2.1 IT Asset Management (ITAM) Software Market Size & Forecast, By Component, 2021 – 2032

   10.6.7.2.2 IT Asset Management (ITAM) Software Market Size & Forecast, By Organization, 2021 – 2032

   10.6.7.2.3 IT Asset Management (ITAM) Software Market Size & Forecast, By Tools, 2021 – 2032

   10.6.7.2.4 IT Asset Management (ITAM) Software Market Size & Forecast, By End-User, 2021 – 2032

   10.6.7.2.5 IT Asset Management (ITAM) Software Market Size & Forecast, By Deployment, 2021 – 2032

  10.6.7.3 Qatar

   10.6.7.3.1 IT Asset Management (ITAM) Software Market Size & Forecast, By Component, 2021 – 2032

   10.6.7.3.2 IT Asset Management (ITAM) Software Market Size & Forecast, By Organization, 2021 – 2032

   10.6.7.3.3 IT Asset Management (ITAM) Software Market Size & Forecast, By Tools, 2021 – 2032

   10.6.7.3.4 IT Asset Management (ITAM) Software Market Size & Forecast, By End-User, 2021 – 2032

   10.6.7.3.5 IT Asset Management (ITAM) Software Market Size & Forecast, By Deployment, 2021 – 2032

  10.6.7.4 Egypt

   10.6.7.4.1 IT Asset Management (ITAM) Software Market Size & Forecast, By Component, 2021 – 2032

   10.6.7.4.2 IT Asset Management (ITAM) Software Market Size & Forecast, By Organization, 2021 – 2032

   10.6.7.4.3 IT Asset Management (ITAM) Software Market Size & Forecast, By Tools, 2021 – 2032

   10.6.7.4.4 IT Asset Management (ITAM) Software Market Size & Forecast, By End-User, 2021 – 2032

   10.6.7.4.5 IT Asset Management (ITAM) Software Market Size & Forecast, By Deployment, 2021 – 2032

  10.6.7.5 South Africa

   10.6.7.5.1 IT Asset Management (ITAM) Software Market Size & Forecast, By Component, 2021 – 2032

   10.6.7.5.2 IT Asset Management (ITAM) Software Market Size & Forecast, By Organization, 2021 – 2032

   10.6.7.5.3 IT Asset Management (ITAM) Software Market Size & Forecast, By Tools, 2021 – 2032

   10.6.7.5.4 IT Asset Management (ITAM) Software Market Size & Forecast, By End-User, 2021 – 2032

   10.6.7.5.5 IT Asset Management (ITAM) Software Market Size & Forecast, By Deployment, 2021 – 2032

  10.6.7.6 Rest of Middle East & Africa

   10.6.7.6.1 IT Asset Management (ITAM) Software Market Size & Forecast, By Component, 2021 – 2032

   10.6.7.6.2 IT Asset Management (ITAM) Software Market Size & Forecast, By Organization, 2021 – 2032

   10.6.7.6.3 IT Asset Management (ITAM) Software Market Size & Forecast, By Tools, 2021 – 2032

   10.6.7.6.4 IT Asset Management (ITAM) Software Market Size & Forecast, By End-User, 2021 – 2032

   10.6.7.6.5 IT Asset Management (ITAM) Software Market Size & Forecast, By Deployment, 2021 – 2032

11. Competitive Landscape

 11.1 Key Players' Positioning

 11.2 Competitive Developments

  11.2.1 Key Strategies Adopted (%), By Key Players, 2024

  11.2.2 Year-Wise Strategies & Development, 2021 – 2025

  11.2.3 Number Of Strategies Adopted By Key Players, 2024

 11.3 Market Share Analysis, 2024

 11.4 Product/Service & Application Benchmarking

  11.4.1 Product/Service Specifications & Features By Key Players

  11.4.2 Product/Service Heatmap By Key Players

  11.4.3 Application Heatmap By Key Players

 11.5 Industry Start-Up & Innovation Landscape

 11.6 Key Company Profiles

11.6 Key Company Profiles

 11.6.1 Dell Technologies Inc.

  11.6.1.1 Company Overview & Snapshot

  11.6.1.2 Product/Service Portfolio

  11.6.1.3 Key Company Financials

  11.6.1.4 SWOT Analysis

 11.6.2 Microsoft Corporation

  11.6.2.1 Company Overview & Snapshot

  11.6.2.2 Product/Service Portfolio

  11.6.2.3 Key Company Financials

  11.6.2.4 SWOT Analysis

 11.6.3 International Business Machines Corporation

  11.6.3.1 Company Overview & Snapshot

  11.6.3.2 Product/Service Portfolio

  11.6.3.3 Key Company Financials

  11.6.3.4 SWOT Analysis

 11.6.4 BMC Software, Inc.

  11.6.4.1 Company Overview & Snapshot

  11.6.4.2 Product/Service Portfolio

  11.6.4.3 Key Company Financials

  11.6.4.4 SWOT Analysis

 11.6.5 HP Inc.

  11.6.5.1 Company Overview & Snapshot

  11.6.5.2 Product/Service Portfolio

  11.6.5.3 Key Company Financials

  11.6.5.4 SWOT Analysis

 11.6.6 ServiceNow, Inc.

  11.6.6.1 Company Overview & Snapshot

  11.6.6.2 Product/Service Portfolio

  11.6.6.3 Key Company Financials

  11.6.6.4 SWOT Analysis

 11.6.7 Oracle Corporation

  11.6.7.1 Company Overview & Snapshot

  11.6.7.2 Product/Service Portfolio

  11.6.7.3 Key Company Financials

  11.6.7.4 SWOT Analysis

 11.6.8 Flexera Software LLC

  11.6.8.1 Company Overview & Snapshot

  11.6.8.2 Product/Service Portfolio

  11.6.8.3 Key Company Financials

  11.6.8.4 SWOT Analysis

 11.6.9 Ivanti, Inc.

  11.6.9.1 Company Overview & Snapshot

  11.6.9.2 Product/Service Portfolio

  11.6.9.3 Key Company Financials

  11.6.9.4 SWOT Analysis

 11.6.10 USU Software AG (Aspera GmbH)

  11.6.10.1 Company Overview & Snapshot

  11.6.10.2 Product/Service Portfolio

  11.6.10.3 Key Company Financials

  11.6.10.4 SWOT Analysis

 11.6.11 Cherwell Software, LLC

  11.6.11.1 Company Overview & Snapshot

  11.6.11.2 Product/Service Portfolio

  11.6.11.3 Key Company Financials

  11.6.11.4 SWOT Analysis

 11.6.12 Snow Software AB

  11.6.12.1 Company Overview & Snapshot

  11.6.12.2 Product/Service Portfolio

  11.6.12.3 Key Company Financials

  11.6.12.4 SWOT Analysis

 11.6.13 Broadcom Inc.

  11.6.13.1 Company Overview & Snapshot

  11.6.13.2 Product/Service Portfolio

  11.6.13.3 Key Company Financials

  11.6.13.4 SWOT Analysis

 11.6.14 Freshworks Inc.

  11.6.14.1 Company Overview & Snapshot

  11.6.14.2 Product/Service Portfolio

  11.6.14.3 Key Company Financials

  11.6.14.4 SWOT Analysis

 11.6.15 Axonius, Inc.

  11.6.15.1 Company Overview & Snapshot

  11.6.15.2 Product/Service Portfolio

  11.6.15.3 Key Company Financials

  11.6.15.4 SWOT Analysis

 11.6.16 Zoho Corporation Pvt. Ltd. (ManageEngine)

  11.6.16.1 Company Overview & Snapshot

  11.6.16.2 Product/Service Portfolio

  11.6.16.3 Key Company Financials

  11.6.16.4 SWOT Analysis

 11.6.17 SolarWinds Corporation

  11.6.17.1 Company Overview & Snapshot

  11.6.17.2 Product/Service Portfolio

  11.6.17.3 Key Company Financials

  11.6.17.4 SWOT Analysis

 11.6.18 Micro Focus International plc (an OpenText company)

  11.6.18.1 Company Overview & Snapshot

  11.6.18.2 Product/Service Portfolio

  11.6.18.3 Key Company Financials

  11.6.18.4 SWOT Analysis

 11.6.19 Lansweeper NV

  11.6.19.1 Company Overview & Snapshot

  11.6.19.2 Product/Service Portfolio

  11.6.19.3 Key Company Financials

  11.6.19.4 SWOT Analysis

 11.6.20 Qualys, Inc.

  11.6.20.1 Company Overview & Snapshot

  11.6.20.2 Product/Service Portfolio

  11.6.20.3 Key Company Financials

  11.6.20.4 SWOT Analysis

12. Analyst Recommendations

 12.1 SNS Insider Opportunity Map

 12.2 Industry Low-Hanging Fruit Assessment

 12.3 Market Entry & Growth Strategy

 12.4 Analyst Viewpoint & Suggestions On Market Growth

13. Assumptions

14. Disclaimer

15. Appendix

 15.1 List Of Tables

 15.2 List Of Figure

Key Segments:

By Component

  • Hardware

  • Software

  • Service

By Organization

  • SME

  • Large Enterprise

By Deployment

  • On-Cloud

  • On-Premise

By Tools

  • Discovery/ Automated Inventory

  • License Management

  • Patch & Version Management

  • Request Management

  • Product/Service Catalog

  • Digital Asset Management

  • Others

By End-User

  • BFSI

  • Retail

  • Aerospace & Defense

  • IT & Telecom

Request for Segment Customization as per your Business Requirement: Segment Customization Request

REGIONAL COVERAGE:

North America

  • US

  • Canada

  • Mexico

Europe

  • Eastern Europe

    • Poland

    • Romania

    • Hungary

    • Turkey

    • Rest of Eastern Europe

  • Western Europe

    • Germany

    • France

    • UK

    • Italy

    • Spain

    • Netherlands

    • Switzerland

    • Austria

    • Rest of Western Europe

Asia Pacific

  • China

  • India

  • Japan

  • South Korea

  • Vietnam

  • Singapore

  • Australia

  • Rest of Asia Pacific

Middle East & Africa

  • Middle East

    • UAE

    • Egypt

    • Saudi Arabia

    • Qatar

    • Rest of the Middle East

  • Africa

    • Nigeria

    • South Africa

    • Rest of Africa

Latin America

  • Brazil

  • Argentina

  • Colombia

Request for Country Level Research Report: Country Level Customization Request

Available Customization

With the given market data, SNS Insider offers customization as per the company’s specific needs. The following customization options are available for the report:

  • Product Analysis

  • Criss-Cross segment analysis (e.g. Product X Application)

  • Product Matrix which gives a detailed comparison of product portfolio of each company

  • Geographic Analysis

  • Additional countries in any of the regions

  • Company Information

  • Detailed analysis and profiling of additional market players (Up to five)

An accurate research report requires proper strategizing as well as implementation. There are multiple factors involved in the completion of good and accurate research report and selecting the best methodology to compete the research is the toughest part. Since the research reports we provide play a crucial role in any company’s decision-making process, therefore we at SNS Insider always believe that we should choose the best method which gives us results closer to reality. This allows us to reach at a stage wherein we can provide our clients best and accurate investment to output ratio.

Each report that we prepare takes a timeframe of 350-400 business hours for production. Starting from the selection of titles through a couple of in-depth brain storming session to the final QC process before uploading our titles on our website we dedicate around 350 working hours. The titles are selected based on their current market cap and the foreseen CAGR and growth.


The 5 steps process:

Step 1: Secondary Research:

Secondary Research or Desk Research is as the name suggests is a research process wherein, we collect data through the readily available information. In this process we use various paid and unpaid databases which our team has access to and gather data through the same. This includes examining of listed companies’ annual reports, Journals, SEC filling etc. Apart from this our team has access to various associations across the globe across different industries. Lastly, we have exchange relationships with various university as well as individual libraries.

Secondary Research

Step 2: Primary Research

When we talk about primary research, it is a type of study in which the researchers collect relevant data samples directly, rather than relying on previously collected data.  This type of research is focused on gaining content specific facts that can be sued to solve specific problems. Since the collected data is fresh and first hand therefore it makes the study more accurate and genuine.

We at SNS Insider have divided Primary Research into 2 parts.

Part 1 wherein we interview the KOLs of major players as well as the upcoming ones across various geographic regions. This allows us to have their view over the market scenario and acts as an important tool to come closer to the accurate market numbers. As many as 45 paid and unpaid primary interviews are taken from both the demand and supply side of the industry to make sure we land at an accurate judgement and analysis of the market.

This step involves the triangulation of data wherein our team analyses the interview transcripts, online survey responses and observation of on filed participants. The below mentioned chart should give a better understanding of the part 1 of the primary interview.

Primary Research

Part 2: In this part of primary research the data collected via secondary research and the part 1 of the primary research is validated with the interviews from individual consultants and subject matter experts.

Consultants are those set of people who have at least 12 years of experience and expertise within the industry whereas Subject Matter Experts are those with at least 15 years of experience behind their back within the same space. The data with the help of two main processes i.e., FGDs (Focused Group Discussions) and IDs (Individual Discussions). This gives us a 3rd party nonbiased primary view of the market scenario making it a more dependable one while collation of the data pointers.

Step 3: Data Bank Validation

Once all the information is collected via primary and secondary sources, we run that information for data validation. At our intelligence centre our research heads track a lot of information related to the market which includes the quarterly reports, the daily stock prices, and other relevant information. Our data bank server gets updated every fortnight and that is how the information which we collected using our primary and secondary information is revalidated in real time.

Data Bank Validation

Step 4: QA/QC Process

After all the data collection and validation our team does a final level of quality check and quality assurance to get rid of any unwanted or undesired mistakes. This might include but not limited to getting rid of the any typos, duplication of numbers or missing of any important information. The people involved in this process include technical content writers, research heads and graphics people. Once this process is completed the title gets uploader on our platform for our clients to read it.

Step 5: Final QC/QA Process:

This is the last process and comes when the client has ordered the study. In this process a final QA/QC is done before the study is emailed to the client. Since we believe in giving our clients a good experience of our research studies, therefore, to make sure that we do not lack at our end in any way humanly possible we do a final round of quality check and then dispatch the study to the client.