Enterprise Architecture Tools Market Size & Outlook:
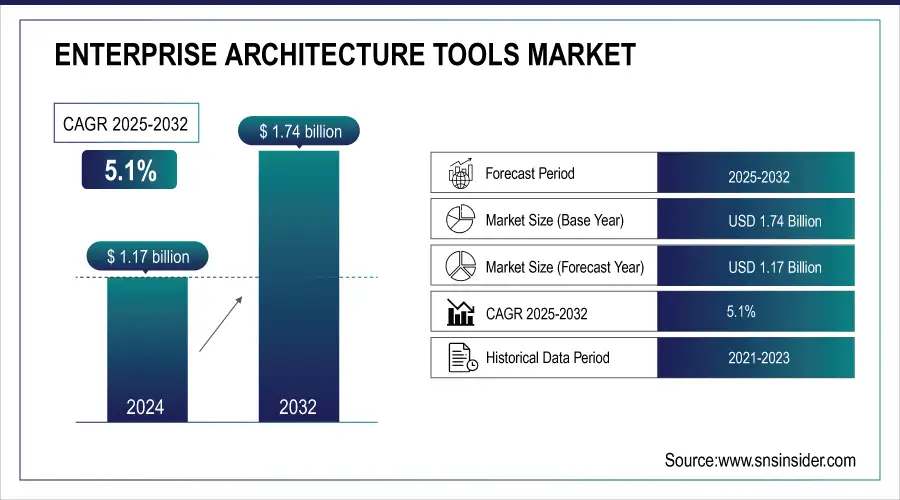
The Enterprise Architecture Tools Market Size was valued at USD 1.17 billion in 2024 and is expected to reach USD 1.74 billion by 2032, growing at a CAGR of 5.1% over the forecast period of 2025-2032.
To Get More Information on Enterprise Architecture Tools Market - Request Sample Report
The enterprise architecture (EA) tools market is gaining momentum as organizations globally seek solutions to align IT infrastructure with business objectives. A significant driver is the increasing focus on digital transformation initiatives supported by governmental policies. According to the U.S. Bureau of Labor Statistics (2024), IT spending in the federal sector is projected to grow by 6.8% annually, with substantial allocations for modernization programs. Organizations use EA to manage IT environments, optimize costs, reduce redundancies, and support digital transformation. Frameworks like TOGAF 9.2 and global standards such as the European Interoperability Framework (EIF) and the U.S. Federal Enterprise Architecture (FEA) guide businesses in adopting EA as a strategic tool to simplify complexities, minimize risks, and enhance efficiency.
Key Trends Shaping the Enterprise Architecture Tools Market
-
Increased Digital Transformation: Rising enterprise adoption of cloud, AI, and IoT accelerates demand for enterprise architecture tools to optimize IT ecosystems.
-
Data-Driven Decision-Making: Organizations are leveraging advanced analytics and real-time insights from enterprise architecture tools to align technology investments with business goals.
-
Cloud-Native Solutions: Growth of cloud-native and SaaS-based enterprise architecture tools enhances scalability, collaboration, and integration across hybrid IT environments.
-
Agile & DevOps Alignment: Tools increasingly support agile frameworks and DevOps practices, enabling faster innovation cycles and continuous delivery in enterprises.
-
Regulatory Compliance Focus: Enterprises adopt EA tools to ensure adherence to evolving regulations, data privacy laws, and cybersecurity frameworks.
-
Competitive Landscape: The market is fragmented, with players expanding capabilities through AI integration, partnerships, and acquisitions to strengthen their portfolios.
Enterprise Architecture Tools Market Driver:
-
The shift toward cloud-based solutions drives demand for enterprise architecture tools that support scalable and flexible deployments. Hybrid work models have increased the need for these tools to manage distributed systems effectively across geographies.
-
Rising cyber threats and stringent regulations like GDPR are prompting businesses to integrate robust security measures within their architecture.
-
Enterprises are adopting energy-efficient tools to align with global sustainability goals, reducing operational costs and environmental impact.
-
IoT integration is revolutionizing operations, enabling real-time data insights and streamlined processes. The rollout of 5G is further enhancing these tools' capabilities by improving data transfer speeds and connectivity across platforms.
Growth in sophisticated cyber threats and stricter data privacy regulation enforcement have emerged as key drivers for the adoption of enterprise architecture tools. Global incidents spiked in 2023 with nearly 76% of organizations reporting at least one ransomware attack, highlighting the increasing demand for architecture solutions that prioritize secure and compliance frameworks. This led to the emergence of enterprise architecture tools incorporating advanced cybersecurity mechanisms including real-time threat recognition and automated compliance audits to help ease these concerns. Microsoft for example has Azure Enterprise Architecture Framework wherein multi-layered security and compliance are proactively planned and aligned with the required standards such as GDPR, HIPAA, etc. They assist companies in navigating complex data governance frameworks, which lowers the risk of penalties associated with data breaches.
The drive toward enhancing cybersecurity is also supported by industry initiatives. For example, the Cyber Resilience Act introduced by the European Union recently demands stricter security measures across digital infrastructures, forcing organizations to utilize tools that comply with the requirements. In addition, 61% of CIOs in a recent survey reported that cybersecurity was a top priority for their planning of enterprise architecture in 2024. They enable greater protection and strengthen customer trust by embedding these capabilities in EA tools creating a secure and trustworthy digital ecosystem for organizations globally.
Enterprise Architecture Tools Market Restraints:
-
Enterprise architecture tools require significant investment, especially for customization and training, deterring smaller organizations.
-
The intricate nature of these tools demands skilled personnel, which can be a barrier for organizations with limited technical expertise.
-
Ensuring seamless integration with legacy systems remains a critical challenge, impacting operational efficiency.
The major limitation in the Enterprise Architecture tools market is deployment and usage complexities. Because they are often powered with advanced capabilities to handle complex IT landscapes and they often become complicated for organizations that do not have enough technical expertise. The fact that the tools need to be set up for the specific needs of the enterprise will require specialists to handle the implementation process. Such complexity leads to long deployments and more operational downtime through the transition period.
Moreover, the steep learning curve associated with these tools poses challenges in ensuring seamless adoption by users. Organizations may need to invest heavily in training and onboarding initiatives to equip teams with the skills necessary to utilize the tools effectively. Such barriers can deter businesses from adopting these solutions, especially if they lack the resources to overcome the associated technical and human capital challenges.
Enterprise Architecture Tools Market Segmentation analysis
-
By Component, Solutions Segment Leads with Over 62% Market Share Driven by Integrated Use Cases and Government Initiatives
The solutions segment accounted for more than 62% of revenue share in the EA tools market in 2024. This dominance is driven by the increasing demand for integrated solutions that combine multiple use cases like data modeling, IT asset management, and business process analysis. Government data further emphasizes this trend. One example is the U.S. Federal Enterprise Architecture Framework (FEAF), which encourages the alignment of shared tools for interoperability between federal agencies. Digital Administration 2023, Germany has similarly earmarked substantial funds in the area of architecture management within public admin planning. The segmentation of solutions over services is higher, organizations look out for solutions rather than simply a service due to high end-to-end visibility offering capabilities and timely strategic decision-making.
-
By Deployment, Cloud Deployment Captures 52% Share in 2024 Fueled by Scalability, Cost Efficiency, and Government Cloud-First Policies
In 2024, the cloud segment held more than 52% of the revenue share thanks to the progressive company migration to flexible, scalable, and cost-effective deployment options. According to a recent report in 2024, approximately 41% of European enterprises utilized cloud computing services, a rise from 36% in 2024. These early adopters are receiving a boost from governments of the U.K. has introduced the "Cloud First Policy," which encourages public sector organizations to opt for EAs based on the cloud. The scalability and lower capital investment associated with cloud deployments are crucial for their growing adoption, particularly in small and medium enterprises (SMEs) that seek high-value returns at reduced costs.
-
By Enterprise Size, Large Enterprises Dominate with 68% Share Backed by Heavy IT Investments and Digital Transformation Spending
The largest revenue share of over 68% in 2024 was contributed by large enterprises. This dominance is attributed to the huge investment that these organizations make towards IT infrastructure and business strategy. According to the Indian Ministry of Corporate Affairs (2024), 74% of listed companies with turnover greater than INR 500 crores ($60 million) have turned to EA solutions to improve their operations. In 2023, U.S. Fortune 500 corporations also spent over one trillion dollars combined spending on digital transformation which further supports that EA tools are critical to the success of organizational initiatives both small and large. EA tools help larger organizations as they can handle complex organizational structures and integrate with varied systems.
-
By End Use, IT & Telecom Industry Accounts for 34% Share as Governments Prioritize Digital Infrastructure and Telecom Investments
The IT & telecom segment was the leading end-use industry for EA tools globally in 2024, accounting for 34% of the market share. Governments around the world understand the role of digital infrastructure, particularly in telecommunications. In 2024, investment spending in the telecom sector grew 7.5%, according to the U.S. Federal Communications Commission (FCC.) Similarly, China devoted billions of dollars to support its IT ecosystems as part of its "New Infrastructure Plan." Complex telecom operations and real-time insights with a need for seamless integration across varied networks are what make enterprise architecture tools a common adoption for the industry.
Enterprise Architecture Tools Market Regional Analysis
-
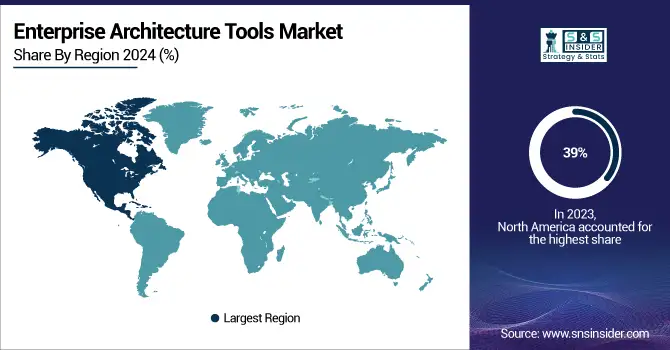
North America Enterprise Architecture Tools Market Insights
In 2024, North America dominates the Enterprise Architecture Tools Market with an estimated share of 39%, driven by large-scale digital transformation, strong IT infrastructure, and early adoption of cloud technologies. The region benefits from high enterprise IT spending, advanced data compliance frameworks, and government support for digital modernization, fostering widespread deployment of enterprise architecture tools across industries such as IT, telecom, BFSI, and manufacturing.
Do You Need any Customization Research on Enterprise Architecture Tools Market - Enquire Now
-
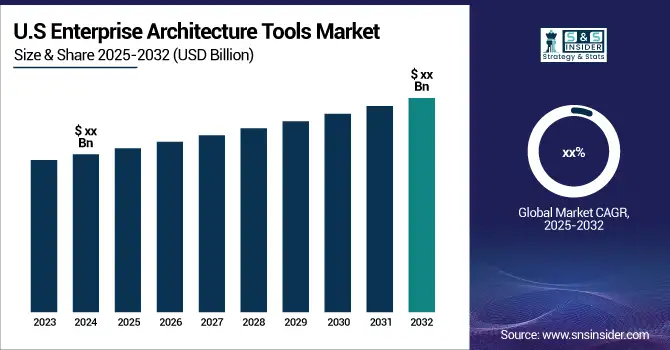
United States Leads Enterprise Architecture Tools Market in North America
The U.S. leads the regional market, supported by Fortune 500 enterprises investing heavily in IT modernization, cloud migration, and business strategy alignment. Strong government initiatives like the Federal Enterprise Architecture Framework (FEAF) and high spending on digital transformation ensure sustained demand. The U.S. dominance stems from its robust enterprise ecosystem, corporate technology adoption, and leadership in advanced IT frameworks, making it the key driver of growth in North America.
-
Asia Pacific Enterprise Architecture Tools Market Insights
Asia Pacific is the fastest-growing region with an estimated CAGR of 17% in 2024, fueled by rapid enterprise digitization, government-backed infrastructure projects, and rising IT investments. The growth is supported by large-scale adoption of smart technologies, expansion of telecom networks, and demand for process standardization. Enterprises in the region are increasingly leveraging enterprise architecture tools to improve efficiency, optimize resources, and strengthen digital strategies.
-
China Leads Enterprise Architecture Tools Market Growth in Asia Pacific
China dominates the Asia Pacific market due to massive government investments in “New Infrastructure” projects, rapid industrial digitalization, and strong adoption of enterprise IT frameworks. Its large enterprise ecosystem and strong demand for business transformation accelerate growth. With investments in cloud computing, AI, and smart manufacturing, China drives regional momentum, positioning itself as the largest and fastest-growing market for enterprise architecture tools in Asia Pacific.
-
Europe Enterprise Architecture Tools Market Insights
In 2024, Europe holds a significant share of the Enterprise Architecture Tools Market, supported by strict EU data compliance rules, digital transformation initiatives, and enterprise IT modernization. The adoption of enterprise architecture solutions is boosted by increasing demand for process standardization and long-term IT planning, particularly in industries like BFSI, government, and manufacturing. Regional growth is further supported by strong government investment in digital infrastructure and interoperability frameworks.
-
Germany Dominates Europe’s Enterprise Architecture Tools Market
Germany leads Europe with advanced industrial adoption, strong public digital administration initiatives, and structured enterprise IT governance. Investments under the “Digital Administration 2023” program emphasize enterprise architecture for efficiency and modernization. Germany’s leadership stems from its strong industrial base, focus on interoperability, and innovation-driven IT frameworks, making it the most influential market for EA tools in the region.
-
Latin America and Middle East & Africa Enterprise Architecture Tools Market Insights
The Enterprise Architecture Tools Market in Latin America and MEA is experiencing steady growth in 2024, supported by increasing IT adoption, growing enterprise demand for cloud-based tools, and government-backed digital initiatives. Rising investments in IT modernization, enterprise mobility, and cloud transformation are creating strong opportunities for EA tool deployment across industries like telecom, BFSI, and government services.
-
Regional Leaders in Latin America and MEA
Brazil leads Latin America with a large enterprise base, expanding IT infrastructure, and rising adoption of EA solutions for operational efficiency. In the Middle East & Africa, the UAE dominates, supported by smart city initiatives, government-backed IT modernization, and corporate adoption of digital transformation strategies. Both regions are set to emerge as strategic growth hubs for enterprise architecture tools.
Competitive Landscape Enterprise Architecture Tools Market:
ValueBlue
ValueBlue is a Netherlands-based enterprise software company known for its flagship platform, BlueDolphin, which provides collaborative enterprise architecture and business process management solutions. The platform enables organizations to align IT with business strategy, streamline digital transformation, and ensure agility in operations. By offering features like process modeling, application lifecycle management, and IT portfolio management, ValueBlue helps enterprises gain transparency and efficiency. Trusted across industries such as healthcare, finance, and government, the company emphasizes cloud-based deployment and user collaboration, supporting organizations in adapting to rapid change and achieving long-term digital growth.
-
In September 2024, ValueBlue partnered with Iasa Global, a global association for all technology architects, to enhance career guidance and training for architects in the Netherlands. The collaboration combines Iasa Global’s global frameworks with ValueBlue’s BlueDolphin platform, offering architects training, networking, and tools to drive innovation and support business transformations through advanced architecture strategies.
Sparx Systems Pty Ltd.
Sparx Systems Pty Ltd., headquartered in Australia, is a global leader in modeling and design software, best known for its flagship product, Enterprise Architect. The platform is widely used for enterprise architecture, systems engineering, software development, and business process modeling. It supports international standards such as UML, BPMN, SysML, and ArchiMate, ensuring broad usability across industries. With a customer base spanning Fortune 500 companies, government agencies, and educational institutions, Sparx Systems focuses on affordability, scalability, and interoperability, making it a trusted choice for complex architecture and engineering projects worldwide.
-
In January 2024, Sparx Systems Pty Ltd. completed the acquisition of Prolaborate, a platform designed for collaborative enterprise architecture. The acquisition aimed to strengthen Sparx Systems Pty Ltd.’s Enterprise Architect platform, allowing better collaboration, data visualization, and stakeholder engagement. The move aligned with Sparx Systems Pty Ltd.’s goal to expand its offerings in the enterprise architecture domain.
Enterprise Architecture Tools Market Companies:
-
Software AG
-
Mega International
-
BiZZdesign
-
Avolution(ABACUS)
-
BOC Group (ADOIT)
-
LeanIX (SAP Company)
-
Planview
-
Erwin, Inc. (Quest Software)
-
QualiWare
-
ValueBlue (BlueDolphin)
-
Fios Insight
-
Enterprise Architecture Solutions (EAS)
-
Unicom Systems, Inc.
-
Ardoq
-
Capsifi
-
Benchmark Consulting (Architecture Repository)
-
Innoslate (SPEC Innovations)
| Report Attributes | Details |
| Market Size in 2024 | US$ 1.17 Billion |
| Market Size by 2032 | US$ 1.74 Billion |
| CAGR | CAGR of 5.1% from 2024 to 2032 |
| Base Year | 2024 |
| Forecast Period | 2025-2032 |
| Historical Data | 2021-2023 |
| Report Scope & Coverage | Market Size, Segments Analysis, Competitive Landscape, Regional Analysis, DROC & SWOT Analysis, Forecast Outlook |
| Key Segments | • By Component (Solution, Services) • By Deployment (On-premise, Cloud) • By Solution (Infrastructure Architecture, Application Architecture, Data Architecture, Security Architecture, Others) • By Services (Managed, Professional) • By Enterprise Size (Large Enterprises, Small and Medium-sized Enterprises) • By End-use (BFSI, Consumer Goods and Retail, IT & Telecom, Manufacturing, Healthcare, Others) |
| Regional Analysis/Coverage | North America (US, Canada), Europe (Germany, UK, France, Italy, Spain, Russia, Poland, Rest of Europe), Asia Pacific (China, India, Japan, South Korea, Australia, ASEAN Countries, Rest of Asia Pacific), Middle East & Africa (UAE, Saudi Arabia, Qatar, South Africa, Rest of Middle East & Africa), Latin America (Brazil, Argentina, Mexico, Colombia, Rest of Latin America). |
| Company Profiles | SAP SE, IBM Corporation, Orbus Software, Sparx Systems, Software AG, MEGA International, BiZZdesign, Avolution, Planview, LeanIX GmbH. |
Frequently Asked Questions
Ans. The cloud deployment segment dominated the Enterprise Architecture Tools Market in 2024.
Ans. The North American region dominated the Enterprise Architecture Tools Market in 2024.
Ans. Some of the major key players in the SAP SE, IBM Corporation, Orbus Software, Sparx Systems, Software AG, MEGA International, BiZZdesign, Avolution, Planview, LeanIX GmbH, among others.
Ans. The Enterprise Architecture Tools Market is expected to grow at a CAGR of 5.1% during the forecast period of 2025-2032.
Ans. The Enterprise Architecture Tools Market is projected to reach USD 1.74 billion by 2032.
Get in Touch
