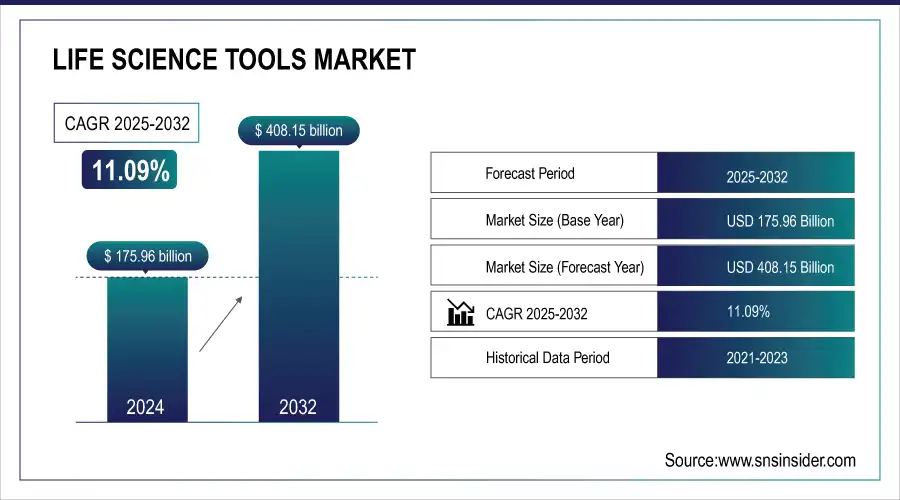
The Life Science Tools Market size was estimated at USD 160.93 billion in 2023 and is expected to reach USD 370.34 billion by 2031 with a growing CAGR of 10.98% during the forecast period of 2024-2031.
Life science studies include molecular biology, cell biology, genetics, and biochemistry. Instruments, reagents, and consumables are examples of life science tools. They all play an important role in diagnosing and monitoring the progression of a disease in the body. Life sciences tool discoveries assist to improve the quality and standard of living by being applied to the health, medicine, agriculture, pharmaceutical, and food science industries.
Get More Information on Life Science Tools Market - Request Sample Report
DRIVERS
Rising investments in pharmaceutical R&D
The pharmaceutical players focusing on and investing in research to develop protein-related products. Analytical equipment of various types are used in drug discovery and manufacture. Analytical tools assess drug compounds, protein analysis and purification, and quality control. Protein identification and separation is a critical step in medication production. Technologically improved equipment aids in the understanding of a molecule's characterisation and ensures its safety and purity. Foreign direct investment and government funding in pharmaceutical R&D have increased significantly in emerging economies in recent years. As a result, increased R&D spending in the life sciences, pharmaceutical, and biotechnology sectors will almost certainly boost the use of life science equipment.
RESTRAIN
High equipment costs
The cost of life science tools has increased due to recent technical developments and newly added functionalities. The advent of automation with the assistance of Al has resulted in a steady increase in the cost of these systems. The new cutting-edge equipment saves time and offers reliable findings, but it is typically expensive. Furthermore, there are ongoing charges in the form of maintenance costs, which raise the entire cost of ownership. Due to limited resources, small-scale customers such as academic and research institutes, diagnostic laboratories, and small and medium-sized pharma-biopharma enterprises find it difficult to buy such equipment. Because of the high cost, customers are reliant on government and commercial research funding, which limits market expansion to some extent.
OPPORTUNITY
Advancements in Technology
In technical improvements, the adoption rate of tools such as next sequencers, PCR and qPCR, flow cytometers, spectrometers, microscopes, chromatography columns, nucleic acid processing equipment, and cell biology instruments is expanding. Improvements in molecular diagnostic tools such as digital droplet PCR, Next-Generation Sequencing (NGS), and genome-wide sequencing have influenced the introduction of DNA assays in clinical settings in terms of accuracy, timeframe, and reproducibility. An effective extraction procedure is required for the optimal use of circulating nucleic acids in medicinal applications.
CHALLENGES
Inadequate research infrastructure in developing nations
Adequate infrastructure is critical for conducting research and development. To use life science instruments for study, adequate financial backing, appropriate research laboratories, and trained experts are required. Emerging Asian countries (such as India, Indonesia, and the Philippines), Middle Eastern countries (such as Oman, Iraq, and the UAE), and African countries lack the essential infrastructure. This ultimately poses a hindrance to the market's expansion in emerging countries.
Growth in the Imaging area in EMEA has slowed and is now at a flat growth level. While EU government investment initiatives aided growth, the conflict in Ukraine had a detrimental influence on the region. The Diagnostics business in EMEA showed moderate growth in fiscal 2022 (excluding molecular diagnostics), led by an increase in patient volumes in routine care. The increase did not compensate for the substantial fall in SARS-CoV PCR testing in molecular diagnostics, resulting in a modest decline in the overall diagnostics market (including molecular laboratory diagnostics) excluding the COVID-19 antigen fast test market. Consolidation of networked healthcare providers is developing, leading in EMEA-wide laboratory chains focusing on expanding their reach in an already crowded field.
IMPACT OF ONGOING RECESSION
The COVID-19 pandemic has impacted regulatory environments and practices, presenting governments and healthcare providers with unprecedented challenges. Regulatory authorities have utilized targeted methods to get diagnostic products to market faster. These include changes to existing reimbursement structures as well as the introduction of accelerated regulatory processes and emergency approvals. Governments have also been quick to create a legal framework conducive to the deployment of telehealth technology. This has had a positive influence on the availability of diagnostic tests and access to reimbursement.
By Technology
Genomic Technology
Proteomics Technology
Cell Biology Technology
Other Analytical & Sample Preparation Technology
Lab Supplies & Technologies
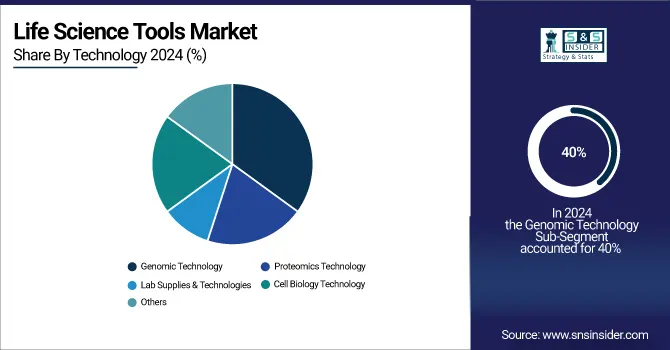
In 2022, Cell Biology Technology segment is expected to held the highest market share of 34.3% during the forecast period due to the importance of cell biology technology in drug development, as well as an increase in NIH funding for cell biology, are driving segment expansion. Furthermore, advancements in flow cytometry and liquid handling have resulted in an increase in the use of cell-based assays for drug discovery. In addition, prominent market participants have collaborated on research to reprogram newborn stem cells from umbilical cord tissue and blood into Induced Pluripotent Stem Cells (iPSCs). EdiGene and Haihe Laboratory, for example, formed a strategic agreement in January 2022 to develop platform technologies and stem cell regenerative medicines. The cooperation will look for new biomarkers to improve quality control in stem cell production. Over the projected period, these collaborations are expected to drive the market.
By Type
Cell Culture Systems & 3D Cell Culture
Instruments
Consumables
Cell & Tissue Culture Services
Liquid Chromatography
Instruments
Consumables
Services
Mass Spectrometry
Instruments
Consumables
Services
Flow Cytometry
Instruments
Consumables
Services
Cloning & Genome Engineering
Kits, Reagents, and Consumables
Services
Microscopy & Electron Microscopy
Instruments
Consumables
Services
Next Generation Sequencing
Instruments
Consumables
Services
PCR & qPCR
Instruments
Consumables
Services
Nucleic Acid Preparation
Instruments
Consumables
Services
Nucleic Acid Microarray
Instruments
Consumables
Services
Sanger Sequencing
Instruments
Consumables
Services
Transfection Devices & Gene Delivery Technologies
Equipment
Reagents
NMR
Instruments
Consumables
Services
Other Separation Technologies
Instruments
Consumables
Services
Other Products & Services
Antibodies
General Supplies
Others
Instruments
Consumables
Services
In 2022, the Cell Culture Systems & 3D Cell Culture segment is expected to dominate the market growth of 21.3% during the forecast period. Research into the potential of cell biology has resulted in significant advances, which have contributed to revenue generating. An in-depth grasp of cell biology has become a valuable tool throughout laboratory workflows, offering up new commercial opportunities. Furthermore, professionals in the life science area are eager to adopt new and advanced instruments, which is projected to boost the market even further. This business trend has also prompted several major instrument manufacturers to broaden their product offerings.
By End User
Government & Academic
Biopharmaceutical Company
Healthcare
Industrial Applications
Others
In 2022, Healthcare segment is expected to dominate the market growth of 32.2% during the forecast period to due to the increased use of proteomic and genomic processes in hospitals to detect and treat a variety of diseases is likely to drive growth. Furthermore, the market is likely to be driven by the increasing adoption of tissue diagnostic and NGS services in hospitals. Several hospitals and clinics are currently offering patients with sequencing services and assessing the use of modern tools and technology in regular medical practice. Stanford Medicine is one such hospital that offers sequencing services to patients with uncommon or undiscovered genetic conditions.
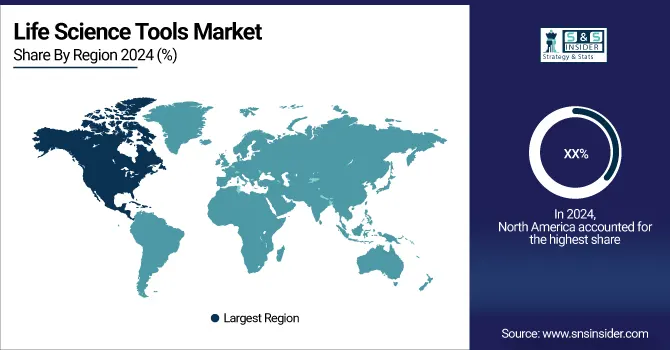
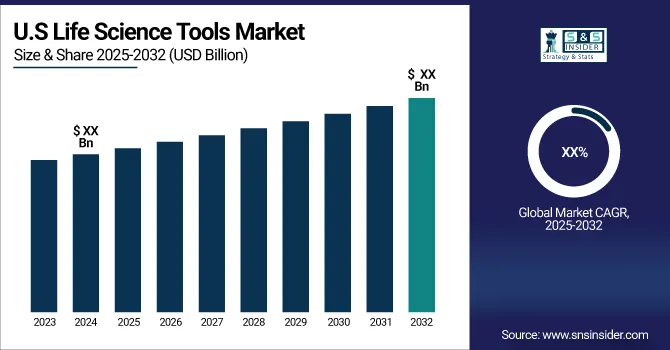
North America held a significant market share of around 38.8% in 2022 owing to the region's rapid adoption of genomics, proteomics, oncology, and diagnostic screening. The increased use of genetic medicine, biopharmaceuticals, diagnostic methods, and novel technologies for the diagnosis and treatment of clinical illnesses in the United States and Canada is driving market expansion in the area. The region also benefits from the existence of a significant number of market participants who are always working to develop better tools for life science research.
Asia-Pacific is witness to expand fastest CAGR rate during the forecast period due to the global companies investments and efforts in this region to capitalize on undiscovered opportunities and expand their presence will fuel growth. For example, in January 2022, FUJIFILM Corporation announced the USD 100 million acquisition of Atara Biotherapeutics T-Cell Operations and Manufacturing (ATOM) facility to create commercial and clinical treatments, including CAR-T and T-cell immunotherapies. Furthermore, this region provides a low-cost production and operating unit for performing research. These variables are predicted to have a significant impact on the growth of life science instruments and technology in this region.
Get Customized Report as per Your Business Requirement - Request For Customized Report
REGIONAL COVERAGE
North America
US
Canada
Mexico
Europe
Eastern Europe
Poland
Romania
Hungary
Turkey
Rest of Eastern Europe
Western Europe
Germany
France
UK
Italy
Spain
Netherlands
Switzerland
Austria
Rest of Western Europe
Asia Pacific
China
India
Japan
South Korea
Vietnam
Singapore
Australia
Rest of Asia Pacific
Middle East & Africa
Middle East
UAE
Egypt
Saudi Arabia
Qatar
Rest of Middle East
Africa
Nigeria
South Africa
Rest of Africa
Latin America
Brazil
Argentina
Colombia
Rest of Latin America
The major players are Agilent Technologies, Inc., Becton, Dickinson and Company, F. Hoffmann-La Roche Ltd., Bio-Rad Laboratories, Inc., Danaher Corporation, Illumina, Inc., Thermo Fisher Scientific, Inc., QIAGEN N.V., Merck KGaA, Siemens Healthineers, Hitachi, Ltd., Bruker Corporation, Oxford Instruments plc, Zeiss International, EdiGene, and Others.
in January 2022, Tebentafusp-tebn is a monoclonal antibody approved by the FDA to treat metastatic uveal melanoma.
Siemens Healthineers, in December 2021, Siemens Healthineers got Emergency Use Authorization from the US Food and Drug Administration for its COVID-19 quick test, CLINITEST quick COVID-19 Antigen Self-Test, which can be used for self-testing by people aged 14 and above age group.
in January 2022, EdiGene and Haihe Laboratory launched a strategic partnership to create platform technologies and stem cell regenerative medicines. The cooperation will look for new biomarkers to improve quality control in stem cell production.
Report Attributes | Details |
Market Size in 2023 | US$ 160.93 Billion |
Market Size by 2031 | US$ 370.34 Billion |
CAGR | CAGR of 10.98% From 2024 to 2031 |
Base Year | 2023 |
Forecast Period | 2024-2031 |
Historical Data | 2020-2022 |
Report Scope & Coverage | Market Size, Segments Analysis, Competitive Landscape, Regional Analysis, DROC & SWOT Analysis, Forecast Outlook |
Key Segments | • By Technology (Genomic Technology, Proteomics Technology, Cell Biology Technology, Other Analytical & Sample Preparation Technology, Lab Supplies & Technologies) • By Product (Cell Culture Systems & 3D Cell Culture, Liquid Chromatography, Mass Spectrometry, Flow Cytometry, Cloning & Genome Engineering, Microscopy & Electron Microscopy, Next Generation Sequencing, PCR & qPCR, Nucleic Acid Preparation, Nucleic Acid Microarray, Sanger Sequencing, Transfection Devices & Gene Delivery Technologies, NMR, Other Separation Technologies, Other Products & Services) • By End User (Government & Academic, Biopharmaceutical Company, Healthcare, Industrial Applications, Others) |
Regional Analysis/Coverage | North America (US, Canada, Mexico), Europe (Eastern Europe [Poland, Romania, Hungary, Turkey, Rest of Eastern Europe] Western Europe] Germany, France, UK, Italy, Spain, Netherlands, Switzerland, Austria, Rest of Western Europe]), Asia Pacific (China, India, Japan, South Korea, Vietnam, Singapore, Australia, Rest of Asia Pacific), Middle East & Africa (Middle East [UAE, Egypt, Saudi Arabia, Qatar, Rest of Middle East], Africa [Nigeria, South Africa, Rest of Africa], Latin America (Brazil, Argentina, Colombia Rest of Latin America) |
Company Profiles | Agilent Technologies, Inc., Becton, Dickinson and Company, F. Hoffmann-La Roche Ltd., Bio-Rad Laboratories, Inc., Danaher Corporation, Illumina, Inc., Thermo Fisher Scientific, Inc., QIAGEN N.V., Merck KGaA, Siemens Healthineers, Hitachi, Ltd., Bruker Corporation, Oxford Instruments plc, Zeiss International, EdiGene |
Key Drivers | • Rising investments in pharmaceutical R&D |
Market Challenges | • Inadequate research infrastructure in developing nations |
Ans: USD 331.7 billion is expected to grow by 2030.
Ans: Protein Life Science Tools Market is anticipated to expand by 7.5% from 2023 to 2030.
Ans: Life Science Tools Market size was valued at USD 145.01 billion in 2022.
Ans: Advancements in technology.
Ans: Growing demand for biologics frequently utilizing recombinant DNA technology
Table of Contents
1. Introduction
1.1 Market Definition
1.2 Scope
1.3 Research Assumptions
2. Research methodology
3. Market Dynamics
3.1 Drivers
3.2 Restraints
3.3 Opportunities
3.4 Challenges
4. Impact Analysis
4.1 Impact of the Ukraine- Russia war
4.2 Impact of ongoing Recession
4.2.1 Introduction
4.2.2 Impact on major economies
4.2.2.1 US
4.2.2.2 Canada
4.2.2.3 Germany
4.2.2.4 France
4.2.2.5 United Kingdom
4.2.2.6 China
4.2.2.7 Japan
4.2.2.8 South Korea
4.2.2.9 Rest of the World
5. Value Chain Analysis
6. Porter’s 5 forces model
7. PEST Analysis
8. Life Science Tools Market Segmentation, By Technology
8.1 Reagents
8.1.1 Proteins
8.1.2 Enzymes
8.1.3 Probes/Tags
8.1.4 Monoclonal Antibodies
8.1.5 Other Reagents
8.2 Kits
8.3 Services
9. Life Science Tools Market Segmentation, By Product
9.1.1 Genomic Technology
9.1.2 Proteomics Technology
9.1.3 Cell Biology Technology
9.1.4 Other Analytical & Sample Preparation Technology
9.1.5 Lab Supplies & Technologies
10. Life Science Tools Market Segmentation, By End User
10.1 Cell Culture Systems & 3D Cell Culture
10.1.1 Instruments
10.1.2 Consumables
10.1.3 Cell & Tissue Culture Services
10.2 Liquid Chromatography
10.2.1 Instruments
10.2.2 Consumables
10.2.3 Services
10.3 Mass Spectrometry
10.3.1 Instruments
10.3.2 Consumables
10.3.3 Services
10.4 Flow Cytometry
10.4.1 Instruments
10.4.2 Consumables
10.4.3 Services
10.5 Cloning & Genome Engineering
10.5.1 Kits, Reagents, and Consumables
10.5.2 Services
10.6 Microscopy & Electron Microscopy
10.6.1 Instruments
10.6.2 Consumables
10.6.3 Services
10.7 Next Generation Sequencing
10.7.1 Instruments
10.7.2 Consumables
10.7.3 Services
10.8 PCR & qPCR
10.8.1 Instruments
10.8.2 Consumables
10.8.3 Services
10.9 Nucleic Acid Preparation
10.9.1 Instruments
10.9.2 Consumables
10.9.3 Services
10.10 Nucleic Acid Microarray
10.10.1 Instruments
10.10.2 Consumables
10.10.3 Services
10.11 Sanger Sequencing
10.11.1 Instruments
10.11.2 Consumables
10.11.3 Services
10.12 Transfection Devices & Gene Delivery Technologies
10.12.1 Equipment
10.12.2 Reagents
10.13 NMR
10.13.1 Instruments
10.13.2 Consumables
10.13.3 Services
10.14 Other Separation Technologies
10.14.1 Instruments
10.14.2 Consumables
10.14.3 Services
10.15 Other Products & Services
10.15.1 Antibodies
10.15.2 General Supplies
10.15.3 Others
10.15.3.1 Instruments
10.15.3.2 Consumables
10.15.3.3 Services
11. Regional Analysis
11.1 Introduction
11.2 North America
11.2.1 North America Life Science Tools Market by Country
11.2.2 North America Life Science Tools Market by Technology
11.2.3 North America Life Science Tools Market by Product
11.2.4 North America Life Science Tools Market by End User
11.2.5 USA
11.2.5.1 USA Life Science Tools Market by Technology
11.2.5.2 USA Life Science Tools Market by Product
11.2.5.3 USA Life Science Tools Market by End User
11.2.6 Canada
11.2.6.1 Canada Life Science Tools Market by Technology
11.2.6.2 Canada Life Science Tools Market by Product
11.2.6.3 Canada Life Science Tools Market by End User
11.2.7 Mexico
11.2.7.1 Mexico Life Science Tools Market by Technology
11.2.7.2 Mexico Life Science Tools Market by Product
11.2.7.3 Mexico Life Science Tools Market by End User
11.3 Europe
11.3.1 Eastern Europe
11.3.1.1 Eastern Europe Life Science Tools Market by Country
11.3.1.2 Eastern Europe Life Science Tools Market by Technology
11.3.1.3 Eastern Europe Life Science Tools Market by Product
11.3.1.4 Eastern Europe Life Science Tools Market by End User
11.3.1.5 Poland
11.3.1.5.1 Poland Life Science Tools Market by Technology
11.3.1.5.2 Poland Life Science Tools Market by Product
11.3.1.5.3 Poland Life Science Tools Market by End User
11.3.1.6 Romania
11.3.1.6.1 Romania Life Science Tools Market by Technology
11.3.1.6.2 Romania Life Science Tools Market by Product
11.3.1.6.4 Romania Life Science Tools Market by End User
11.3.1.7 Turkey
11.3.1.7.1 Turkey Life Science Tools Market by Technology
11.3.1.7.2 Turkey Life Science Tools Market by Product
11.3.1.7.3 Turkey Life Science Tools Market by End User
11.3.1.8 Rest of Eastern Europe
11.3.1.8.1 Rest of Eastern Europe Life Science Tools Market by Technology
11.3.1.8.2 Rest of Eastern Europe Life Science Tools Market by Product
11.3.1.8.3 Rest of Eastern Europe Life Science Tools Market by End User
11.3.2 Western Europe
11.3.2.1 Western Europe Life Science Tools Market by Technology
11.3.2.2 Western Europe Life Science Tools Market by Product
11.3.2.3 Western Europe Life Science Tools Market by End User
11.3.2.4 Germany
11.3.2.4.1 Germany Life Science Tools Market by Technology
11.3.2.4.2 Germany Life Science Tools Market by Product
11.3.2.4.3 Germany Life Science Tools Market by End User
11.3.2.5 France
11.3.2.5.1 France Life Science Tools Market by Technology
11.3.2.5.2 France Life Science Tools Market by Product
11.3.2.5.3 France Life Science Tools Market by End User
11.3.2.6 UK
11.3.2.6.1 UK Life Science Tools Market by Technology
11.3.2.6.2 UK Life Science Tools Market by Product
11.3.2.6.3 UK Life Science Tools Market by End User
11.3.2.7 Italy
11.3.2.7.1 Italy Life Science Tools Market by Technology
11.3.2.7.2 Italy Life Science Tools Market by Product
11.3.2.7.3 Italy Life Science Tools Market by End User
11.3.2.8 Spain
11.3.2.8.1 Spain Life Science Tools Market by Technology
11.3.2.8.2 Spain Life Science Tools Market by Product
11.3.2.8.3 Spain Life Science Tools Market by End User
11.3.2.9 Netherlands
11.3.2.9.1 Netherlands Life Science Tools Market by Technology
11.3.2.9.2 Netherlands Life Science Tools Market by Product
11.3.2.9.3 Netherlands Life Science Tools Market by End User
11.3.2.10 Switzerland
11.3.2.10.1 Switzerland Life Science Tools Market by Technology
11.3.2.10.2 Switzerland Life Science Tools Market by Product
11.3.2.10.3 Switzerland Life Science Tools Market by End User
11.3.2.11.1 Austria
11.3.2.11.2 Austria Life Science Tools Market by Technology
11.3.2.11.3 Austria Life Science Tools Market by Product
11.3.2.11.4 Austria Life Science Tools Market by End User
11.3.2.12 Rest of Western Europe
11.3.2.12.1 Rest of Western Europe Life Science Tools Market by Technology
11.3.2.12.2 Rest of Western Europe Life Science Tools Market by Product
11.3.2.12.3 Rest of Western Europe Life Science Tools Market by End User
11.4 Asia-Pacific
11.4.1 Asia-Pacific Life Science Tools Market by Country
11.4.2 Asia-Pacific Life Science Tools Market by Technology
11.4.3 Asia-Pacific Life Science Tools Market by Product
11.4.4 Asia-Pacific Life Science Tools Market by End User
11.4.5 China
11.4.5.1 China Life Science Tools Market by Technology
11.4.5.2 China Life Science Tools Market by End User
11.4.5.3 China Life Science Tools Market by Product
11.4.6 India
11.4.6.1 India Life Science Tools Market by Technology
11.4.6.2 India Life Science Tools Market by Product
11.4.6.3 India Life Science Tools Market by End User
11.4.7 Japan
11.4.7.1 Japan Life Science Tools Market by Technology
11.4.7.2 Japan Life Science Tools Market by Product
11.4.7.3 Japan Life Science Tools Market by End User
11.4.8 South Korea
11.4.8.1 South Korea Life Science Tools Market by Technology
11.4.8.2 South Korea Life Science Tools Market by Product
11.4.8.3 South Korea Life Science Tools Market by End User
11.4.9 Vietnam
11.4.9.1 Vietnam Life Science Tools Market by Technology
11.4.9.2 Vietnam Life Science Tools Market by Product
11.4.9.3 Vietnam Life Science Tools Market by End User
11.4.10 Singapore
11.4.10.1 Singapore Life Science Tools Market by Technology
11.4.10.2 Singapore Life Science Tools Market by Product
11.4.10.3 Singapore Life Science Tools Market by End User
11.4.11 Australia
11.4.11.1 Australia Life Science Tools Market by Technology
11.4.11.2 Australia Life Science Tools Market by Product
11.4.11.3 Australia Life Science Tools Market by End User
11.4.12 Rest of Asia-Pacific
11.4.12.1 Rest of Asia-Pacific Life Science Tools Market by Technology
11.4.12.2 Rest of Asia-Pacific Life Science Tools Market by Product
11.4.12.3 Rest of Asia-Pacific Life Science Tools Market by End User
11.5 Middle East & Africa
11.5.1 Middle East
11.5.1.1 Middle East Life Science Tools Market by Country
11.5.1.2 Middle East Life Science Tools Market by Technology
11.5.1.3 Middle East Life Science Tools Market by Product
11.5.1.4 Middle East Life Science Tools Market by End User
11.5.1.5 UAE
11.5.1.5.1 UAE Life Science Tools Market by Technology
11.5.1.5.2 UAE Life Science Tools Market by Product
11.5.1.5.3 UAE Life Science Tools Market by End User
11.5.1.6 Egypt
11.5.1.6.1 Egypt Life Science Tools Market by Technology
11.5.1.6.2 Egypt Life Science Tools Market by Product
11.5.1.6.3 Egypt Life Science Tools Market by End User
11.5.1.7 Saudi Arabia
11.5.1.7.1 Saudi Arabia Life Science Tools Market by Technology
11.5.1.7.2 Saudi Arabia Life Science Tools Market by Product
11.5.1.7.3 Saudi Arabia Life Science Tools Market by End User
11.5.1.8 Qatar
11.5.1.8.1 Qatar Life Science Tools Market by Technology
11.5.1.8.2 Qatar Life Science Tools Market by Product
11.5.1.8.3 Qatar Life Science Tools Market by End User
11.5.1.9 Rest of Middle East
11.5.1.9.1 Rest of Middle East Life Science Tools Market by Technology
11.5.1.9.2 Rest of Middle East Life Science Tools Market by Product
11.5.1.9.3 Rest of Middle East Life Science Tools Market by End User
11.5.2 Africa
11.5.2.1 Africa Transfusion Diagnostics Market by Country
11.5.2.2 Africa Life Science Tools Market by Technology
11.5.2.3 Africa Life Science Tools Market by Product
11.5.2.4 Africa Life Science Tools Market by End User
11.5.2.5 Nigeria
11.5.2.5.1 Nigeria Life Science Tools Market by Technology
11.5.2.5.2 Nigeria Life Science Tools Market by Product
11.5.2.5.3 Nigeria Life Science Tools Market by End User
11.5.2.6 South Africa
11.5.2.6.1 South Africa Life Science Tools Market by Technology
11.5.2.6.2 South Africa Life Science Tools Market by Product
11.5.2.6.3 South Africa Life Science Tools Market by End User
11.5.2.7 Rest of Africa
11.5.2.7.1 Rest of Africa Life Science Tools Market by Technology
11.5.2.7.2 Rest of Africa Life Science Tools Market by Product
11.5.2.7.3 Rest of Africa Life Science Tools Market by End User
11.6 Latin America
11.6.1 Latin America Life Science Tools Market by Country
11.6.2 Latin America Life Science Tools Market by Technology
11.6.3 Latin America Life Science Tools Market by Product
11.6.4 Latin America Life Science Tools Market by End User
11.6.5 Brazil
11.6.5.1 Brazil Life Science Tools Market by Technology
11.6.5.2 Brazil Life Science Tools Market by Product
11.6.5.3 Brazil Life Science Tools Market by End User
11.6.6 Argentina
11.6.6.1 Argentina Life Science Tools Market by Technology
11.6.6.2 Argentina Life Science Tools Market by Product
11.6.6.3 Argentina Life Science Tools Market by End User
11.6.7 Colombia
11.6.7.1 Colombia Life Science Tools Market by Technology
11.6.7.2 Colombia Life Science Tools Market by Product
11.6.7.3 Colombia Life Science Tools Market by End User
11.6.8 Rest of Latin America
11.6.8.1 Rest of Latin America Life Science Tools Market by Technology
11.6.8.2 Rest of Latin America Life Science Tools Market by Product
11.6.8.3 Rest of Latin America Life Science Tools Market by End User
12. Company profile
12.1 Agilent Technologies, Inc.
12.1.1 Company Overview
12.1.2 Financial
12.1.3 Technologys/ Services Offered
12.1.4 SWOT Analysis
12.1.5 The SNS View
12.2 Becton, Dickinson and Company
12.2.1 Company Overview
12.2.2 Financials
12.2.3 Technology/Services Offered
12.2.4 SWOT Analysis
12.2.5 The SNS View
12.3 F. Hoffmann-La Roche Ltd.
12.3.1 Company Overview
12.3.2 Financials
12.3.3 Technology/Services Offered
12.3.4 SWOT Analysis
12.3.5 The SNS View
12.4 Bio-Rad Laboratories Inc.
12.4.1 Company Overview
12.4.2 Financials
12.4.3 Technology/Services Offered
12.4.4 SWOT Analysis
12.4.5 The SNS View
12.5 Danaher Corporation
12.5.1 Company Overview
12.5.2 Financials
12.5.3 Technology/Services Offered
12.5.4 SWOT Analysis
12.5.5 The SNS View
12.6 Illumina, Inc.
12.6.1 Company Overview
12.6.2 Financials
12.6.3 Technology/Services Offered
12.6.4 SWOT Analysis
12.6.5 The SNS View
12.7 Thermo Fisher Scientific, Inc.
12.7.1 Company Overview
12.7.2 Financials
12.7.3 Technology/Services Offered
12.7.4 SWOT Analysis
12.7.5 The SNS View
12.8 QIAGEN N.V.
12.8.1 Company Overview
12.8.2 Financials
12.8.3 Technology/Services Offered
12.8.4 SWOT Analysis
12.8.5 The SNS View
12.9 Merck KGaA
12.9.1 Company Overview
12.9.2 Financials
12.9.3 Technology/Services Offered
12.9.4 SWOT Analysis
12.9.5 The SNS View
12.10 Siemens Healthineers
12.10.1 Company Overview
12.10.2 Financials
12.10.3 Technology/Services Offered
12.10.4 SWOT Analysis
12.10.5 The SNS View
12.11 Hitachi, Ltd.
12.11.1 Company Overview
12.11.2 Financials
12.11.3 Technology/Services Offered
12.11.4 SWOT Analysis
12.11.5 The SNS View
12.12 Bruker Corporation
12.12.1 Company Overview
12.12.2 Financials
12.12.3 Technology/Services Offered
12.12.4 SWOT Analysis
12.12.5 The SNS View
12.13 Oxford Instruments plc
12.13.1 Company Overview
12.13.2 Financials
12.13.3 Technology/Services Offered
12.13.4 SWOT Analysis
12.13.5 The SNS View
12.14 Zeiss International
12.14.1 Company Overview
12.14.2 Financials
12.14.3 Technology/Services Offered
12.14.4 SWOT Analysis
12.14.5 The SNS View
12.15 EdiGene
12.15.1 Company Overview
12.15.2 Financials
12.15.3 Technology/Services Offered
12.15.4 SWOT Analysis
12.15.5 The SNS View
12.16 Others
13. Competitive Landscape
13.1 Competitive Benchmarking
13.2 Market Share Analysis
13.3 Recent Developments
13.3.1 Industry News
13.3.2 Company News
13.3.3 Mergers & Acquisitions
14. Use Case and Best Practices
15. Conclusion
An accurate research report requires proper strategizing as well as implementation. There are multiple factors involved in the completion of good and accurate research report and selecting the best methodology to compete the research is the toughest part. Since the research reports we provide play a crucial role in any company’s decision-making process, therefore we at SNS Insider always believe that we should choose the best method which gives us results closer to reality. This allows us to reach at a stage wherein we can provide our clients best and accurate investment to output ratio.
Each report that we prepare takes a timeframe of 350-400 business hours for production. Starting from the selection of titles through a couple of in-depth brain storming session to the final QC process before uploading our titles on our website we dedicate around 350 working hours. The titles are selected based on their current market cap and the foreseen CAGR and growth.
The 5 steps process:
Step 1: Secondary Research:
Secondary Research or Desk Research is as the name suggests is a research process wherein, we collect data through the readily available information. In this process we use various paid and unpaid databases which our team has access to and gather data through the same. This includes examining of listed companies’ annual reports, Journals, SEC filling etc. Apart from this our team has access to various associations across the globe across different industries. Lastly, we have exchange relationships with various university as well as individual libraries.
Step 2: Primary Research
When we talk about primary research, it is a type of study in which the researchers collect relevant data samples directly, rather than relying on previously collected data. This type of research is focused on gaining content specific facts that can be sued to solve specific problems. Since the collected data is fresh and first hand therefore it makes the study more accurate and genuine.
We at SNS Insider have divided Primary Research into 2 parts.
Part 1 wherein we interview the KOLs of major players as well as the upcoming ones across various geographic regions. This allows us to have their view over the market scenario and acts as an important tool to come closer to the accurate market numbers. As many as 45 paid and unpaid primary interviews are taken from both the demand and supply side of the industry to make sure we land at an accurate judgement and analysis of the market.
This step involves the triangulation of data wherein our team analyses the interview transcripts, online survey responses and observation of on filed participants. The below mentioned chart should give a better understanding of the part 1 of the primary interview.
Part 2: In this part of primary research the data collected via secondary research and the part 1 of the primary research is validated with the interviews from individual consultants and subject matter experts.
Consultants are those set of people who have at least 12 years of experience and expertise within the industry whereas Subject Matter Experts are those with at least 15 years of experience behind their back within the same space. The data with the help of two main processes i.e., FGDs (Focused Group Discussions) and IDs (Individual Discussions). This gives us a 3rd party nonbiased primary view of the market scenario making it a more dependable one while collation of the data pointers.
Step 3: Data Bank Validation
Once all the information is collected via primary and secondary sources, we run that information for data validation. At our intelligence centre our research heads track a lot of information related to the market which includes the quarterly reports, the daily stock prices, and other relevant information. Our data bank server gets updated every fortnight and that is how the information which we collected using our primary and secondary information is revalidated in real time.
Step 4: QA/QC Process
After all the data collection and validation our team does a final level of quality check and quality assurance to get rid of any unwanted or undesired mistakes. This might include but not limited to getting rid of the any typos, duplication of numbers or missing of any important information. The people involved in this process include technical content writers, research heads and graphics people. Once this process is completed the title gets uploader on our platform for our clients to read it.
Step 5: Final QC/QA Process:
This is the last process and comes when the client has ordered the study. In this process a final QA/QC is done before the study is emailed to the client. Since we believe in giving our clients a good experience of our research studies, therefore, to make sure that we do not lack at our end in any way humanly possible we do a final round of quality check and then dispatch the study to the client.
The Dental Imaging Market size was valued at US$ 3.08 billion in 2023 and is estimated to reach US$ 6.69 billion by 2032, with a growing CAGR of 9% over the forecast period 2024-2032.
The Fluoroscopy Imaging Systems Market Size was valued at USD 1.99 billion in 2023 and is expected to reach USD 2.45 billion by 2032 and grow at a CAGR of 2.37% over the forecast period 2024-2032.
The Hospital Capacity Management Solutions Market Size was valued at USD 4.17 billion in 2023 and expected to reach USD 14.85 billion by 2031 and grow at a CAGR of 17.2% over the forecast period 2024-2031.
The Protein Crystallization Market size was estimated at USD 1.20 billion in 2023 and is expected to reach USD 2.49 billion by 2032 at a CAGR of 8.45% during the forecast period of 2024-2032.
The Healthcare Payer Services Market Size was valued at USD 67.37 billion in 2023 and is expected to reach USD 129.16 billion by 2032 and grow at a CAGR of 7.5% over the forecast period 2024-2032.
The Augmented and Virtual Reality Contact Lenses Market size was valued at USD 21.60 Million in 2023 and is expected to grow to USD 71.80 Million by 2031 and grow at a CAGR of 16.2 % over the forecast period of 2024-2031.
Hi! Click one of our member below to chat on Phone