Live Streaming Market Report Scope & Overview:
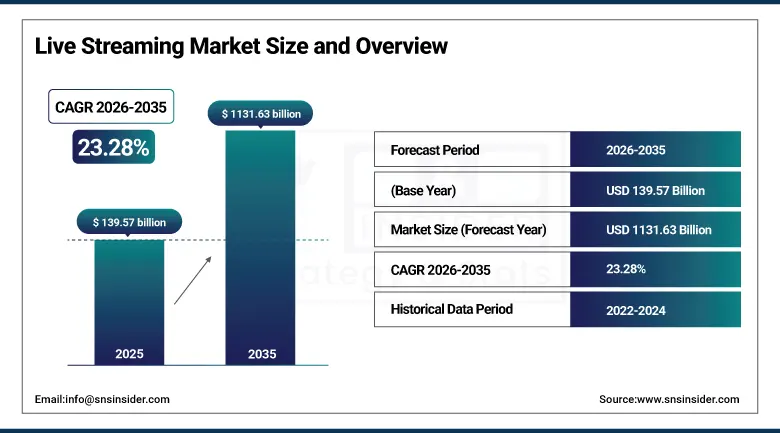
The Live Streaming Market was valued at USD 139.57 billion in 2025 and is expected to reach USD 1,131.63 billion by 2035, growing at a CAGR of 23.28% from 2026–2035.
The global Live Streaming Market is at the centre of the most significant transformation in media consumption since the invention of television, as real-time digital content broadcast directly from creators, brands, athletes, educators, and events to global audiences through internet-connected devices has displaced appointment television viewing, redefined the concept of live entertainment, created entirely new commercial categories including live commerce and virtual events, and established a new generation of media celebrities whose influence rivals and in many demographics exceeds traditional broadcast and film stars.
Market Size and Forecast
-
Market Size in 2025: USD 139.57 Billion
-
Market Size by 2035: USD 1,131.63 Billion
-
CAGR: 23.28% from 2026 to 2035
-
Base Year: 2025
-
Forecast Period: 2026–2035
-
Historical Data: 2022–2024
To Get more information on Live Streaming Market - Request Free Sample Report
Live Streaming Market Trends
-
Explosive growth of live commerce, where creators and brands showcase products in real-time interactive broadcasts and viewers purchase directly through in-stream transaction features, generating USD 600 billion in live commerce sales in China in 2024 and beginning commercial scale adoption across Southeast Asia, the U.S., and Europe through TikTok Shop, Instagram Live Shopping, and YouTube Shopping Live.
-
Rapid expansion of gaming and esports live streaming, with Twitch, YouTube Gaming, and dedicated esports streaming platforms serving the largest live streaming viewer sessions globally, as competitive gaming events attract concurrent viewership numbers rivalling traditional sports broadcasts and creator streams build communities of millions of regular viewers.
-
Growing adoption of live streaming for enterprise virtual events, product launches, investor days, employee town halls, and client conferences that replaced physical events during the pandemic and have retained virtual formats for cost-efficiency, global reach, and measurable audience engagement analytics.
-
Accelerating integration of AI tools in live streaming including real-time translation and subtitling, AI-powered moderation that detects harmful content and spam in live chat, AI scene enhancement for low-quality broadcast environments, and automated highlight clip generation that creates shareable short-form content from live broadcasts.
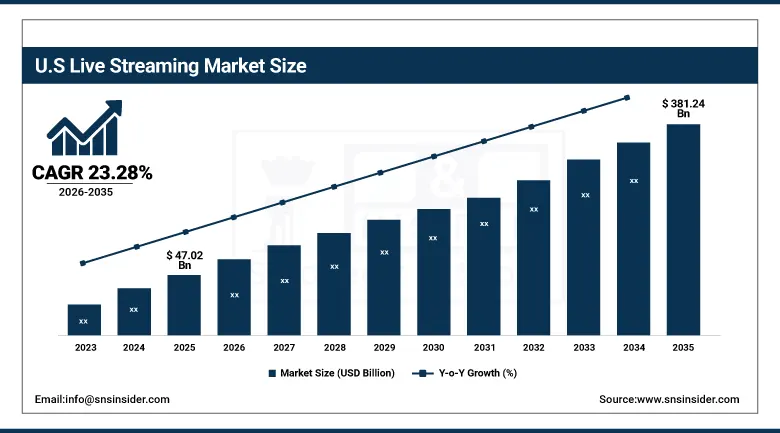
U.S. Live Streaming Market was valued at USD 47.02 billion in 2025 and is expected to reach USD 381.24 billion by 2035, growing at a CAGR of 23.28% during 2026–2035.
The United States represents one of the world's largest and most commercially sophisticated live streaming markets, home to the global headquarters of the world's leading streaming platforms including YouTube, Twitch, Facebook Live, Instagram, TikTok's U.S. operations, and dozens of specialists live streaming service providers whose continuous platform innovation drives global market standards.
The U.S. live streaming market's commercial sophistication is exemplified by Twitch's 35 million daily active users generating the world's most concentrated live streaming advertising and subscription revenue in gaming content, combined with YouTube Live's integration of live sports, news, and creator content that aggregates the broadest live streaming audience demographic in the U.S.
Live Streaming Market Segment Insights
-
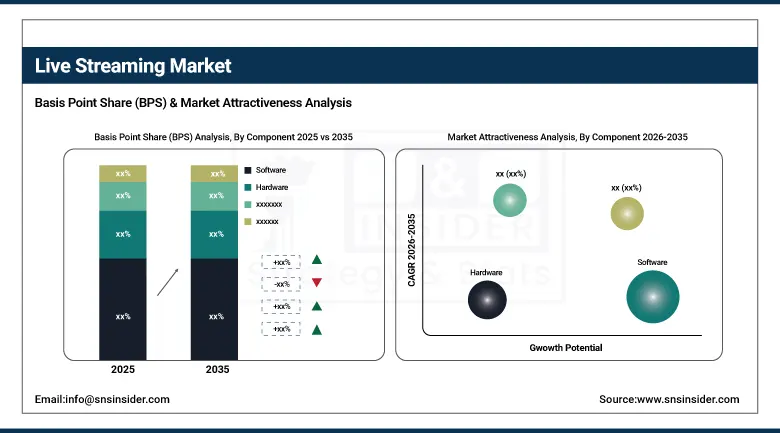
According to Component, Software dominated in 2025 as streaming platform software represents the primary commercial value layer; Services is the fastest-growing component at a CAGR of approximately 24.98% driven by rising demand for professional live production, cloud streaming infrastructure, analytics, and content moderation.
-
In terms of Format, Video Streaming led the Live Streaming Market in 2024 with approximately 72% revenue share due to high consumer preference for visual content across entertainment, gaming, sports, and events; Audio Streaming is the fastest-growing format at approximately 25.28% CAGR fueled by podcast live sessions, music performances, and real-time radio content.
-
By Platform, Social Media Platforms dominated in 2025 through YouTube, TikTok, Facebook, and Instagram's massive existing user bases that provide live streaming the widest possible distribution; Dedicated Streaming Platforms are growing rapidly through deep vertical specialisation in gaming, sports, and enterprise applications.
-
By End-User, Media and Entertainment dominated in 2025 as the largest content category driving live streaming consumption; Gaming and Esports is the fastest-growing end-user driven by competitive gaming's explosive global viewership growth.
-
By Revenue Model, Advertising dominated as the primary live streaming revenue source in 2025; Tipping and Gifting is among the fastest-growing revenue models as creator-fan digital gifting economies scale across TikTok, Twitch, and regional Asian streaming platforms.
Live Streaming Market Segment Analysis
By Component: Software dominates, Services grows fastest
Software retained the dominant component position in the Live Streaming Market in 2025, encompassing the streaming platform software, content delivery network infrastructure, video encoding and transcoding engines, adaptive bitrate streaming algorithms, live chat and interaction management systems, and monetisation and analytics platforms that collectively constitute the technology stack delivering live streaming experiences to global audiences.
Services is projected to grow at the fastest CAGR of approximately 24.98% through 2035, driven by the rapidly expanding market of businesses, educational institutions, sports organisations, and content creators who recognise the commercial and engagement value of live streaming but require professional support to execute at quality, scale, and compliance standards that in-house teams cannot achieve.
By Format: Video Streaming dominates, Audio Streaming grows fastest
Video Streaming dominated the Live Streaming Market in 2024 with approximately 72% of global revenues, driven by the fundamental human preference for visual communication and entertainment that makes live video the dominant medium across every major live streaming application from gaming broadcasts and sports events through music performances, virtual conferences, and live commerce product demonstrations.
Audio Streaming is the fastest-growing live streaming format at approximately 25.28% CAGR through 2035, driven by the growing popularity of live podcast recordings, live music streaming, live radio and talk radio programming, and voice-based social audio applications including Clubhouse-style discussion rooms where audio-only live streaming provides the intimacy, accessibility, and lower production barrier of voice conversation at global broadcast scale.
By End-User: Media and Entertainment dominate, Gaming and Esports grows fastest
Live Streaming Market was occupied by the Media and Entertainment end-user vertical, which included the widest category of live streaming such as music events, comedies, reality entertainment, celebrity live events, political live events, religious live events, and general live events from lifestyle creators making it the most viewed form of live streaming in the world.
Gaming and Esports represents the fastest growing end-user category, due to the exceptional growth pattern of competitive gaming audience, which has evolved from being a niche activity to a mass entertainment equivalent to traditional sports in the youth demographic. This is supported by Twitch as the world’s leading gaming live streaming platform hosting 35 million daily active users along with YouTube Gaming and Esports leagues specific live streaming platform making for diverse gaming streaming environment, wherein the tournament live streaming achieves multi-million concurrent audience peaks.
Market Regional Analysis
|
Region |
Major Country |
Share within Region (%) |
|---|---|---|
|
North America |
United States |
83% |
|
Europe |
United Kingdom |
28% |
|
Asia Pacific |
China |
55% |
|
Middle East & Africa |
UAE |
30% |
|
Latin America |
Brazil |
43% |
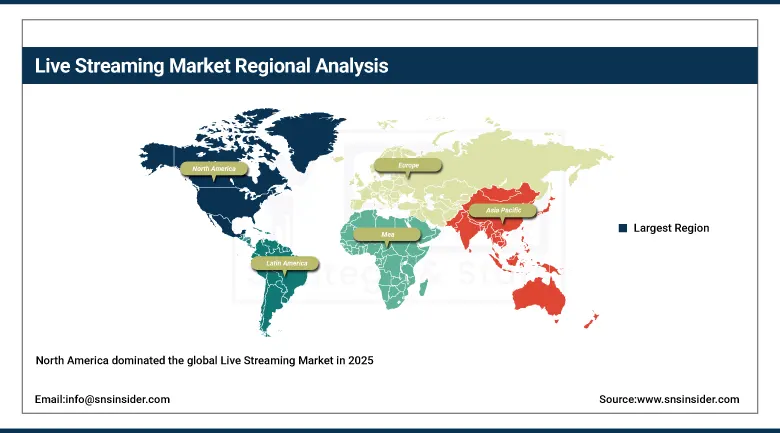
North America Live Streaming Market Insights
North America dominated the global Live Streaming Market in 2025, led by the United States with approximately 83% of North American revenues. U.S. market leadership is underpinned by the headquarters of YouTube, Twitch, Facebook Live, and the world's most developed live streaming creator economy, combined with the highest live streaming advertising rates globally and the most mature enterprise live streaming services sector. Sports media rights integration into streaming platforms and the growth of Twitch's gaming and esports streaming ecosystem sustain North American commercial leadership through the forecast period.
Get Customized Report as per Your Business Requirement - Enquiry Now
Asia Pacific Live Streaming Market Insights
Asia Pacific is projected to grow at the fastest regional CAGR of approximately 25.23% through 2035, driven by China's enormous and commercially advanced live streaming ecosystem including Douyin, Kuaishou, and Taobao Live that pioneered live commerce at scale, India's 969 million internet subscribers creating an enormous and rapidly engaged live streaming audience, and Southeast Asia's mobile-first population increasingly adopting live gaming, entertainment, and social commerce streaming through regional platforms. China leads the region with approximately 55% of Asia Pacific revenues through its mature live streaming monetisation ecosystem that generates hundreds of billions of dollars in live commerce transactions annually. South Korea's advanced esports infrastructure and gaming culture creates a highly developed live streaming content ecosystem that influences global gaming streaming trends.
Europe Live Streaming Market Insights
The European region is another large live streaming market defined by the UK's advanced creator economy and live sports streaming adoption, Germany's robust enterprise live streaming market for business communications and trade shows virtual experiences, and Scandinavia's gamer culture which has made it a hotbed for esports streaming communities. The growth of the live streaming industry in Europe is driven by GDPR's data privacy regulations that lead to the investment of platforms in audience data gathering techniques that comply with these guidelines, EBU partnerships with live streaming platforms for their public broadcasting content, and the EU Digital Services Act that influences content moderation technologies.
Latin America and MEA Live Streaming Market Insights
Latin America and MEA constitute up-and-coming high growth areas for live streaming due to increasing mobile network infrastructure quality, highly socially connected demographics, and increasing adoption of gaming, music, and lifestyle streaming. Brazil holds the largest share of live streaming revenue in Latin America (about 43%) based on its large population base which is well socially connected and increasingly engaged in gaming activities. The leading drivers of live streaming usage in MEA include UAE’s advanced digital media ecosystem and wealth, Saudi Arabia’s vision of investment in digital entertainment by 2030, and fast expansion of mobile Internet infrastructure in Sub-Saharan Africa making its young demography able to use live streaming services.
Market Growth Drivers:
Deployment of 5G network technology and proliferation of smartphones to make mobile broadcasting possible and live commerce emerging as an entirely new category that is bringing revenues worth hundreds of billions of dollars: Live Streaming Market Growth Drivers The two major market growth factors behind the rapid expansion of the Live Streaming Market include deployment of the 5G network around the world that removes bandwidth and latency challenges faced by mobile live streamings in the past as well as the commercial success of the live commerce model as a new retailing concept, earning revenues worth several hundred billion dollars annually from China alone and spreading its wings to other parts of the globe.
Twitch's 35 million daily active users, India's 969.10 million internet subscribers as of March 2025, and China's live commerce ecosystem generating USD 600 billion in annual transactions collectively confirm that live streaming has achieved simultaneous mass adoption across entertainment consumption.
Market Restraints
Emerging market broadband gaps, real-time content moderation difficulties, creator burnout endangering supply side quality: An important factor restraining growth in the Live Streaming Market is the continuing existence of the broadband connectivity gap in many emerging economies, whereby low mobile data costs, unreliable networks, and bandwidth limitations reduce not only the quality of the live streaming experience for viewers but also the capacity of local content producers to create high-quality streams at the levels expected by viewers in developed countries. Content moderation of live stream media, whereby the automated and real-time screening process to eliminate harmful material, copyright infringement, and violations of community guidelines becomes extremely difficult at the scale of major platforms, where live broadcasts occur simultaneously in the millions and no post production period is available for reviewing potential content, presents challenges and liability risks that smaller live streaming providers find impossible to address adequately. The threat of creator burnout from constant scheduling expectations and viewer interaction imperiling quality is an additional challenge to sustaining engagement.
Market Opportunities
Global expansion of live commerce, immersive live streaming powered by VR/AR technologies, and sports rights streaming: The global expansion of live commerce services outside China into South East Asia, India, United States, and Europe is the single largest commercial opportunity in the live streaming industry, where the demonstrated capability of live product demos combined with on-the-fly purchase capabilities to generate tenfold higher conversion rates compared to static e-commerce product pages makes it a game-changing retail platform for brands and content creators capable of using the live commerce service properly. The immersive live streaming with the inclusion of VR/AR, mixed realities, and spatial audio opens up entirely new possibilities for live streaming entertainment and social interactions beyond the visual limitations of today’s 2D live streaming technologies, creating premium consumer entertainment experiences that will generate revenues through subscriptions and tickets significantly above current live streaming monetization models. The progressive transition of sports rights from television broadcasts to live streaming services, where the younger demographic groups concentrate, creates increasing revenue generation from sports rights streaming that will be one of the largest new revenue streams of the live streaming market for the forecasted period.
Recent Developments:
-
2025: YouTube expanded its live shopping features with enhanced product tagging, real-time inventory display, and checkout integration enabling creators and brands to conduct live commerce broadcasts reaching YouTube's 2.5 billion monthly active users across all device types.
-
2025: TikTok advanced TikTok Shop's live streaming integration across multiple markets including the U.S., UK, and Southeast Asia, with live commerce broadcasts by creators and brand partners driving significant gross merchandise value through real-time product demonstration and limited-time offer activation.
-
2025: Netflix announced expansion of its live streaming capabilities for live entertainment events, sports, and reality programming, investing in ultra-low latency streaming infrastructure to compete for live content audiences currently served by Twitch, YouTube Live, and linear broadcast networks.
Live Streaming Market Key Players
-
Amazon.com Inc. (Twitch)
-
Google LLC (YouTube Live)
-
Meta Platforms Inc. (Facebook Live, Instagram Live)
-
ByteDance Ltd. (TikTok Live)
-
Apple Inc. (Apple TV Plus Live)
-
Microsoft Corporation (LinkedIn Live)
-
Netflix Inc.
-
Tencent Holdings Ltd. (Weixin Live)
-
Baidu Inc. (iQIYI)
-
Alibaba Group (Taobao Live)
-
Brightcove Inc.
-
IBM Corporation (Watson Media)
-
Kaltura Inc.
-
Wowza Media Systems
-
Dacast Inc.
-
Streamlabs (CORSAIR)
-
Restream Inc.
-
StreamYard (Hopin)
-
Agora Inc.
-
Millicast (Dolby)
Live Streaming Market Report Scope
| Report Attributes | Details |
|---|---|
| Market Size in 2025 | USD 139.57 Billion |
| Market Size by 2035 | USD 1,131.63 Billion |
| CAGR | CAGR of 23.28% From 2026 to 2035 |
| Base Year | 2025 |
| Forecast Period | 2026-2035 |
| Historical Data | 2022-2024 |
| Report Scope & Coverage | Market Size, Segments Analysis, Competitive Landscape, Regional Analysis, DROC & SWOT Analysis, Forecast Outlook |
| Key Segments | • By Component (Software, Hardware, Services) • By Format (Video Streaming, Audio Streaming) • By Platform (Social Media Platforms, Dedicated Streaming Platforms, Enterprise Platforms, Others) • By End-User (Media and Entertainment, Gaming and Esports, Education, Healthcare, Enterprise and Corporate Events, Others) • By Revenue Model (Advertising, Subscription, Pay-Per-View, Tipping and Gifting, Others) |
| Regional Analysis/Coverage | North America (US, Canada), Europe (Germany, UK, France, Italy, Spain, Russia, Poland, Rest of Europe), Asia Pacific (China, India, Japan, South Korea, Australia, ASEAN Countries, Rest of Asia Pacific), Middle East & Africa (UAE, Saudi Arabia, Qatar, South Africa, Rest of Middle East & Africa), Latin America (Brazil, Argentina, Mexico, Colombia, Rest of Latin America). |
| Company Profiles | Amazon.com Inc. (Twitch); Google LLC (YouTube Live); Meta Platforms Inc. (Facebook Live, Instagram Live); ByteDance Ltd. (TikTok Live); Apple Inc. (Apple TV Plus Live); Microsoft Corporation (LinkedIn Live); Netflix Inc.; Tencent Holdings Ltd. (Weixin Live); Baidu Inc. (iQIYI); Alibaba Group (Taobao Live); Brightcove Inc.; IBM Corporation (Watson Media); Kaltura Inc.; Wowza Media Systems; Dacast Inc.; Streamlabs (CORSAIR); Restream Inc.; StreamYard (Hopin); Agora Inc.; Millicast (Dolby) |
Frequently Asked Questions
Asia Pacific is projected to grow at the fastest regional CAGR of approximately 25.23% through 2035, driven by China's enormous live commerce ecosystem generating hundreds of billions in annual transactions.
Gaming and Esports is expected to grow at the fastest CAGR through 2035, driven by competitive gaming's extraordinary audience development with Twitch reaching 35 million daily active users, esports tournament viewership rivalling traditional sports in youth demographics.
Video Streaming dominated the Live Streaming Market in 2025 with approximately 72% of global revenues.
The Live Streaming Market was valued at USD 139.57 billion in 2025.
The Live Streaming Market is expected to grow at a CAGR of 23.28% from 2026 to 2035.
Get in Touch
