Livestock Identification Market Size & Growth:
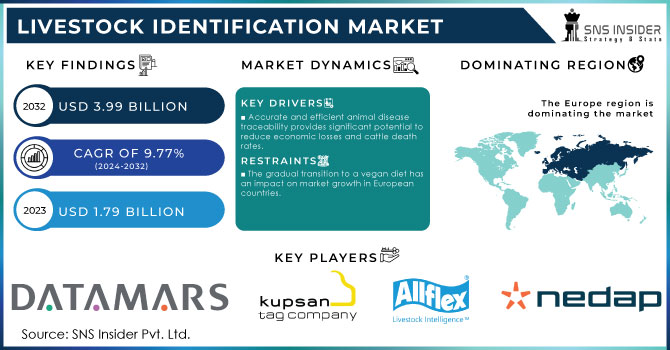
The Livestock Identification Market Size was valued at USD 1.79 Billion in 2023 and is expected to reach USD 3.99 Billion by 2032 and grow at a CAGR of 9.77% over the forecast period 2024-2032.
An important part of livestock production is livestock identification. Cattle were once identified manually and managed, and kept on farms by installing visible fences. On the other hand, advanced technologies have made it possible to track, identify, and monitor agricultural animals in real-time. Biometric sensors, for instance, are advanced real-time technologies that identify and track each animal's life and activity in real time, allowing farmers to integrate this data into human-related analyzes. Large data calculation solutions rely on mathematical algorithms to navigate complex data sets and provide farmers with appropriate trend patterns and decision-making tools to collect and integrate real-time data from biometric sensors.
Livestock Identification Market Size and Forecast
-
Market Size in 2023: USD 1.79 Billion
-
Market Size by 2032: USD 3.99 Billion
-
CAGR: 9.77% from 2024 to 2032
-
Base Year: 2023
-
Forecast Period: 2024–2032
-
Historical Data: 2020-2022
Get more information on Livestock Identification Market - Request Sample Report
Livestock Identification Market Trends:
-
Growing enforcement of animal traceability regulations is driving adoption, with over 85% of cattle in developed markets tagged using RFID or visual ID systems.
-
Rising outbreaks of animal diseases are accelerating demand for tracking solutions, as livestock monitoring programs have expanded by 30% globally in the past decade.
-
Increasing use of RFID and electronic ear tags is improving farm management efficiency, reducing livestock loss by 20–25%.
-
Integration of IoT and cloud-based herd management platforms is rising, with over 55% of large farms using digital livestock monitoring systems.
-
Growth in meat and dairy exports is boosting identification adoption, as export-oriented farms show 40% higher deployment of traceability technologies.
Livestock Identification Market KEY DRIVERS:
-
Accurate and efficient animal disease traceability provides significant potential to reduce economic losses and cattle death rates.
-
Livestock farmers are putting a greater emphasis on real-time animal identification and tracking.
-
For efficient operation of cattle farms, automation technology, and IoT-enabled equipment are being rapidly used.
Livestock Identification Market RESTRAINTS:
-
Expensive electronic identification gadgets.
-
The gradual transition to a vegan diet has an impact on market growth in European countries.
Livestock Identification Market OPPORTUNITIES:
-
In developing countries, livestock identification solutions are becoming more popular.
-
A growing number of government initiatives are encouraging the use of livestock identification technology.
Livestock Identification Market CHALLENGES:
-
Livestock plays a significant role in the production of greenhouse gases.
-
Ranchers and farm owners have a low level of awareness about the benefits of livestock identification solutions.
IMPACT OF COVID-19:
During the epidemic, end users of various livestock identification solutions around the world were severely affected. The epidemic led to the closure of the factory. On the other hand, various industries have been operating at lower levels than usual and continue to face new limitations due to concerns about the continuing increase in cases and the arrival of the third and fourth waves of the epidemic in some countries around the world. As productive crops remained closed and buyers stayed at home due to land closures, the impact of the epidemic profoundly affected the labor force, leading to the low availability of farm workers. The supply chains of major livestock identification manufacturers, especially those based in the US, UK, China, Brazil, India, and France, have been hit hard by the epidemic. Prior to the outbreak of the COVID-19 epidemic, manufacturers of livestock identification solutions were hopeful that by 2020 it would see a normal state of development, which is fueled by increased public awareness of the benefits of livestock identification solutions and the number of livestock worldwide. However, the need for livestock identification solutions has decreased significantly after the outbreak. However, the global demand for livestock identification solutions increased after Q1 2021.
Livestock Identification Market Segment Overview:
By Offering
The livestock identification market is subdivided into hardware, software, and service. Hardware is accounted for the largest share 75% of the livestock identification market, The large market size of this category is due to the increase in the use of electronic and visual identification tags, students, and applications from all small, medium, and large farms around the world to show ownership of a particular animal. These machines play an important role in livestock management through animal identification; keeping records related to production, age, health, and reproductive status, which helps farmers to make informed decisions about livestock management. These machines also send warning signs of animal attacks to farmers.
By Species
The livestock identification market is segmented into Poultry, Swine, Cattle, and Others. Proper identification of cattle is essential for good production and profitability in the cattle business. Manual identification and management of medium-sized livestock farms are expensive and time-consuming. Therefore, automated livestock identification solutions are preferred over manual diagnostics and management procedures. Livestock identification is important in owning and selling cattle. It enables farmers to make management decisions to improve cattle production. In addition, the increase in the number of cattle in the world increases the need for cattle identification solutions.
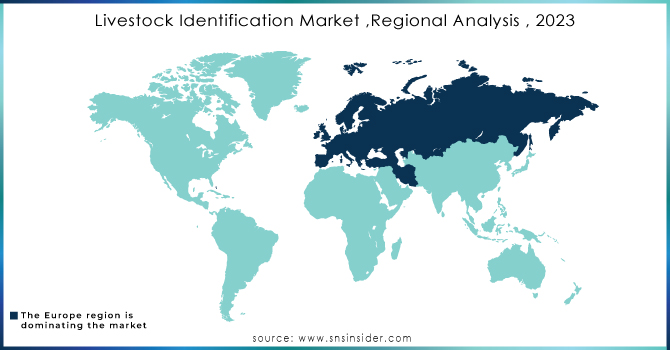
Livestock Identification Market Regional Analysis:
Europe hosted the largest market share of the world's livestock identification market. Growth could be due to an increase in demand for pork in the European Union. The European Union's animal identification regulations also help to grow the region's livestock identification market.
Need any customization research on Livestock Identification Market - Enquiry Now
Livestock Identification Companies are:
-
Nedap
-
Livestock Improvement Corporation
-
Leader Products
-
Datamars
-
MS Schippers
-
Shearwell Data
-
CAISLEY International
-
Luoyang Laipson Information Technology
-
Other Players.
| Report Attributes | |
|---|---|
| Market Size in 2023 | US$ 1.79 Billion |
| Market Size by 2032 | US$ 3.99 Billion |
| CAGR | CAGR of 9.77 % from 2024 to 2032 |
| Base Year | 2023 |
| Forecast Period | 2024-2032 |
| Historical Data | 2020-2021 |
| Report Scope & Coverage | Market Size, Segments Analysis, Competitive Landscape, Regional Analysis, DROC & SWOT Analysis, Forecast Outlook |
| Key Segments | • By Offering (Hardware, Software, Service) • By Device Lifecycle (Short Term, Long Term) • By Species (Poultry, Swine, Cattle, Others) |
| Regional Analysis/Coverage | North America (US, Canada, Mexico), Europe (Eastern Europe [Poland, Romania, Hungary, Turkey, Rest of Eastern Europe] Western Europe] Germany, France, UK, Italy, Spain, Netherlands, Switzerland, Austria, Rest of Western Europe]), Asia Pacific (China, India, Japan, South Korea, Vietnam, Singapore, Australia, Rest of Asia Pacific), Middle East & Africa (Middle East [UAE, Egypt, Saudi Arabia, Qatar, Rest of Middle East], Africa [Nigeria, South Africa, Rest of Africa], Latin America (Brazil, Argentina, Colombia, Rest of Latin America) |
| Company Profiles | Allflex Livestock Intelligence, Nedap, Livestock Improvement Corporation, Leader Products, Kupsan Tag Company, Datamars, MS Schippers, Shearwell Data, CAISLEY International, Luoyang Laipson Information Technology and Other. |
| Key Drivers | • Accurate and efficient animal disease traceability provides significant potential to reduce economic losses and cattle death rates. • Livestock farmers are putting a greater emphasis on real-time animal identification and tracking. |
| Restraints | • Expensive electronic identification gadgets. • The gradual transition to a vegan diet has an impact on market growth in European countries. |
Frequently Asked Questions
Manufacturers, Consultants, Association, Research Institutes, private and university libraries, suppliers, and distributors of the product.
Top-down research, bottom-up research, qualitative research, quantitative research, and Fundamental research.
The key players in the Livestock Identification market are Allflex Livestock Intelligence, Nedap, Livestock Improvement Corporation, Leader Products, Kupsan Tag Company, Datamars, MS Schippers, Shearwell Data, CAISLEY International, Luoyang Laipson Information Technology and Other.
The market has been segmented with respect to offering, device life cycle and species.
The Livestock Identification Market Size was valued at USD 1.79 Billion in 2023 and is expected to reach USD 3.99 Billion by 2032 and grow at a CAGR of 9.77% over the forecast period 2024-2032.
Get in Touch
