Low Foam Surfactants Market Report Scope & Overview:
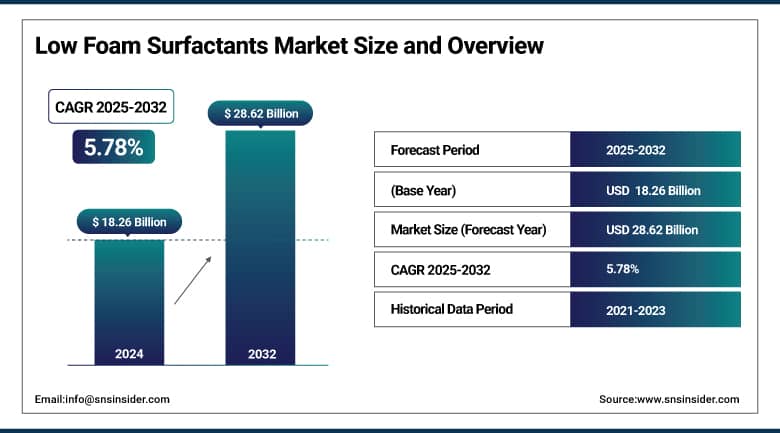
The Low Foam Surfactants Market size was valued at USD 18.26 billion in 2024 and is expected to reach USD 28.62 billion by 2032, growing at a CAGR of 5.78% over the forecast period of 2025-2032.
The low foam surfactants market is expanding at a healthy pace, owing to an increase in demand for bio-degradable formulations, bio-based surfactants, and industrial low foam surfactants. Regulatory measures, including the U.S. state restrictions on 1,4-dioxane, are driving the use of low-foam detergent additives that meet safety standards. Major low foam surfactants companies, including Nouryon, have developed AG 6206, an EPA CleanGredients and Safer Choice-designated biodegradable surfactant. EPA-listed, Stepan’s BIO-TERGE PAS 7S is an example of such innovation in sustainable cleaning. Additionally, the market trends for low foam surfactants are also influenced by digital resources and partnerships in personal care, pharma, and home care.
More than 950 surfactants are on the safer chemical ingredients list, and nearly 2,000 products have the safer choice label, according to the E.P.A. This is likely to provide downward pressure on the low foam surfactants market growth and enhance the low foam surfactants market trends, and exhibit the evolution of the low foam surfactants industry due to the existing low foam surfactants market size and key low foam surfactants market analysis.
To Get More Information On Low Foam Surfactants Market - Request Free Sample Report
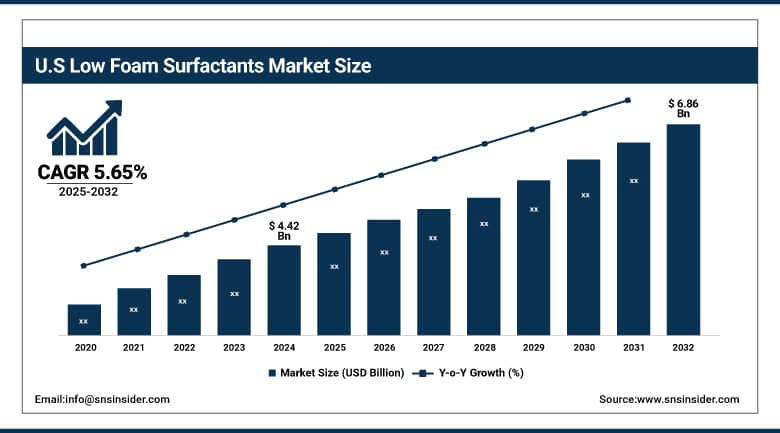
The U.S. dominated North America’s low foam surfactants segment in 2024, with over 70% share in institutional cleaning applications and a market size valued at USD 4.42 billion in 2024, is projected to reach a value of USD 6.86 billion in 2032 with a CAGR of 5.65%. There are now more than 950 surfactant ingredients certified in the Safer Choice program by the EPA, enabling widespread use in food processing and pharmaceutical CIP systems. Stepan increased AOS production by 25% at Millsdale, Anaheim, and Winder facilities to bolster the national supply. At the same time, Dow’s surfactants business, led by its chemical processing operations, experienced 12% growth in 2024 in its sales volume, driven by industry-wide demand for efficiency and green chemistry.
Low Foam Surfactants Market Drivers:
-
Artificial Intelligence–driven Personal Care Formulation Discovery Reduces Development Time Significantly
A rise in the use of formulation tools with artificial intelligence is changing the dynamics of the low foam surfactants market. These libraries enable businesses to replicate molecular behavior and predict surfactant performance prior to physical testing, accelerating the time it takes to bring new products to market. For instance, Nouryon introduced its BeautyCreations AI platform in 2025, reducing the number of trial cycles by 40%. This is driving innovation in low-foam detergent additives and bio-based surfactants for personal care and home care. This digitization helps meet the go-to-market schedules even more quickly and improves the market position of leading low foam surfactant players.
-
USDA BioPreferred Program Certification Accelerates the Adoption of Bio-Based Surfactants
The BioPreferred program of the USDA is a significant driver for bio-based low foam surfactants. The federal program would also have the effect of compelling agencies to favor certified products, and public labelling, which promotes consumer confidence. Over 20,000 biobased products are already in the program as of 2023, including surfactants for agriculture and industrial cleaning. This government-sanctioned recognition adds credibility to low foam surfactant players and also encourages investment in green chemistry, in line with green market trends. It further extends the market share of low foam surfactants in regulated industries.
Low Foam Surfactants Market Restraints:
-
Technical challenges in achieving a low-foam and high-performance balance limit the application range
The preparation of low foam surfactants that provide good cleaning properties and low foaming properties is difficult to prepare. Studies conducted by ARS by USDA in biosurfactant production, particularly rhamnolipids, have shown problems associated with up-scaling and purification. All of these challenges add 25%-30% to the time and cost of R&D. This has led only a few companies to propose low-foam biosurfactants at an industrial large scale with a high purity level. This limits their use in applications where uniform performance is needed, such as for pharmaceuticals and food preparation.
Low Foam Surfactants Market Segmentation Analysis:
By Product
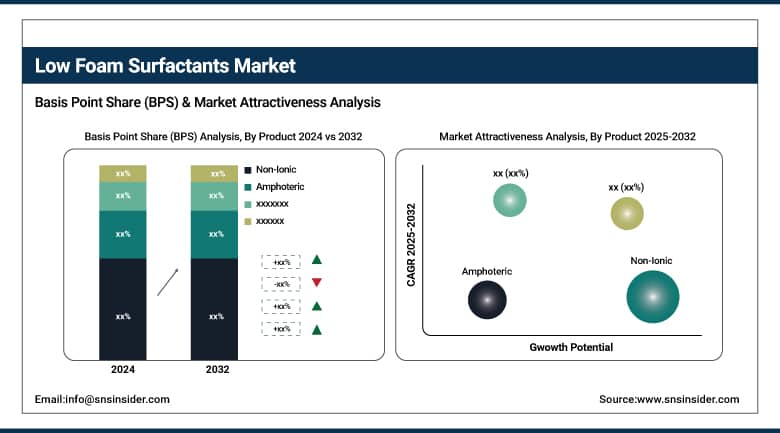
The non-ionic segment dominated the market, capturing a 45.9% share in 2024, driven by alkyl polyglucoside, which provide low-foam performance and environmental compatibility. These surfactants produce superior foam control for process applications and are EPA Safer Choice certified and included in the agency’s list of more than 950 approved surfactants. Top Low Foam Surfactants Firms, such as Nouryon and Stepan are growing their alkyl polyglucoside production to help satisfy volume demands for eco-friendly household and personal care, consolidating the sector’s position with capacity expansions globally.
The amphoteric segment emerged as the fastest-growing segment with the highest CAGR of 6.12% during the forecast period of 2025-2032. The low-foam detergents additives, such as in hard waters, are more attractive for such institutional and agrochemical applications. With more than 20,000 USDA BioPreferred program-certified biobased products, including amphoteric surfactants, this is one ingredient on which regulatory momentum is building. As a result, the leading low foam surfactant companies globally are now building global, next-generation betaine production with a view to pipeline capacity with sustainable market growth.
By Application
The personal care and cosmetics segment dominated the market, with the largest market share of 30.1% in 2024, driven by skin conditioning sub-types that include low-foaming surfactant activity interspersed with moisturizing effects. These formulas feature bio-based surfactants, such as alkyl polyglucoside to meet the needs of environmentally conscious beauty shoppers. There are more than 950 surfactants approved by the EPA Safer Choice program, which are confirmed safe for people and the planet. Top low-foam surfactant providers, including Stepan and Croda, have expanded vast skincare ranges with sustainability tie-ins and new product launches that cement segment leadership.
The pharmaceutical segment grew fastest, achieving a 6.7% CAGR over forecast period of 2025-2032. More stringent FDA clean-in-place guidelines further encourage non-ionic low-foaming surfactants in an ultraclean environment to decrease surface residues and validation time cycles. Stepan and Evonik had their early response in specialized CIP formulations, such as BIO-TERGE PAS 7S and FDA-approved E-Series detergents that spurred additional investment in pharma-grade surfactants. This consistency of regulation and performance continuity supports the segment’s overall global direction in the low foam surfactants market.
Low Foam Surfactants Market Regional Outlook:
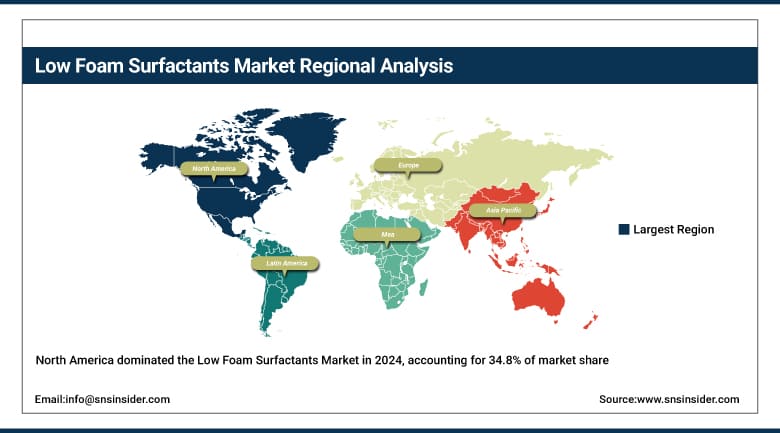
North America dominated the low foam surfactants market in 2024 with a 34.8% share, influenced by regulatory requirements, such as the E.P.A.’s Safer Choice program, which in 2024 listed 27 safer chemicals that can be used to create low-foam detergent additives. USDA’s BioPreferred purchasing regulations, however, also drove the adoption of bio-based surfactants in areas such as agriculture and personal care. Major low-foam surfactant producers, such as Dow and Stepan, increased production capacity. Steapn significantly raised alpha olefin sulfonates (AOS) production by 25% at all U.S. and Canadian plants to keep pace with the spike in demand.
Get Customized Report as Per Your Business Requirement - Enquiry Now
Asia Pacific is the fastest growing market in the low foam surfactants market, with a CAGR of 6.37% over the forecast period of 2025-2032 is due to green policies and strong end user industries. The 14th five-year plan from China called for a 10% reduction in energy and water use, and this led to interest in specialty surfactants. The eco-compliance of detergent ingredients was added to India’s 2024 draft surfactants quality control order. Bio-based surfactant development was meanwhile aided by Japan's METI smart cleaner initiative. Furthermore, rising preference for low-foam, non-ionic products within Southeast Asia’s ‘trade catering’ sector corresponds to the promotion of local environmental certification schemes, and supports regional low-foam surfactants market expansion.
Asia Pacific low foam surfactants market dominated by China in 2024, with more than 60% of the market share in regional demand. According to official data, 4.084m tons of surfactants were produced in 2022, and between the largest producers, Zanyu Technology and Lichen Industries, combined, account for 49.3% of the market. MIIT and MEM 2025 green-development targets spurred eco-friendly surfactant production in industrial parks. Sinopec and SABIC Resins JV increased its low foam surfactant production capacities to fulfil demand from electronics, agriculture, and personal care applications and help China lead in low foam surfactants.
Low Foam Surfactants Market Companies are:
-
Stepan Company
-
Clariant AG
-
Evonik Industries AG
-
Croda International Plc
-
Dow (The Dow Chemical Company)
-
Huntsman International LLC
-
Akzo Nobel N.V.
-
Kao Corporation.
Recent Developments:
-
In April 2025, Nouryon launched Armocare Aqua 12, an ISCC PLUS-certified biodegradable surfactant for hair care, offering high conditioning performance, sustainability, and compliance with renewable carbon standards.
-
In May 2024, Evonik opened the first industrial-scale rhamnolipid biosurfactant plant in Slovakia, producing biodegradable surfactants from corn-based feedstocks to support sustainable applications in cleaning and personal care.
| Report Attributes | Details |
|---|---|
| Market Size in 2024 | USD 18.26 billion |
| Market Size by 2032 | USD 28.62 billion |
| CAGR | CAGR of 5.78% From 2025 to 2032 |
| Base Year | 2024 |
| Forecast Period | 2025-2032 |
| Historical Data | 2021-2023 |
| Report Scope & Coverage | Market Size, Segments Analysis, Competitive Landscape, Regional Analysis, DROC & SWOT Analysis, Forecast Outlook |
| Key Segments | •By Product (Non-Ionic, Amphoteric, Cationic) •By Application (Personal Care & Cosmetics, Household Detergents, Industrial and Institutional Cleaners, Pharmaceutical, Agriculture, Others) |
| Regional Analysis/Coverage | North America (US, Canada, Mexico), Europe (Germany, France, UK, Italy, Spain, Poland, Turkey, Rest of Europe), Asia Pacific (China, India, Japan, South Korea, Singapore, Australia, Rest of Asia Pacific), Middle East & Africa (UAE, Saudi Arabia, Qatar, South Africa, Rest of Middle East & Africa), Latin America (Brazil, Argentina, Rest of Latin America) |
| Company Profiles | BASF SE, Stepan Company, Clariant AG, Evonik Industries AG, Croda International Plc, Solvay, Dow (The Dow Chemical Company), Huntsman International LLC, Akzo Nobel N.V., and Kao Corporation |
Frequently Asked Questions
China led the Asia Pacific Low Foam Surfactants Market with over 60% share, driven by sustainable industrial policies and producer expansions.
North America led the Low Foam Surfactants Market with 34.8% share, supported by EPA’s Safer Choice and USDA BioPreferred certifications.
Personal care and cosmetics dominated the Low Foam Surfactants Market with 30.1% share due to bio-based formulations and EPA-listed surfactants.
The Low Foam Surfactants Market is projected to reach USD 28.62 billion by 2032, driven by sustainable formulations and industrial cleaning applications.
The Low Foam Surfactants Market size reached USD 18.26 billion in 2024 due to rising eco-conscious demand and regulatory support across sectors.
Get in Touch
