Point-of-Use Water Treatment Systems Market Report Scope & Overview:
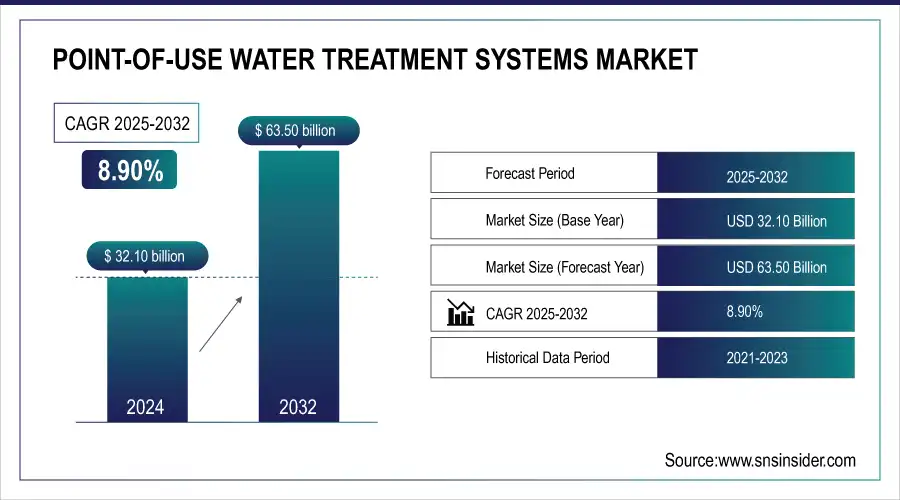
Point of Use Water Treatment Systems Market was valued at USD 32.10 Bn in 2024 and is expected to reach USD 63.50 Bn by 2032, at a CAGR of 8.90% from 2025-2032.
To get more information on Point-of-Use Water Treatment Systems Market - Request Sample Report
The Point-of-Use Water Treatment Systems market is fast emerging out of serious concerns over the quality of water and stringent regulatory standards. Increasing urbanization and industrialization have boosted the demand for dedicated, efficient, and reliable solutions at the point of use; these include residential filters, under-sink systems, and countertop units. This system deals with certain contaminants like bacteria, viruses, heavy metals, and chemicals to provide better and safer drinking water. Beginning with the severe awareness of waterborne diseases and contaminants, especially through recent reports from organizations such as the World Health Organization or the Environmental Protection Agency, gives great impetus to consumer demand for POU systems.
The constant launch of new and improved products further supports growth in the market. In September 2024, Culligan International rolled out a new series of under-sink filtration systems with multistage technology to help meet the high-performance demands against a broad range of contaminants. These trends represent a very dynamic POU water treatment systems market, spurred by technological innovation, regulatory compliance, and consumer shifts toward more sustainable preferences. The overall market is growing at a fast pace as companies come up with innovations and adapt to the ever-increasing demand for efficient and eco-friendly solutions in water treatment.
Market Size and Forecast:
-
Market Size in 2024 USD 32.10 Billion
-
Market Size by 2032 USD 63.50 Billion
-
CAGR of 8.90% From 2025 to 2032
-
Base Year 2024
-
Forecast Period 2025-2032
-
Historical Data 2021-2023
Point-of-Use Water Treatment Systems Market Trends:
-
Rising consumer awareness of water contaminants and waterborne diseases is driving demand for advanced point-of-use (POU) water treatment solutions.
-
Stricter water quality regulations globally are prompting adoption of POU systems to comply with updated safety standards.
-
Innovation in filtration technology, including enhanced contaminant removal, is improving system effectiveness and reliability.
-
Integration of smart features, such as real-time monitoring and mobile alerts, is enhancing user convenience and system management.
-
Companies are launching targeted and specialized products to address emerging pollutants like microplastics, pharmaceuticals, and PFAS.
Point-of-Use Water Treatment Systems Market Growth Drivers:
-
Rising awareness of contaminants and waterborne diseases boosts demand for effective treatment solutions.
The awareness of pollutants and waterborne diseases is growing substantially, thus the demand for efficient point-of-use water treatment alternatives rises. It is true to note that with increased global fears concerning water safety, with the statistics showing high cases of waterborne diseases and contamination, the consumers are actively seeking for trusted water treatment alternatives. For example, in June 2024, the World Health Organization reported that different parts of the world were experiencing an increase in the number of reported outbreaks of waterborne diseases which in essence set the skyrocketed need for advanced filtration systems. Such increasing awareness put the pressure on firms, for example, Brita, to think out of the box and act on improving their water purification. In March 2024, Brita introduced a new filter called Maxtra+, with improved contaminant removal capacity to cater to new kinds of pollutants, such as microplastics and pharmaceuticals. In May 2024, Aquasana rolled out a new product line of under-sink filters targeted at specific contaminants identified in new environmental studies. These innovative products markedly personify the proactive stance taken by the industry in coming up with cutting-edge solutions to meet the growing concerns of consumers about water safety. With more contamination reports and regulatory pressure to improve water quality, consumers are thus prompted to invest in point-of-use systems that provide immediate and reliable protection, further fueling growth in this market.
Point-of-Use Water Treatment Systems Market Restraints:
-
The upfront expense of advanced filtration systems may deter some consumers, impacting market adoption.
The high upfront cost of advanced filtration systems will probably be one of the major restraints to the point-of-use water treatment systems market, deterring some consumers from making the purchase. Heavy upfront costs for sophisticated systems, generally complete with state-of-the-art technology and fitted out with several stages of filtration, are unaffordable to many price-sensitive households. For example, back in February 2024, Aquasana released a whole-house filtration system with advanced filtration and smart features at over $1,000. While such premium pricing is deserved by advanced technology, it can eventually compromise its appeal to the masses. In April 2024, the high price of a new reverse osmosis system, designed for commercial use and state-of-the-art in filtration technology, further underlines just how big up-front costs are going to affect market adoption. It is these financial hurdles that will considerably hamper the pace at which advanced POU systems, with much improved performance and benefits, achieve diffusion in the market at large.
Point-of-Use Water Treatment Systems Market Opportunities:
Growing consumer preference for sustainable solutions is driving demand for eco-friendly and recyclable water treatment products. Simultaneously, increasing urban populations are expanding the need for residential point-of-use systems to tackle localized water contamination, creating significant market opportunities for innovative, efficient, and environmentally responsible water purification solutions.
Point-of-Use Water Treatment Systems Market Segment Analysis:
By Device
In 2024, the under-the-sink filters segment dominated and accounted for 40% of the point-of-use water treatment systems market in 2024, driven primarily by better filtration capabilities these devices offer and growing consumer preference for more permanent high-performance solutions. Under-the-sink filters are known for their advanced filtration technologies. These include multi-stage processes good at removing lead, chlorine, and sediments. For instance, in March 2023, APEC Water Systems introduced a new under-the-sink reverse osmosis system that claimed high performance and growing consumer demand from buyers looking for long-lasting, high-capacity filtration products. Another case is that of Culligan International, which recorded an incredible sale of under-sink filters due to efficient contaminant removal and compact installation, further proving the status of this segment as the market leader.
By Technology
In 2024, reverse osmosis systems dominated the point-of-use water treatment systems market by holding the largest market share of approximately 35%. This is possible because they are all-inclusively capable of filtering a high number of contaminants, starting from sediments and chlorine to such things as lead and dissolved salts. For instance, AquaTech Solutions introduced a state-of-the-art reverse osmosis system with multistage filtration, real-time monitoring, and a high level of interest on the part of consumers in February 2023 for the best purification performance. APEC Water Systems brought to the market, in its turn, has shared information about the high sales of its reverse osmosis units, provoking the fact that consumer demand is in a growing stage because requirements for efficient and reliable water treatment in terms of severe contamination are implemented. Thanks to the high level of technology and efficiency, reverse osmosis systems have succeeded in establishing a top-end market.
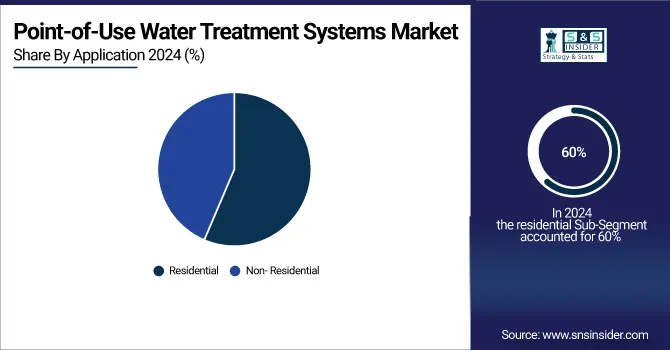
By Application
In 2024, the residential segment dominated the point-of-use water treatment systems market by holding a market share of about 60%. This is majorly due to increasing awareness of people about the quality of water and growing demand for home-based solutions to assure safe drinking water. For example, in May 2023, Brita launched a new line of pitcher filters designed for household applications, and the reception by consumers has been rapid for affordable and easy solutions to purify water at home. Also, in a statement, Aquasana said that sales had increased considerably for under-sink and countertop filters in the home application domain due to growing fears over exposure to lead and chlorine through residential supplies. This depicts that the residential segment commands a greater market share due to the broad adoption of point-of-use systems in homes, with people becoming more concerned with water quality and safety in their lives.
Point-of-Use Water Treatment Systems Market Regional Analysis:
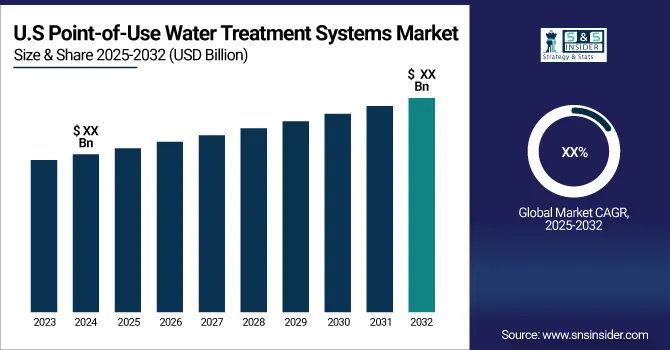
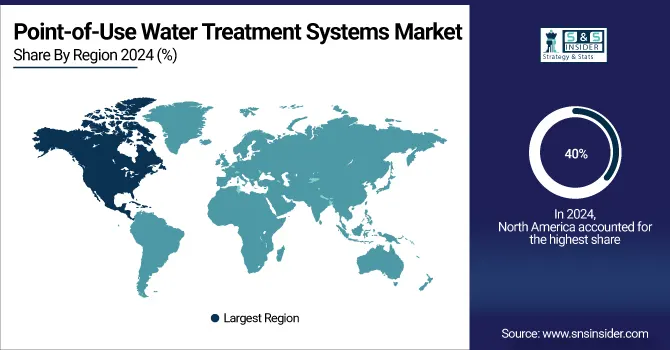
North America Point-of-Use Water Treatment Systems Market Insights
In 2024, North America dominated the point-of-use water treatment systems market and is estimated to hold a share of approximately 40%. This can be attributed to increased awareness about water quality issues and stringent regulatory standards in this region, thus driving the rapid adoption of advanced water treatment technologies. For example, in March 2023, the U.S. The Environmental Protection Agency increased the demand for proper filtration systems among households within this region by introducing new and more stringent guidelines on drinking water. This was well accounted for in the good sales by firms like Culligan International and APEC Water Systems in the U.S. and Canada, indicating that for quenching fears of contaminant exposure like lead and PFAS, consumers were going for reliable and high-performance water treatment. Moreover, a strong infrastructure and an active consumer base bettered the region's chances of becoming a leader in the market.
Get Customized Report as per your Business Requirement - Request For Customized Report
Asia Pacific Point-of-Use Water Treatment Systems Market Insights
In 2024, Asia-Pacific emerged as the fastest-growing region in the point-of-use water treatment systems market and is estimated to have accounted for a market share of approximately 25%. This high growth is informed by increasing concerns associated with water contamination, rising urbanization, and improvement in living standards across countries such as China and India. For instance, in June 2023, Kent RO Systems, a large Indian manufacturer of water purifiers, reported steep sales of its advanced reverse osmosis systems, as consumers are getting more and more sensitive to waterborne diseases. Stringent regulations by the Chinese government in its initiatives toward the betterment of water quality have boosted demand for point-of-use systems in both urban and rural areas. The growing middle class and rising environmental concerns in this region have consequently surged its adoption, making it the fastest-growing region in the market.
Europe Point-of-Use Water Treatment Systems Market Insights
Europe’s market is driven by stringent drinking water regulations, rising environmental awareness, and growing demand for sustainable and safe water solutions. Adoption of advanced filtration technologies and smart systems in households and businesses is increasing. Government initiatives and proactive consumer behavior further support the expansion of point-of-use water treatment systems.
Latin America (LATAM) and Middle East & Africa (MEA) Point-of-Use Water Treatment Systems Market Insights
LATAM and MEA markets are expanding due to rising urbanization, increasing water contamination concerns, and limited centralized water treatment infrastructure. Growing awareness of safe drinking water and adoption of residential and commercial point-of-use systems drive growth. Government initiatives and investments in water safety further accelerate market demand in these regions.
Point-of-Use Water Treatment Systems Market Key Players:
-
Pentair PLC.
-
3M Company
-
Honeywell International Inc.
-
Culligan International
-
Danaher Corporation.
-
Calgon Carbon Corporation
-
Best Water Technology AG
-
Panasonic Corporation
-
Unilever PLC (Pureit)
-
LG Electronics Inc.
-
A. O. Smith Corporation
-
Brita LP
-
Eureka Forbes Ltd.
-
EcoWater Systems LLC
-
Kent RO Systems Ltd.
-
Coway Co., Ltd.
-
Bluewater Group
-
Aquasana, Inc.
Competitive Landscape for Point-of-Use Water Treatment Systems Market:
Hindustan Unilever, through its Pureit brand, is a leading player in the point-of-use water treatment systems market. The company offers innovative and affordable filtration solutions for households, focusing on contaminant removal, safety, and convenience. Pureit products emphasize sustainability and reliability, catering to growing consumer demand for safe drinking water in India.
-
July 2023: Hindustan Unilever introduced the Pureit Revito range of water purifiers that saved up to 70% of water, enriched it further with magnesium and calcium minerals, enhanced sediment filter, and improved UV-in-tank sterilization.
Philips, a global leader in health and consumer technology, offers advanced point-of-use water treatment solutions focused on safety, efficiency, and user convenience. Its products incorporate innovative filtration technologies and smart features, catering to residential and commercial needs while emphasizing sustainability, reliability, and improved access to clean and safe drinking water.
-
January 2023: Philips partnered with Aquaporin to supply membrane technology for water purifiers in China.
| Report Attributes | Details |
| Market Size in 2024 | USD 32.10 Billion |
| Market Size by 2032 | USD 63.50 Billion |
| CAGR | CAGR of 8.90% From 2025 to 2032 |
| Base Year | 2024 |
| Forecast Period | 2025-2032 |
| Historical Data | 2021-2023 |
| Report Scope & Coverage | Market Size, Segments Analysis, Competitive Landscape, Regional Analysis, DROC & SWOT Analysis, Forecast Outlook |
| Key Segments | •By Device (Tabletop pitchers, Faucet-mounted filters, Counter-top units, under-the-sink filters, Others), •By Technology (Reverse osmosis systems, Ultrafiltration systems, Distillation systems, Disinfection methods, Filtration methods, Ion exchange, Others) •By Application (Residential, Non- Residential) |
| Regional Analysis/Coverage | North America (US, Canada), Europe (Germany, UK, France, Italy, Spain, Russia, Poland, Rest of Europe), Asia Pacific (China, India, Japan, South Korea, Australia, ASEAN Countries, Rest of Asia Pacific), Middle East & Africa (UAE, Saudi Arabia, Qatar, South Africa, Rest of Middle East & Africa), Latin America (Brazil, Argentina, Mexico, Colombia, Rest of Latin America). |
| Company Profiles | Pentair PLC., The Dow Chemical Company, 3M Company, Honeywell International Inc., Culligan International, Danaher Corporation., Calgon Carbon Corporation, Best Water Technology AG, Watts Water Technologies, Inc. and other players |
Frequently Asked Questions
Ans: Point of Use Water Treatment Systems Market was valued at USD 32.10 Bn in 2024 and is expected to reach USD 63.50 Bn by 2032, at a CAGR of 8.90% from 2025-2032.
Ans: Rising preference for sustainable solutions presents opportunities for eco-friendly and recyclable water treatment products and increasing urban populations create a larger market for residential water treatment systems to address localized contamination issues are the opportunities that fuel the demand for the Point-of-Use Water Treatment Systems market.
Ans: The upfront expense of advanced filtration systems may deter some consumers, impacting market adoption hamper the demand for the Point-of-Use Water Treatment Systems market.
Ans: Pentair PLC., The Dow Chemical Company, 3M Company, Honeywell International Inc., Culligan International, Danaher Corporation., Calgon Carbon Corporation, Best Water Technology AG and Watts Water Technologies, Inc. are the major key players of Point-of-Use Water Treatment Systems Market.
Ans: The North America region dominated the Point-of-Use Water Treatment Systems Market holding the largest market share of about 40% during the forecast period.
Get in Touch
