image

Protective Textiles Market Size, Share & Segmentation By Application (Heat & Flame-resistant Clothing, Mechanical, Chemical, Electrical, Ballistic, Space Suits, Health Care Garments, and Others), and Region | Global Forecast for 2025–2032

Date: June 2025 Report Code: SNS/C&M/7594 Page 245

Protective Textiles Market Report Scope & Overview:
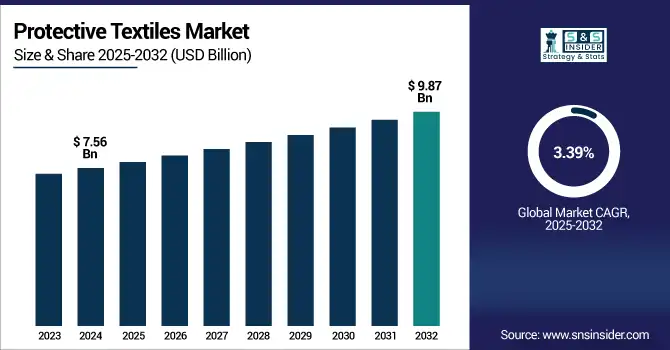
The protective textiles market size was USD 7.56 billion in 2024 and is expected to reach USD 9.87 billion by 2032, growing at a CAGR of 3.39% over the forecast period of 2025-2032.

Protective textiles market analysis highlights the expansion of industrial and manufacturing activities as a key factor propelling market growth. Even as construction, oil & gas, mining, automotive, and other industries become increasingly popular around the world, so does the focus on safety in the workplace and employee protection. As a result, there is a growing demand for protective textiles that provide fire, chemical, abrasion, and mechanical resistance, which drives the protective textiles market growth.

OSHA data also shows that from 1972 to 2023, worker injuries and illnesses have shown a remarkable decline from 10.9 incidents per 100 full-time workers, down to 2.4, in part due to greater safety practices and protective measures. This reduction comes as economies have gradually mobilized their manufacturing apparatus to produce millions of units of effective PPE in the form of protective clothing and textiles.

Market Dynamics:

Drivers                                                                                                                                       

  • Stringent Workplace Safety Regulations and Industrial Expansion Drive the Market Growth

The factors driving the protective textiles market growth include how industries increasingly enforce occupational safety regulations. As industrial activities do globally expand, most notably manufacturing, construction, oil & gas and mining, then the demand for high-performance protective clothing increases quite greatly. The market is expanding due to the enforcement of protective equipment by governments and organizations to lower workplace injuries. Innovations in fabric technology, including fire resistance, chemical resistance, and cut protection, have improved the effectiveness of product solutions. Such innovations are promoting wider use of protective textiles across end-use industries.

Restrain

  • High Cost of Advanced Protective Fabrics and Market Fragmentation May Hamper the Market Growth

In spite of encouraging growth, the market is hindered by the high price of sophisticated protective textiles produced with aramid fibers, carbon composites, and other high-performance fabrics. For SMEs, particularly in cost-conscious markets, these prices are expensive. Further, recurring R&D outlays and association with global quality certifications increase the cost of manufacturing. Market fragmentation is also a challenge because the presence of many regional and local players puts pressure on prices and quality consistency. This can lead to uneven product uptake, especially in emerging economies where awareness and affordability could be lacking.

Opportunities                                                  

  • Rise in Smart Textiles and Eco-Friendly Innovations Creates Opportunities in the Market

The adoption of smart textiles and wearable protective technologies can be a great opportunity in the protective textiles market. Sensors, thermoregulators, and communication systems integration into textiles is becoming more prevalent in defense, emergency services, and dangerous industries. Furthermore, increased awareness of the environment has led manufacturers to create protective textiles that are sustainable and recyclable. Such developments have an appeal among companies that are interested in achieving ESG requirements and minimizing carbon footprints. Increased application within the medical, military, and aeronautical industries also presents untapped potential. With encouraging government policies and growing R&D investments, these new trends are likely to create new avenues of growth shortly, which will drive the protective textiles market trends.

For Instance, for industrial as well as healthcare applications, 3M has ramped up its R&D investment greatly to develop textiles that are breathable and lightweight for protection.

Segmentation Analysis:

By Application

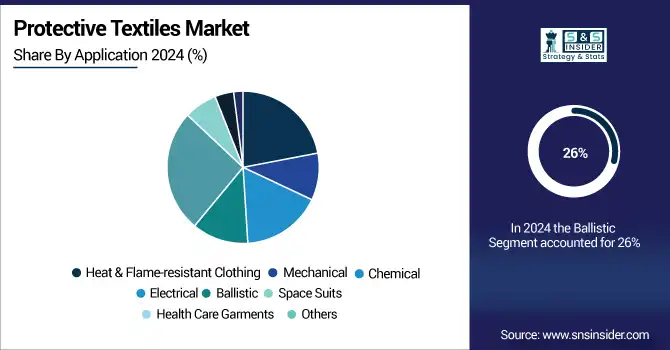
Ballistic held the largest protective textiles market share, around 26%, in 2024. This dominance is mainly due to rising demand from military personnel, law enforcement agencies, and security forces all over the world, who are mainly dependent on ballistic-resistant apparel and equipment like body armor, helmets, and bulletproof jackets. Such fabrics are designed with high-strength materials such as aramid and ultra-high molecular weight polyethylene, which exhibit enhanced impact and penetration resistance. Political tensions, increasing defense spending, and the increased demand for next-generation personnel protection systems continue to spur this demand.

Heat & Flame-resistant clothing held a significant protective textiles market share. It is due to these fabrics are usually constructed from high-tech materials such as Nomex, modacrylics, and aramid fibers, providing not only flame resistance but also durability and comfort. With industrialization increasing worldwide, especially in riskier operations, the need for flame-resistant clothing keeps growing. Also, the increasing concern towards workplace safety and strict regulatory compliance, particularly in North America and Europe, is further enhancing the demand for dependable flame-resistant apparel in both the private and public sectors.

Regional Analysis:

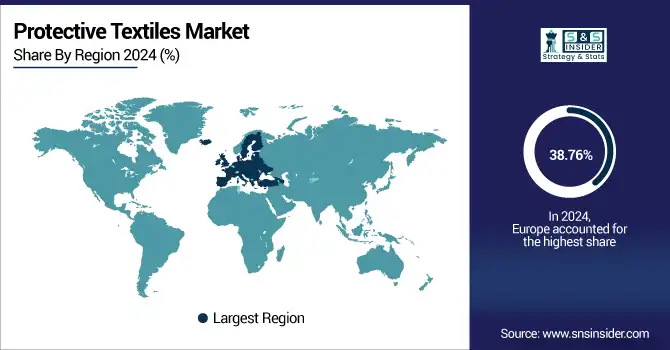
Europe held the largest market share, around 38.76%, in 2024. It is because of its robust regulatory environment, sophisticated industrial base, and elevated safety consciousness in major sectors. The region has strict workplace safety regulations implemented by organizations such as the European Agency for Safety and Health at Work (EU-OSHA), which requires wearing certified protective clothing in manufacturing, oil & gas, chemicals, and firefighting sectors. Europe is also home to some of the world's leading players in protective textile technology, with continued investment in smart and sustainable textile technologies. Furthermore, the availability of a mature defense industry and high government expenditure on public protection and military gear also propels market growth. Germany, France, and the U.K. are major contributors, promoted by sophisticated R&D capabilities, conformity standards, and favorable worker safety culture, which drive the protective textiles industry.

In June 2022, DuPont introduced Nomex Comfort with EcoForce technology in Luxembourg a flame-resistant material with a chemical-repellent, bio-based finish that resists up to 50 wash cycles and meets essential EU safety standards

North America protective textiles market held a significant market share and is the fastest-growing segment in the forecast period. It is owing to its well-established industrial base, stringent safety regulations, in addition to major industry players' strong presence. The U.S., in its turn, has rather stringent occupational safety rules that are implemented by bodies such as OSHA (Occupational Safety and Health Administration) that do mandate the use of some certified protective gear in industries such as construction, oil & gas, defense, healthcare, and manufacturing. The region has high defense spending. This spending implies a consistent demand for flame-resistant and for ballistic materials for law enforcement and defense personnel.

The U.S. protective textiles market size was USD 1.36 billion in 2024 and is expected to reach USD 1.80 billion by 2032 and grow at a CAGR of 4.20% over the forecast period of 2025-2032. It is because of its robust industrial base, strict regulation enforcement, and continuous investment in worker protection and defense. The country has mature safety standards regulated by bodies like OSHA and NFPA, which require use of high-end protective clothing in sectors like oil & gas, chemical manufacturing, construction, and emergency response. The defense sector of the U.S. also drives high demand for ballistic and flame-resistant fabric, supported by one of the world's largest military budgets.

Asia Pacific held a significant market share in the forecast period. It is due to its rapidly growing industrial base, expanding workforce, and increasing emphasis on occupational safety among major economies such as China, India, Japan, and South Korea. Vibrant construction, oil & gas, mining, and manufacturing industries in the region demand enormous amounts of protective clothing and equipment to shield workers in dangerous environments. Government actions to protect workers and increase industrial risk awareness are pushing safety compliance closer, especially among emerging economies.

Key Players:

The major Protective textiles companies are DuPont, 3M, Honeywell International Inc., Teijin Limited, TenCate Protective Fabrics, Milliken & Company, Lakeland Industries, Inc., W. L. Gore & Associates, Inc., Glen Raven, Inc., Ansell Limited, and Others.

Recent Development:

  • In 2024, DuPont launched the Tyvek 600 Plus Pro range of pharmacy and cleanroom protective clothing in March 2024. It features better particle barrier performance and ergonomic comfort, with over 80,000 units sold in Europe, and showcasing continued investment in special protective clothing.

  • In 2023, Honeywell introduced SmartWear Defender V2, featuring five typesof sensors to monitor heat and chemical exposure. It was already installed in 900+ industrial sites in North America by end-2023, which reflects heavy investment in smart protective clothing.

Protective Textiles Market Report Scope

Report Attributes Details
Market Size in 2024 USD 7.56 Billion 
Market Size by 2032 USD 9.87 Billion 
CAGR CAGR of3.39% From 2025 to 2032
Base Year 2024
Forecast Period 2025-2032
Historical Data 2021-2023
Report Scope & Coverage Market Size, Segments Analysis, Competitive Landscape, Regional Analysis, DROC & SWOT Analysis, Forecast Outlook
Key Segments •By Application (Heat & Flame-resistant Clothing, Mechanical, Chemical, Electrical, Ballistic, Space Suits, Health Care Garments, Others) 
Regional Analysis/Coverage North America (US, Canada, Mexico), Europe (Germany, France, UK, Italy, Spain, Poland, Turkey, Rest of Europe), Asia Pacific (China, India, Japan, South Korea, Singapore, Australia, Rest of Asia Pacific), Middle East & Africa (UAE, Saudi Arabia, Qatar, South Africa, Rest of Middle East & Africa), Latin America (Brazil, Argentina, Rest of Latin America)
Company Profiles DuPont, 3M, Honeywell International Inc., Teijin Limited, TenCate Protective Fabrics, Milliken & Company, Lakeland Industries, Inc., W. L. Gore & Associates, Inc., Glen Raven, Inc., Ansell Limited.

Frequently Asked Questions

Ans: The Protective Textiles Market was valued at USD 7.56 billion in 2024.

Ans: The expected CAGR of the global Protective Textiles Market during the forecast period is 3.39%

Ans:   Ballistic will grow rapidly in the Protective Textiles Market from 2025 to 2032.

Ans: Stringent workplace safety regulations and industrial expansion drive the market growth.

Ans: Europe led the Protective Textiles Market in the region with the highest revenue share in 2024.

Table of contents

1. Introduction

1.1 Market Definition

1.2 Scope (Inclusion and Exclusions)

1.3 Research Assumptions

2. Executive Summary

2.1 Market Overview

2.2 Regional Synopsis

2.3 Competitive Summary

3. Research Methodology

3.1 Top-Down Approach

3.2 Bottom-up Approach

3.3. Data Validation

3.4 Primary Interviews

4. Market Dynamics Impact Analysis

4.1 Market Driving Factors Analysis

4.1.1 Drivers

4.1.2 Restraints

4.1.3 Opportunities

4.1.4 Challenges

4.2 PESTLE Analysis

4.3 Porter’s Five Forces Model

5. Statistical Insights and Trends Reporting

5.1 Production Capacity and Utilization by Country, By Application, 2024

5.2 Feedstock Prices by Country, and Type, 2024

5.3   Regulatory Impact by Country and By Application 2024.

5.4 Environmental Metrics: Emissions Data, Waste Management Practices, and     Sustainability Initiatives by Region

5.5 Innovation and R&D, Type, 2024

6. Competitive Landscape

6.1 List of Major Companies, By Region

6.2 Market Share Analysis, By Region

6.3 Product Benchmarking

6.3.1 Product specifications and features

6.3.2 Pricing

6.4 Strategic Initiatives

6.4.1 Marketing and promotional activities

6.4.2 Distribution and Supply Chain Strategies

6.4.3 Expansion plans and new product launches

6.4.4 Strategic partnerships and collaborations

6.5 Technological Advancements

6.6 Market Positioning and Branding

7. Protective Textiles Market Segmentation, By Application

     7.1 Chapter Overview

     7.2 Heat & Flame-resistant Clothing

             7.2.1 Heat & Flame-resistant Clothing Analysis Market Trends Analysis (2021-2032)

             7.2.2 Heat & Flame-resistant Clothing Analysis Market Size Estimates and Forecasts to 2032 (USD Billion)

     7.3 Mechanical

             7.3.1 Mechanical Market Trends Analysis (2021-2032)

7.3.2 Mechanical Market Size Estimates and Forecasts to 2032 (USD Billion)

       7.4 Chemical

             7.4.1 Chemical Market Trends Analysis (2021-2032)

7.4.2 Chemical Market Size Estimates and Forecasts to 2032 (USD Billion)

      7.5 Electrical

             7.5.1 Electrical Market Trends Analysis (2021-2032)

7.5.2 Electrical Market Size Estimates and Forecasts to 2032 (USD Billion)

       7.6 Ballistic 

7.6.1 Ballistic Market Trends Analysis (2021-2032)

7.6.2 Ballistic Market Size Estimates and Forecasts to 2032 (USD Billion)

       7.7 Space Suits

7.7.1 Space Suits Market Trends Analysis (2021-2032)

7.7.2 Space Suits Market Size Estimates and Forecasts to 2032 (USD Billion)

       7.8 Health Care Garments

7.8.1 Health Care Garments Market Trends Analysis (2021-2032)

7.8.2 Health Care Garment Market Size Estimates and Forecasts to 2032 (USD Billion)

       7.9 Others

7.9.1 Others Market Trends Analysis (2021-2032)

7.9.2 Others Market Size Estimates and Forecasts to 2032 (USD Billion)

8. Regional Analysis

     8.1 Chapter Overview

     8.2 North America

8.2.1 Trends Analysis

8.2.2 North America Protective Textiles Market Estimates and Forecasts, by Country (2021-2032) (USD Billion)

8.2.3 North America Protective Textiles Market Estimates and Forecasts, By Application (2021-2032) (USD Billion) 

8.2.4 USA

8.2.4.1 USA Protective Textiles Market Estimates and Forecasts, By Application (2021-2032) (USD Billion)

8.2.5 Canada

8.2.5.1 Canada Protective Textiles Market Estimates and Forecasts, By Application (2021-2032) (USD Billion)

8.2.6 Mexico

8.2.6.1 Mexico Protective Textiles Market Estimates and Forecasts, By Application (2021-2032) (USD Billion)

8.3 Europe

8.3.1 Trends Analysis

8.3.2 Europe Protective Textiles Market Estimates and Forecasts, by Country (2021-2032) (USD Billion)

8.3.3 Europe Protective Textiles Market Estimates and Forecasts, By Application (2021-2032) (USD Billion) 

8.3.4 Germany

8.3.4.1 Germany Protective Textiles Market Estimates and Forecasts, By Application (2021-2032) (USD Billion)

8.3.5 France

8.3.5.1 France Protective Textiles Market Estimates and Forecasts, By Application (2021-2032) (USD Billion)

8.3.6 UK

8.3.6.1 UK Protective Textiles Market Estimates and Forecasts, By Application (2021-2032) (USD Billion)

8.3.7 Italy

8.3.7.1 Italy Protective Textiles Market Estimates and Forecasts, By Application (2021-2032) (USD Billion)

8.3.8 Spain

8.3.8.1 Spain Protective Textiles Market Estimates and Forecasts, By Application (2021-2032) (USD Billion)

8.3.9 Poland

8.3.9.1 Poland Protective Textiles Market Estimates and Forecasts, By Application (2021-2032) (USD Billion)

8.3.10 Turkey

8.3.10.1 Turkey Protective Textiles Market Estimates and Forecasts, By Application (2021-2032) (USD Billion)

8.3.11 Rest of Europe

8.3.11.1 Rest of Europe Protective Textiles Market Estimates and Forecasts, By Application (2021-2032) (USD Billion)

8.4 Asia Pacific

8.4.1 Trends Analysis

8.4.2 Asia Pacific Protective Textiles Market Estimates and Forecasts, by Country (2021-2032) (USD Billion)

8.4.3 Asia Pacific Protective Textiles Market Estimates and Forecasts, By Application (2021-2032) (USD Billion) 

8.4.4 China

8.4.4.1 China Protective Textiles Market Estimates and Forecasts, By Application (2021-2032) (USD Billion)

8.4.5 India

8.4.5.1 India Protective Textiles Market Estimates and Forecasts, By Application (2021-2032) (USD Billion)

8.4.6 Japan

8.4.6.1 Japan Protective Textiles Market Estimates and Forecasts, By Application (2021-2032) (USD Billion)

8.4.7 South Korea

8.4.7.1 South Korea Protective Textiles Market Estimates and Forecasts, By Application (2021-2032) (USD Billion)

8.4.8 Singapore

8.4.8.1 Singapore Protective Textiles Market Estimates and Forecasts, By Application (2021-2032) (USD Billion)

8.4.9 Australia

8.4.9.1 Australia Protective Textiles Market Estimates and Forecasts, By Application (2021-2032) (USD Billion)

8.4.10 Rest of Asia Pacific

9.4.10.1 Rest of Asia Pacific Protective Textiles Market Estimates and Forecasts, By Application (2021-2032) (USD Billion)

8.5 Middle East & Africa

8.5.1 Trends Analysis

8.5.2 Middle East & Africa Protective Textiles Market Estimates and Forecasts, by Country (2021-2032) (USD Billion)

8.5.3 Middle East & Africa Protective Textiles Market Estimates and Forecasts, By Application (2021-2032) (USD Billion) 

8.5.4 UAE

8.5.4.1 UAE Protective Textiles Market Estimates and Forecasts, By Application (2021-2032) (USD Billion)

8.5.5 Saudi Arabia

8.5.5.1 Saudi Arabia Protective Textiles Market Estimates and Forecasts, By Application (2021-2032) (USD Billion)

8.5.6 Qatar

8.5.6.1 Qatar Protective Textiles Market Estimates and Forecasts, By Application (2021-2032) (USD Billion)

8.5.7 South Africa

8.5.7.1 South Africa Protective Textiles Market Estimates and Forecasts, By Application (2021-2032) (USD Billion)

8.5.8 Middle East & Africa

8.5.8.1 Middle East & Africa Protective Textiles Market Estimates and Forecasts, By Application (2021-2032) (USD Billion)

8.6 Latin America

8.6.1 Trends Analysis

8.6.2 Latin America Protective Textiles Market Estimates and Forecasts, by Country (2021-2032) (USD Billion)

8.6.3 Latin America Protective Textiles Market Estimates and Forecasts, By Application (2021-2032) (USD Billion) 

8.6.4 Brazil

8.6.4.1 Brazil Protective Textiles Market Estimates and Forecasts, By Application (2021-2032) (USD Billion)

8.6.5 Argentina

8.6.5.1 Argentina Protective Textiles Market Estimates and Forecasts, By Application (2021-2032) (USD Billion)

8.6.6 Rest of Latin America

8.6.6.1 Rest of Latin America Protective Textiles Market Estimates and Forecasts, By Application (2021-2032) (USD Billion)

9. Company Profiles

9.1 DuPont

             9.1.1 Company Overview

9.1.2 Financial

9.1.3 Products/ Services Offered

9.1.4 SWOT Analysis

9.2 3M

9.2.1 Company Overview

9.2.2 Financial

9.2.3 Products/ Services Offered

9.2.4 SWOT Analysis

9.3 Honeywell International Inc.

9.3.1 Company Overview

9.3.2 Financial

9.3.3 Products/ Services Offered

9.3.4 SWOT Analysis

9.4 Teijin Limited

9.4.1 Company Overview

9.4.2 Financial

9.4.3 Products/ Services Offered

9.4.4 SWOT Analysis

9.5 TenCate Protective Fabrics

             9.5.1 Company Overview

9.5.2 Financial

9.5.3 Products/ Services Offered

9.5.4 SWOT Analysis

9.6 Milliken & Company

             9.6.1 Company Overview

9.6.2 Financial

9.6.3 Products/ Services Offered

9.6.4 SWOT Analysis

9.7 Lakeland Industries, Inc.

             9.7.1 Company Overview

9.7.2 Financial

9.7.3 Products/ Services Offered

9.7.4 SWOT Analysis

9.8 W. L. Gore & Associates, Inc.

9.8.1 Company Overview

9.8.2 Financial

9.8.3 Products/ Services Offered

9.8.4 SWOT Analysis

9.9 Glen Raven, Inc.

             9.9.1 Company Overview

9.9.2 Financial

9.9.3 Products/ Services Offered

9.9.4 SWOT Analysis

9.10 Ansell Limited

              9.10.1 Company Overview

9.10.2 Financial

9.10.3 Products/ Services Offered

9.10.4 SWOT Analysis

10. Use Cases and Best Practices

11. Conclusion

An accurate research report requires proper strategizing as well as implementation. There are multiple factors involved in the completion of good and accurate research report and selecting the best methodology to compete the research is the toughest part. Since the research reports we provide play a crucial role in any company’s decision-making process, therefore we at SNS Insider always believe that we should choose the best method which gives us results closer to reality. This allows us to reach at a stage wherein we can provide our clients best and accurate investment to output ratio.

Each report that we prepare takes a timeframe of 350-400 business hours for production. Starting from the selection of titles through a couple of in-depth brain storming session to the final QC process before uploading our titles on our website we dedicate around 350 working hours. The titles are selected based on their current market cap and the foreseen CAGR and growth.


The 5 steps process:

Step 1: Secondary Research:

Secondary Research or Desk Research is as the name suggests is a research process wherein, we collect data through the readily available information. In this process we use various paid and unpaid databases which our team has access to and gather data through the same. This includes examining of listed companies’ annual reports, Journals, SEC filling etc. Apart from this our team has access to various associations across the globe across different industries. Lastly, we have exchange relationships with various university as well as individual libraries.

Secondary Research

Step 2: Primary Research

When we talk about primary research, it is a type of study in which the researchers collect relevant data samples directly, rather than relying on previously collected data.  This type of research is focused on gaining content specific facts that can be sued to solve specific problems. Since the collected data is fresh and first hand therefore it makes the study more accurate and genuine.

We at SNS Insider have divided Primary Research into 2 parts.

Part 1 wherein we interview the KOLs of major players as well as the upcoming ones across various geographic regions. This allows us to have their view over the market scenario and acts as an important tool to come closer to the accurate market numbers. As many as 45 paid and unpaid primary interviews are taken from both the demand and supply side of the industry to make sure we land at an accurate judgement and analysis of the market.

This step involves the triangulation of data wherein our team analyses the interview transcripts, online survey responses and observation of on filed participants. The below mentioned chart should give a better understanding of the part 1 of the primary interview.

Primary Research

Part 2: In this part of primary research the data collected via secondary research and the part 1 of the primary research is validated with the interviews from individual consultants and subject matter experts.

Consultants are those set of people who have at least 12 years of experience and expertise within the industry whereas Subject Matter Experts are those with at least 15 years of experience behind their back within the same space. The data with the help of two main processes i.e., FGDs (Focused Group Discussions) and IDs (Individual Discussions). This gives us a 3rd party nonbiased primary view of the market scenario making it a more dependable one while collation of the data pointers.

Step 3: Data Bank Validation

Once all the information is collected via primary and secondary sources, we run that information for data validation. At our intelligence centre our research heads track a lot of information related to the market which includes the quarterly reports, the daily stock prices, and other relevant information. Our data bank server gets updated every fortnight and that is how the information which we collected using our primary and secondary information is revalidated in real time.

Data Bank Validation

Step 4: QA/QC Process

After all the data collection and validation our team does a final level of quality check and quality assurance to get rid of any unwanted or undesired mistakes. This might include but not limited to getting rid of the any typos, duplication of numbers or missing of any important information. The people involved in this process include technical content writers, research heads and graphics people. Once this process is completed the title gets uploader on our platform for our clients to read it.

Step 5: Final QC/QA Process:

This is the last process and comes when the client has ordered the study. In this process a final QA/QC is done before the study is emailed to the client. Since we believe in giving our clients a good experience of our research studies, therefore, to make sure that we do not lack at our end in any way humanly possible we do a final round of quality check and then dispatch the study to the client.

Key Segments

By Application

  • Heat & Flame-resistant Clothing

  • Mechanical

  • Chemical

  • Electrical

  • Ballistic

  • Space Suits

  • Health Care Garments

  • Others

 Request for Segment Customization as per your Business Requirement: Segment Customization Request

Regional Coverage: 

North America

  • US

  • Canada

  • Mexico

Europe

  • Germany

  • France

  • UK

  • Italy

  • Spain

  • Poland

  • Turkey

  • Rest of Europe

Asia Pacific

  • China

  • India

  • Japan

  • South Korea

  • Singapore

  • Australia

  • Rest of Asia Pacific

Middle East & Africa

  • UAE

  • Saudi Arabia

  • Qatar

  • South Africa

  • Rest of Middle East & Africa

Latin America

  • Brazil

  • Argentina

  • Rest of Latin America

Request for Country Level Research Report: Country Level Customization Request

Available Customization 

With the given market data, SNS Insider offers customization as per the company’s specific needs. The following customization options are available for the report: 

  • Detailed Volume Analysis 

  • Criss-Cross segment analysis (e.g. Product X Application) 

  • Competitive Product Benchmarking 

  • Geographic Analysis 

  • Additional countries in any of the regions 

  • Customized Data Representation 

  • Detailed analysis and profiling of additional market players

Explore Key Insights 


  • Analyzes market trends, forecasts, and regional dynamics
  • Covers core offerings, innovations, and industry use cases
  • Profiles major players, value chains, and strategic developments
  • Highlights innovation trends, regulatory impacts, and growth opportunities
Request an Analyst Call