image

Marine Sensors Market Size, Share, and Segmentation By Platform (Military and Defense and Commercial), Application (Intelligence & Reconnaissance, Communication & Navigation, Electronic Warfare, Target Recognition, Surveillance & Monitoring, and Others), Type (Acoustic Sensors, Magnetic Sensors, Sonars, Pressure Sensors, Temperature Sensors, Flow and Level Sensors, and Others), Connectivity (Wired and Wireless), and Region | Global Forecast 2025-2032

Date: July 2025 Report Code: SNS/SEMI/7695 Page 300

Marine Sensors Market Report Scope & Overview:

The Marine Sensors Market Size was valued at USD 1.26 billion in 2024 and is expected to reach USD 2.11 billion by 2032 and grow at a CAGR of 6.73% over the forecast period of 2025-2032.
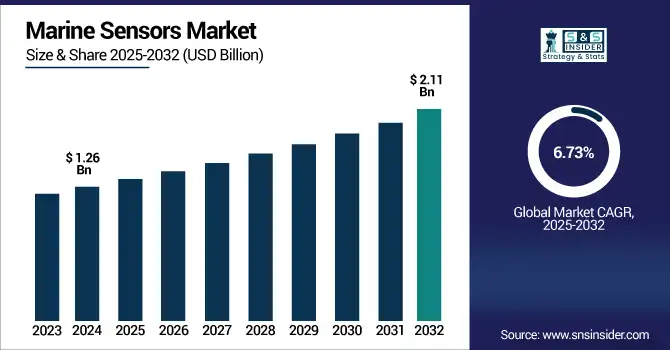
The global market for marine sensors is experiencing rapid expansion due to the increase in demand for advanced ocean monitoring systems and maritime defense solutions and smart ship solutions the trend of marine Sensors has been significantly rising. With the emergence of advanced technologies including AI-assisted sensing or IoT connectivity, and advanced underwater communication systems, marine sensors are not only more functional but also more accurate. Moreover, growing marine exploration and deep-water resources exploitation will continue to trigger the deployment of sensors. The market is also supported by increasing environmental concerns and tightening of maritime security norms, forcing industries to install advanced sensor techniques for military and commercial marine operations.

According to research, more than 65% of global marine regulatory bodies now mandate real-time environmental data logging via sensor systems for vessels operating in protected or sensitive waters.

The U.S. Marine Sensors Market size was USD 0.19 billion in 2024 and is expected to reach USD 0.34 billion by 2032, growing at a CAGR of 7.46% over the forecast period of 2025–2032.

The U.S. market growth is primarily driven by increasing investments in naval modernization, upswing in demand for homeland security, and rise in applications in offshore oil & gas activities. Leading defence contractors and sensor technology providers underwrite strong market growth, particularly as environmental monitoring and underwater surveillance are emerging as key factors in national defence and energy planning.

According to research, more than 30% of the world's top marine sensor patents originate from the U.S.-based firms, such as Raytheon, Teledyne, and Lockheed Martin.

Market Dynamics:

Key Drivers:

  • Surge in Maritime Security Concerns and Naval Modernization Initiatives Across Global Economies

Geopolitical tension and maritime law and order instability have driven the modernization of naval surveillance equipment in countries. Countries throughout Asia Pacific, Europe, and North America are outfitting their fleets with advanced sensor technology to improve situational awareness, threat detection, and operational safety. These sensors play an important role in anti-submarine warfare, real-time tracking, and underwater reconnaissance. Deployment is also being driven by government schemes and growing defence budgets, particularly with the strategic control of the oceans taking on new importance alongside economic and national security pressures in the world’s multi-polar environment.

Restraints:

  • Data Accuracy Limitations in Harsh Marine Environments Hinder Performance Reliability

Marine environments are inherently challenging, with factors including water salinity, pressure variations, temperature fluctuations, and biofouling affecting sensor performance. Inaccurate readings or sensor failure due to environmental stress can lead to mission-critical errors, especially in defense, offshore drilling, and scientific exploration. Sensor calibration and maintenance are also frequent, increasing operational costs. These limitations create trust issues among end-users and hinder widespread sensor integration unless supported by robust quality assurance protocols and environmental resilience standards in sensor design.

Opportunities:

  • Rising Adoption of Autonomous Underwater Vehicles (AUVs) and Unmanned Surface Vessels (USVs)

The global expansion of AUVs and USVs for oceanographic research, surveillance, and undersea exploration creates significant growth opportunities for marine sensors. These autonomous platforms rely on sensors for navigation, obstacle detection, environmental mapping, and data collection. Increasing investment in maritime robotics, driven by defense innovation and offshore resource management, ensures sustained demand for compact, energy-efficient, and multi-functional sensors. As unmanned systems become more mainstream across marine applications, their dependence on advanced sensor ecosystems is expected to grow exponentially.

According to research, more than 70% of newly developed AUVs and USVs in 2024 are equipped with multi-sensor suites, including sonar, Doppler velocity logs, pressure sensors, and acoustic modems.

Challenges:

  • Vulnerability of Marine Sensors to Cybersecurity Threats and Signal Interference

As marine sensors become more interconnected through IoT and satellite communication networks, they are increasingly exposed to cybersecurity risks. Threats, such as GPS spoofing, signal jamming, and unauthorized data access can compromise sensor integrity and disrupt marine operations. In high-stakes applications including naval missions or subsea exploration, such vulnerabilities pose significant risks. Additionally, electromagnetic interference from nearby electronic systems can degrade sensor signal quality. Addressing these cybersecurity and interference challenges is essential to ensuring safe, uninterrupted sensor performance in modern marine ecosystems.

Segmentation Analysis:

By Platform

The Military and Defense segment dominated the highest revenue share of around 61.10% in 2024 due to heightened naval modernization programs, increasing maritime border security threats, and rising investments in advanced surveillance and anti-submarine technologies. Companies including L3Harris Technologies have been instrumental in supplying sophisticated marine sensors for tactical defense systems. Strategic deployment of marine sensors on naval vessels, submarines, and underwater drones is significantly boosting demand. Defense forces globally are prioritizing real-time threat detection and tactical decision-making, which has reinforced the dominance of this segment.

The Commercial segment is projected to register the fastest CAGR of approximately 7.68% over 2025-2032, driven by the increasing use of marine sensors in offshore oil exploration, cargo monitoring, and commercial shipping operations. Teledyne Marine plays a crucial role in delivering sensor solutions tailored for commercial fleets and offshore platforms. The rise of smart ports and the growing emphasis on maritime safety, sustainability, and automation are contributing to this surge. Expanding global trade and the integration of sensor-based technologies for efficient fleet management are further accelerating commercial adoption.

By Application

Surveillance & Monitoring held the largest Marine Sensors Market share of 32.28% in 2024, primarily due to the critical need for real-time situational awareness across naval and coastal security applications. Companies, such as Raytheon Technologies have advanced this segment with highly integrated sensor systems for perimeter surveillance. Advanced sensors are widely utilized in submarine detection, environmental assessments, and monitoring platforms. Continuous deployment of sensor arrays ensures precise tracking and anomaly detection, supporting this segment’s strong foothold.

Communication & Navigation is projected to experience the highest CAGR of 7.92% during 2025–2032, owing to the growing integration of marine sensors in satellite-based positioning systems, autonomous vessel navigation, and data transmission infrastructures. Kongsberg Gruppen, a leader in marine technology, is increasingly innovating in communication and navigation systems for modern maritime operations. Technological advancements in sonar, GPS, and wireless communication are enhancing the reliability of marine operations. Rising adoption of digital navigation systems is a key factor driving this growth.

By Type

Flow and Level Sensors dominated the market with a 30.01% revenue share in 2024, driven by their widespread use in monitoring ballast water systems, fuel management, and fluid levels in marine processes. With expertise in fluid dynamics, Endress+Hauser has developed robust sensor technologies ensuring precision and durability in harsh marine environments. These sensors are vital for vessel stability, regulatory compliance, and operational efficiency. Their proven reliability has made them indispensable in shipboard systems across the industry.

Acoustic Sensors are anticipated to expand at the fastest CAGR of 8.45% over 2025-2032, fueled by increasing use in sonar systems, underwater mapping, and marine life detection. Sonardyne is actively pushing innovation in this space with cutting-edge acoustic positioning and communication tools. The surge in autonomous underwater vehicle (AUV) deployments and seabed surveillance is boosting demand for precise acoustic data. These sensors are becoming integral to deep-sea exploration and scientific research applications.

By Connectivity

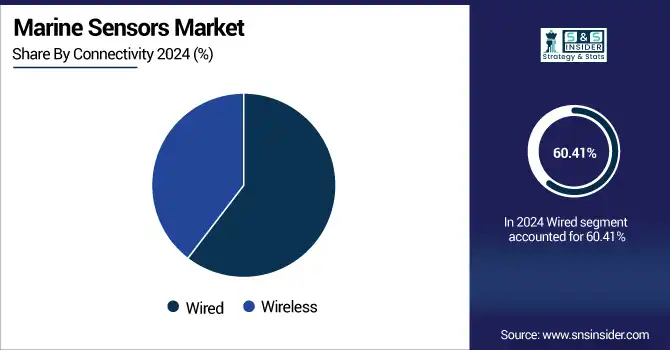
The Wired segment dominated the largest market share of 60.41% in 2024 due to its reliable performance, high-speed data transmission, and secure connectivity in harsh marine environments. Companies, such as Honeywell have developed robust wired systems that excel in fixed marine installations requiring dependable sensor data flow. Wired systems are preferred in power-sensitive operations and data-intensive networks. Their long-standing presence and mature technology support their continued dominance in marine infrastructure.

The Wireless segment is forecasted to grow at the fastest CAGR of 7.51% over 2025-2032, as advancements in wireless marine communication technologies drive adoption in mobile platforms and autonomous systems. Sea-Bird Scientific is innovating with wireless-capable marine sensors used in oceanographic research and data buoys. The demand for real-time access and flexibility in deployment is driving the shift toward wireless solutions. The rise of IoT-based marine monitoring is further supporting this growth.
Regional Analysis:

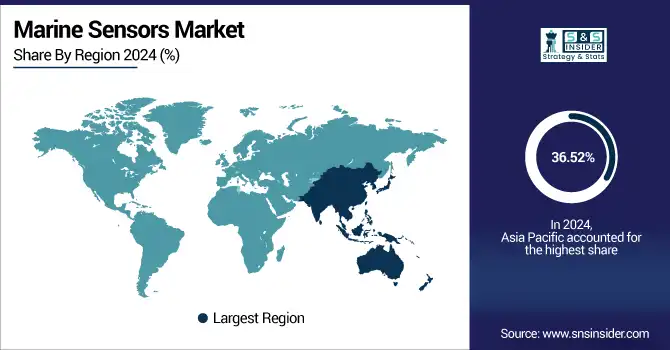
The Asia Pacific region dominated in 2024, capturing 36.52% of the global marine sensors market revenue. This dominance stems from strong shipbuilding industries, growing maritime trade, and increased defense spending by countries including China, Japan, and South Korea. The region's vast coastline, investments in offshore energy projects, and coastal surveillance initiatives continue to drive large-scale sensor deployments across commercial and military sectors.

  • China leads the Asia Pacific marine sensors market, driven by aggressive naval expansion, large-scale shipbuilding, and strategic investments in marine technology. Its focus on maritime surveillance, offshore energy exploration, and digital port infrastructure strengthens its position in both defense and commercial sectors.

North America is projected to witness the fastest CAGR of 8.22% over 2025-2032, supported by the presence of advanced maritime infrastructure, high R&D spending, and a strong focus on naval modernization. The region’s proactive adoption of autonomous maritime systems and emphasis on securing maritime borders are key growth drivers. Additionally, increasing investments in environmental monitoring and underwater exploration technologies further enhance its market growth potential.

  • The U.S. dominates the North American marine sensors market due to its strong naval capabilities, high defense budget, and advanced R&D ecosystem. Extensive deployment of marine sensors in surveillance, oceanographic research, and coastal security applications fuels continued market leadership.

Europe represents a mature and technologically advanced marine sensors market, supported by robust maritime traditions, environmental monitoring regulations, and growing investments in renewable marine energy. Countries including Germany, the U.K., and Norway are key contributors, focusing on sustainability and precision marine technologies. The region also benefits from collaborative defense programs and research initiatives that accelerate innovation in underwater sensing and navigation systems.

  • Germany leads due to its advanced marine engineering sector, strong presence of sensor manufacturers, and significant investments in maritime research and naval modernization. The country’s emphasis on environmental monitoring, offshore wind energy, and precision navigation technologies further strengthens its market leadership in the region.

The Middle East & Africa marine sensors market is led by the UAE, driven by its investments in smart ports, naval modernization, and coastal security. In Latin America, Brazil dominates due to its extensive offshore oil exploration, naval expansion, and growing demand for advanced marine monitoring and navigation technologies.
Key Players:

Major Key Players in Marine Sensors Market are Kongsberg Gruppen ASA, Raytheon Technologies Corporation, Thales Group, Teledyne Technologies Inc., Lockheed Martin Corporation, Northrop Grumman Corporation, Honeywell International Inc., General Dynamics Mission Systems, Fugro N.V., and SAAB AB and others.

Recent Developments:

  • In February 2025, Saab debuted its Coast Control Radar at IDEX in Abu Dhabi—a software-defined, phased-array system for coastal surveillance. This compact, modular radar ensures 360° detection of small vessels, enhancing maritime security.

  • March 2025, Thales delivered the world’s first autonomous surface drone mine-hunting system to the French and Royal Navies under the MMCM program, featuring towed sonar, AI-driven analysis, and a mobile command center.

Marine Sensors Market Report Scope:

Report Attributes Details
Market Size in 2024 USD 1.26 Billion 
Market Size by 2032 USD 2.11 Billion 
CAGR CAGR of 6.73% From 2025 to 2032
Base Year 2024
Forecast Period 2025-2032
Historical Data 2021-2023
Report Scope & Coverage Market Size, Segments Analysis, Competitive Landscape, Regional Analysis, DROC & SWOT Analysis, Forecast Outlook
Key Segments • By Platform (Military and Defense, Commercial)
• By Application (Intelligence & Reconnaissance, Communication & Navigation, Electronic Warfare, Target Recognition, Surveillance & Monitoring, Others)
• By Type (Acoustic Sensors, Magnetic Sensors, Sonars, Pressure Sensors, Temperature Sensors, Flow and Level Sensors, Others)
• By Connectivity (Wired, Wireless)
Regional Analysis/Coverage North America (US, Canada, Mexico), Europe (Germany, France, UK, Italy, Spain, Poland, Turkey, Rest of Europe), Asia Pacific (China, India, Japan, South Korea, Singapore, Australia,Taiwan, Rest of Asia Pacific), Middle East & Africa (UAE, Saudi Arabia, Qatar, South Africa, Rest of Middle East & Africa), Latin America (Brazil, Argentina, Rest of Latin America)
Company Profiles Kongsberg Gruppen ASA, Raytheon Technologies Corporation, Thales Group, Teledyne Technologies Inc., Lockheed Martin Corporation, Northrop Grumman Corporation, Honeywell International Inc., General Dynamics Mission Systems, Fugro N.V., SAAB AB

Frequently Asked Questions

Ans: The Marine Sensors Market is expected to grow at a CAGR of 6.73% from 2025-2032.

Ans: The Marine Sensors Market size was USD 1.26 billion in 2024 and is expected to reach USD 2.11 billion by 2032.

Ans: The major growth factor of the Marine Sensors Market is the increasing demand for advanced navigation, surveillance, and autonomous systems across defense and commercial marine operations.

Ans: Military and Defense segment dominated the Marine Sensors Market.

Ans: Asia Pacific dominated the Marine Sensors Market in 2024.

Table Of Content

1. Introduction

1.1 Market Definition

1.2 Scope (Inclusion and Exclusions)

1.3 Research Assumptions

2. Executive Summary

2.1 Market Overview

2.2 Regional Synopsis

2.3 Competitive Summary

3. Research Methodology

3.1 Top-Down Approach

3.2 Bottom-up Approach

3.3. Data Validation

3.4 Primary Interviews

4. Market Dynamics Impact Analysis

4.1 Market Driving Factors Analysis

4.1.1 Drivers

4.1.2 Restraints

4.1.3 Opportunities

4.1.4 Challenges

4.2 PESTLE Analysis

4.3 Porter’s Five Forces Model

5. Statistical Insights and Trends Reporting

5.1 Sensor Calibration Interval Stats

5.2 Sensor Downtime Impact Stats

       5.3 AI-Based Data Filtering Ratio

6. Competitive Landscape

6.1 List of Major Companies By Region

6.2 Market Share Analysis By Region

6.3 Product Benchmarking

6.3.1 Product specifications and features

6.3.2 Pricing

6.4 Strategic Initiatives

6.4.1 Marketing and promotional activities

6.4.2 Distribution and Supply Chain Strategies

6.4.3 Expansion plans and new product launches

6.4.4 Strategic partnerships and collaborations

6.5 Technological Advancements

6.6 Market Positioning and Branding

7. Marine Sensors Market Segmentation By Platform

7.1 Chapter Overview

7.2 Military and Defense

7.2.1 Military and Defense Market Trends Analysis (2021-2032)

7.2.2 Military and Defense Market Size Estimates and Forecasts to 2032 (USD Billion)

7.3 Commercial

7.3.1 Commercial Market Trends Analysis (2021-2032)

7.3.2 Commercial Market Size Estimates and Forecasts to 2032 (USD Billion)

8. Marine Sensors Market Segmentation By Application

8.1 Chapter Overview

8.2 Intelligence & Reconnaissance

8.2.1 Intelligence & Reconnaissance Market Trends Analysis (2021-2032)

8.2.2 Intelligence & Reconnaissance Market Size Estimates and Forecasts to 2032 (USD Billion)

8.3 Communication & Navigation

         8.3.1 Communication & Navigation Market Trends Analysis (2021-2032)

8.3.2 Communication & Navigation Market Size Estimates and Forecasts to 2032 (USD Billion)

8.4 Electronic Warfare

         8.4.1 Electronic Warfare Market Trends Analysis (2021-2032)

8.4.2 Electronic Warfare Market Size Estimates and Forecasts to 2032 (USD Billion)

8.5 Target Recognition

         8.5.1 Target Recognition Market Trends Analysis (2021-2032)

8.5.2 Target Recognition Market Size Estimates and Forecasts to 2032 (USD Billion)

8.6 Surveillance & Monitoring

         8.6.1 Surveillance & Monitoring Market Trends Analysis (2021-2032)

8.6.2 Surveillance & Monitoring Market Size Estimates and Forecasts to 2032 (USD Billion)

8.7 Others

         8.7.1 Others Market Trends Analysis (2021-2032)

8.7.2 Others Market Size Estimates and Forecasts to 2032 (USD Billion)

9. Marine Sensors Market Segmentation By Type

9.1 Chapter Overview

9.2 Acoustic Sensors

9.2.1 Acoustic Sensors Market Trends Analysis (2021-2032)

9.2.2 Acoustic Sensors Market Size Estimates and Forecasts to 2032 (USD Billion)

9.3 Magnetic Sensors

9.3.1 Magnetic Sensors Market Trends Analysis (2021-2032)

9.3.2 Magnetic Sensors Market Size Estimates and Forecasts to 2032 (USD Billion)

9.4 Sonars

9.4.1 Sonars Market Trends Analysis (2021-2032)

9.4.2 Sonars Market Size Estimates and Forecasts to 2032 (USD Billion)

9.5 Pressure Sensors

9.5.1 Pressure Sensors Market Trends Analysis (2021-2032)

9.5.2 Pressure Sensors Market Size Estimates and Forecasts to 2032 (USD Billion)

9.6 Temperature Sensors

9.6.1 Temperature Sensors Market Trends Analysis (2021-2032)

9.6.2 Temperature Sensors Market Size Estimates and Forecasts to 2032 (USD Billion)

9.7 Flow and Level Sensors

9.7.1 Flow and Level Sensors Market Trends Analysis (2021-2032)

9.7.2 Flow and Level Sensors Market Size Estimates and Forecasts to 2032 (USD Billion)

9.8 Others

9.8.1 Others Market Trends Analysis (2021-2032)

9.8.2 Others Market Size Estimates and Forecasts to 2032 (USD Billion)

10. Marine Sensors Market Segmentation By Connectivity

10.1 Chapter Overview

10.2 Wired

10.2.1 Wired Market Trends Analysis (2021-2032)

10.2.2 Wired Market Size Estimates and Forecasts to 2032 (USD Billion)

10.3 Wireless

10.3.1 Wireless Market Trend Analysis (2021-2032)

10.3.2 Wireless Market Size Estimates and Forecasts to 2032 (USD Billion)

11. Regional Analysis

11.1 Chapter Overview

11.2 North America

11.2.1 Trend Analysis

11.2.2 North America Marine Sensors Market Estimates and Forecasts by Country (2021-2032) (USD Billion)

11.2.3 North America Marine Sensors Market Estimates and Forecasts By Platform (2021-2032) (USD Billion) 

11.2.4 North America Marine Sensors Market Estimates and Forecasts By Application (2021-2032) (USD Billion)

11.2.5 North America Marine Sensors Market Estimates and Forecasts By Type (2021-2032) (USD Billion)

11.2.6 North America Marine Sensors Market Estimates and Forecasts By Connectivity (2021-2032) (USD Billion)

11.2.7 USA

11.2.7.1 USA Marine Sensors Market Estimates and Forecasts By Platform (2021-2032) (USD Billion)

11.2.7.2 USA Marine Sensors Market Estimates and Forecasts By Application (2021-2032) (USD Billion)

11.2.7.3 USA Marine Sensors Market Estimates and Forecasts By Type (2021-2032) (USD Billion)

11.2.7.4 USA Marine Sensors Market Estimates and Forecasts By Connectivity (2021-2032) (USD Billion)

11.2.8 Canada

11.2.8.1 Canada Marine Sensors Market Estimates and Forecasts By Platform (2021-2032) (USD Billion)

11.2.8.2 Canada Marine Sensors Market Estimates and Forecasts By Application (2021-2032) (USD Billion)

11.2.8.3 Canada Marine Sensors Market Estimates and Forecasts By Type (2021-2032) (USD Billion)

11.2.8.4 Canada Marine Sensors Market Estimates and Forecasts By Connectivity (2021-2032) (USD Billion)

11.2.9 Mexico

11.2.9.1 Mexico Marine Sensors Market Estimates and Forecasts By Platform (2021-2032) (USD Billion)

11.2.9.2 Mexico Marine Sensors Market Estimates and Forecasts By Application (2021-2032) (USD Billion)

11.2.9.3 Mexico Marine Sensors Market Estimates and Forecasts By Type (2021-2032) (USD Billion)

11.2.9.4 Mexico Marine Sensors Market Estimates and Forecasts By Connectivity (2021-2032) (USD Billion)

11.3 Europe

11.3.1 Trend Analysis

11.3.2 Europe Marine Sensors Market Estimates and Forecasts by Country (2021-2032) (USD Billion)

11.3.3 Europe Marine Sensors Market Estimates and Forecasts By Platform (2021-2032) (USD Billion) 

11.3.4 Europe Marine Sensors Market Estimates and Forecasts By Application (2021-2032) (USD Billion)

11.3.5 Europe Marine Sensors Market Estimates and Forecasts By Type (2021-2032) (USD Billion)

11.3.6 Europe Marine Sensors Market Estimates and Forecasts By Connectivity (2021-2032) (USD Billion)

11.3.7 Germany

11.3.7.1 Germany Marine Sensors Market Estimates and Forecasts By Platform (2021-2032) (USD Billion)

11.3.7.2 Germany Marine Sensors Market Estimates and Forecasts By Application (2021-2032) (USD Billion)

11.3.7.3 Germany Marine Sensors Market Estimates and Forecasts By Type (2021-2032) (USD Billion)

11.3.7.4 Germany Marine Sensors Market Estimates and Forecasts By Connectivity (2021-2032) (USD Billion)

11.3.8 France

11.3.8.1 France Marine Sensors Market Estimates and Forecasts By Platform (2021-2032) (USD Billion)

11.3.8.2 France Marine Sensors Market Estimates and Forecasts By Application (2021-2032) (USD Billion)

11.3.8.3 France Marine Sensors Market Estimates and Forecasts By Type (2021-2032) (USD Billion)

11.3.8.4 France Marine Sensors Market Estimates and Forecasts By Connectivity (2021-2032) (USD Billion)

11.3.9 UK

11.3.9.1 UK Marine Sensors Market Estimates and Forecasts By Platform (2021-2032) (USD Billion)

11.3.9.2 UK Marine Sensors Market Estimates and Forecasts By Application (2021-2032) (USD Billion)

11.3.9.3 UK Marine Sensors Market Estimates and Forecasts By Type (2021-2032) (USD Billion)

11.3.9.4 UK Marine Sensors Market Estimates and Forecasts By Connectivity  (2021-2032) (USD Billion)

11.3.10 Italy

11.3.10.1 ItalyMarine Sensors Market Estimates and Forecasts By Platform (2021-2032) (USD Billion)

11.3.10.2 Italy Marine Sensors Market Estimates and Forecasts By Application (2021-2032) (USD Billion)

11.3.10.3 Italy Marine Sensors Market Estimates and Forecasts By Type (2021-2032) (USD Billion)

11.3.10.4 Italy Marine Sensors Market Estimates and Forecasts By Connectivity (2021-2032) (USD Billion)

11.3.11 Spain

11.3.11.1 Spain Marine Sensors Market Estimates and Forecasts By Platform (2021-2032) (USD Billion)

11.3.11.2 Spain Marine Sensors Market Estimates and Forecasts By Application (2021-2032) (USD Billion)

11.3.11.3 Spain Marine Sensors Market Estimates and Forecasts By Type (2021-2032) (USD Billion)

11.3.11.4 Spain Marine Sensors Market Estimates and Forecasts By Connectivity (2021-2032) (USD Billion)

11.3.12 Poland

11.3.12.1 Poland Marine Sensors Market Estimates and Forecasts By Platform (2021-2032) (USD Billion)

11.3.12.2 Poland Marine Sensors Market Estimates and Forecasts By Application (2021-2032) (USD Billion)

11.3.12.3 Poland Marine Sensors Market Estimates and Forecasts By Type (2021-2032) (USD Billion)

11.3.12.4 Poland Marine Sensors Market Estimates and Forecasts By Connectivity (2021-2032) (USD Billion)

11.3.13 Turkey

11.3.13.1 Turkey Marine Sensors Market Estimates and Forecasts By Platform (2021-2032) (USD Billion)

11.3.13.2 Turkey Marine Sensors Market Estimates and Forecasts By Application (2021-2032) (USD Billion)

11.3.13.3 Turkey Marine Sensors Market Estimates and Forecasts By Type (2021-2032) (USD Billion)

11.3.13.4 Turkey Marine Sensors Market Estimates and Forecasts By Connectivity (2021-2032) (USD Billion)

11.3.14 Rest of Europe

11.3.14.1 Rest of Europe Marine Sensors Market Estimates and Forecasts By Platform (2021-2032) (USD Billion)

11.3.14.2 Rest of Europe Marine Sensors Market Estimates and Forecasts By Application (2021-2032) (USD Billion)

11.3.14.3 Rest of Europe Marine Sensors Market Estimates and Forecasts By Type (2021-2032) (USD Billion)

11.3.14.4 Rest of Europe Marine Sensors Market Estimates and Forecasts By Connectivity (2021-2032) (USD Billion)

11.4 Asia Pacific

11.4.1 Trend Analysis

11.4.2 Asia Pacific Marine Sensors Market Estimates and Forecasts by Country (2021-2032) (USD Billion)

11.4.3 Asia Pacific Marine Sensors Market Estimates and Forecasts By Platform (2021-2032) (USD Billion) 

11.4.4 Asia Pacific Marine Sensors Market Estimates and Forecasts By Application (2021-2032) (USD Billion)

11.4.5 Asia Pacific Marine Sensors Market Estimates and Forecasts By Type (2021-2032) (USD Billion)

11.4.6 Asia Pacific Marine Sensors Market Estimates and Forecasts By Connectivity (2021-2032) (USD Billion)

11.4.7 China

11.4.7.1 China Marine Sensors Market Estimates and Forecasts By Platform (2021-2032) (USD Billion)

11.4.7.2 China Marine Sensors Market Estimates and Forecasts By Application (2021-2032) (USD Billion)

11.4.7.3 China Marine Sensors Market Estimates and Forecasts By Type (2021-2032) (USD Billion)

11.4.7.4 China Marine Sensors Market Estimates and Forecasts By Connectivity (2021-2032) (USD Billion)

11.4.8 India

11.4.8.1 India Marine Sensors Market Estimates and Forecasts By Platform (2021-2032) (USD Billion)

11.4.8.2 India Marine Sensors Market Estimates and Forecasts By Application (2021-2032) (USD Billion)

11.4.8.3 India Marine Sensors Market Estimates and Forecasts By Type (2021-2032) (USD Billion)

11.4.8.4 India Marine Sensors Market Estimates and Forecasts By Connectivity (2021-2032) (USD Billion)

11.4.9 Japan

11.4.9.1 Japan Marine Sensors Market Estimates and Forecasts By Platform (2021-2032) (USD Billion)

11.4.9.2 Japan Marine Sensors Market Estimates and Forecasts By Application (2021-2032) (USD Billion)

11.4.9.3 Japan Marine Sensors Market Estimates and Forecasts By Type (2021-2032) (USD Billion)

11.4.9.4 Japan Marine Sensors Market Estimates and Forecasts By Connectivity (2021-2032) (USD Billion)

11.4.10 South Korea

11.4.10.1 South Korea Marine Sensors Market Estimates and Forecasts By Platform (2021-2032) (USD Billion)

11.4.10.2 South Korea Marine Sensors Market Estimates and Forecasts By Application (2021-2032) (USD Billion)

11.4.10.3 South Korea Marine Sensors Market Estimates and Forecasts By Type (2021-2032) (USD Billion)

11.4.10.4 South Korea Marine Sensors Market Estimates and Forecasts By Connectivity (2021-2032) (USD Billion)

11.4.11 Singapore

11.4.11.1 Singapore Marine Sensors Market Estimates and Forecasts By Platform (2021-2032) (USD Billion)

11.4.11.2 Singapore Marine Sensors Market Estimates and Forecasts By Application (2021-2032) (USD Billion)

11.4.11.3 Singapore Marine Sensors Market Estimates and Forecasts By Type (2021-2032) (USD Billion)

11.4.11.4 Singapore Marine Sensors Market Estimates and Forecasts By Connectivity (2021-2032) (USD Billion)

11.4.12 Australia

11.4.12.1 Australia Marine Sensors Market Estimates and Forecasts By Platform (2021-2032) (USD Billion)

11.4.12.2 Australia Marine Sensors Market Estimates and Forecasts By Application (2021-2032) (USD Billion)

11.4.12.3 Australia Marine Sensors Market Estimates and Forecasts By Type (2021-2032) (USD Billion)

11.4.12.4 Australia Marine Sensors Market Estimates and Forecasts By Connectivity (2021-2032) (USD Billion)

11.4.13 Taiwan

11.4.13.1 Taiwan Marine Sensors Market Estimates and Forecasts By Platform (2021-2032) (USD Billion)

11.4.13.2 Taiwan Marine Sensors Market Estimates and Forecasts By Application (2021-2032) (USD Billion)

11.4.13.3 Taiwan Marine Sensors Market Estimates and Forecasts By Type (2021-2032) (USD Billion)

11.4.13.4 Taiwan Marine Sensors Market Estimates and Forecasts By Connectivity (2021-2032) (USD Billion)

11.4.14 Rest of Asia Pacific

11.4.14.1 Rest of Asia Pacific Marine Sensors Market Estimates and Forecasts By Platform (2021-2032) (USD Billion)

11.4.14.2 Rest of Asia Pacific Marine Sensors Market Estimates and Forecasts By Application (2021-2032) (USD Billion)

11.4.14.3 Rest of Asia Pacific Marine Sensors Market Estimates and Forecasts By Type (2021-2032) (USD Billion)

11.4.14.4 Rest of Asia Pacific Marine Sensors Market Estimates and Forecasts By Connectivity (2021-2032) (USD Billion)

11.5 Middle East and Africa

11.5.1 Trend Analysis

11.5.2 Middle East and Africa Marine Sensors Market Estimates and Forecasts by Country (2021-2032) (USD Billion)

11.5.3 Middle East and Africa Marine Sensors Market Estimates and Forecasts By Platform (2021-2032) (USD Billion) 

11.5.4 Middle East and Africa Marine Sensors Market Estimates and Forecasts By Application (2021-2032) (USD Billion)

11.5.5 Middle East and Africa Marine Sensors Market Estimates and Forecasts By Type (2021-2032) (USD Billion)

11.5.6 Middle East and Africa Marine Sensors Market Estimates and Forecasts By Connectivity (2021-2032) (USD Billion)

11.5.7 UAE

11.5.7.1 UAE Marine Sensors Market Estimates and Forecasts By Platform (2021-2032) (USD Billion)

11.5.7.2 UAE Marine Sensors Market Estimates and Forecasts By Application (2021-2032) (USD Billion)

11.5.7.3 UAE Marine Sensors Market Estimates and Forecasts By Type (2021-2032) (USD Billion)

11.5.7.4 UAE Marine Sensors Market Estimates and Forecasts By Connectivity (2021-2032) (USD Billion)

11.5.8 Saudi Arabia

11.5.8.1 Saudi Arabia Marine Sensors Market Estimates and Forecasts By Platform (2021-2032) (USD Billion)

11.5.8.2 Saudi Arabia Marine Sensors Market Estimates and Forecasts By Application (2021-2032) (USD Billion)

11.5.8.3 Saudi Arabia Marine Sensors Market Estimates and Forecasts By Type (2021-2032) (USD Billion)

11.5.8.4 Saudi Arabia Marine Sensors Market Estimates and Forecasts By Connectivity (2021-2032) (USD Billion)

11.5.9 Qatar

                     11.5.9.1 Qatar Marine Sensors Market Estimates and Forecasts By Platform (2021-2032) (USD Billion)

11.5.9.2 Qatar Marine Sensors Market Estimates and Forecasts By Application (2021-2032) (USD Billion)

11.5.9.3 Qatar Marine Sensors Market Estimates and Forecasts By Type (2021-2032) (USD Billion)

11.5.1.9.4 Qatar Marine Sensors Market Estimates and Forecasts By Connectivity (2021-2032) (USD Billion)

11.5.10   South Africa

11.5.10.1 South Africa Marine Sensors Market Estimates and Forecasts By Platform (2021-2032) (USD Billion)

11.5.10.2 South Africa Marine Sensors Market Estimates and Forecasts By Application (2021-2032) (USD Billion)

11.5.10.3 South Africa Marine Sensors Market Estimates and Forecasts By Type (2021-2032) (USD Billion)

11.5.10.4 South Africa Marine Sensors Market Estimates and Forecasts By Connectivity (2021-2032) (USD Billion)

11.5.11 Rest of Middle East & Africa

11.5.11.1 Rest of Middle East & Africa Marine Sensors Market Estimates and Forecasts By Platform (2021-2032) (USD Billion)

11.5.11.2 Rest of Middle East & Africa Marine Sensors Market Estimates and Forecasts By Application (2021-2032) (USD Billion)

11.5.11.3 Rest of Middle East & Africa Marine Sensors Market Estimates and Forecasts By Type (2021-2032) (USD Billion)

11.5.11.4 Rest of Middle East & Africa Marine Sensors Market Estimates and Forecasts By Connectivity (2021-2032) (USD Billion)

11.6 Latin America

11.6.1 Trend Analysis

11.6.2 Latin America Marine Sensors Market Estimates and Forecasts by Country (2021-2032) (USD Billion)

11.6.3 Latin America Marine Sensors Market Estimates and Forecasts By Platform (2021-2032) (USD Billion) 

11.6.4 Latin America Marine Sensors Market Estimates and Forecasts By Application (2021-2032) (USD Billion)

11.6.5 Latin America Marine Sensors Market Estimates and Forecasts By Type (2021-2032) (USD Billion)

11.6.6 Latin America Marine Sensors Market Estimates and Forecasts By Connectivity (2021-2032) (USD Billion)

11.6.7 Brazil

11.6.7.1 Brazil Marine Sensors Market Estimates and Forecasts By Platform (2021-2032) (USD Billion)

11.6.7.2 Brazil Marine Sensors Market Estimates and Forecasts By Application (2021-2032) (USD Billion)

11.6.7.3 Brazil Marine Sensors Market Estimates and Forecasts By Type (2021-2032) (USD Billion)

11.6.7.4 Brazil Marine Sensors Market Estimates and Forecasts By Connectivity (2021-2032) (USD Billion)

11.6.8 Argentina

11.6.8.1 Argentina Marine Sensors Market Estimates and Forecasts By Platform (2021-2032) (USD Billion)

11.6.8.2 Argentina Marine Sensors Market Estimates and Forecasts By Application (2021-2032) (USD Billion)

11.6.8.3 Argentina Marine Sensors Market Estimates and Forecasts By Type (2021-2032) (USD Billion)

11.6.8.4 Argentina Marine Sensors Market Estimates and Forecasts By Connectivity (2021-2032) (USD Billion)

11.6.9 Rest of Latin America

11.6.9.1 Rest of Latin America Marine Sensors Market Estimates and Forecasts By Platform (2021-2032) (USD Billion)

11.6.9.2 Rest of Latin America Marine Sensors Market Estimates and Forecasts By Application (2021-2032) (USD Billion)

11.6.9.3 Rest of Latin America Marine Sensors Market Estimates and Forecasts By Type (2021-2032) (USD Billion)

11.6.9.4 Rest of Latin America Marine Sensors Market Estimates and Forecasts By Connectivity (2021-2032) (USD Billion)

12. Company Profiles

12.1 Kongsberg Gruppen ASA

          12.1.1 Company Overview

12.1.2 Financial

12.1.3 Products/ Services Offered

12.1.4 SWOT Analysis

12.2 Raytheon Technologies Corporation

           12.2.1 Company Overview

12.2.2 Financial

12.2.3 Products/ Services Offered

12.2.4 SWOT Analysis

12.3 Thales Group           

          12.3.1 Company Overview

12.3.2 Financial

12.3.3 Products/ Services Offered

12.3.4 SWOT Analysis

12.4 Teledyne Technologies Inc.

          12.4.1 Company Overview

12.4.2 Financial

12.4.3 Products/ Services Offered

12.4.4 SWOT Analysis

12.5 Lockheed Martin Corporation

          12.5.1 Company Overview

12.5.2 Financial

12.5.3 Products/ Services Offered

12.5.4 SWOT Analysis

12.6 Northrop Grumman Corporation

          12.6.1 Company Overview

12.6.2 Financial

12.6.3 Products/ Services Offered

12.6.4 SWOT Analysis

12.7 Honeywell International Inc.

          12.7.1 Company Overview

12.7.2 Financial

12.7.3 Products/ Services Offered

12.7.4 SWOT Analysis

12.8 General Dynamics Mission Systems

12.8.1 Company Overview

12.8.2 Financial

12.8.3 Products/ Services Offered

12.8.4 SWOT Analysis

12.9 Fugro N.V.

12.9.1 Company Overview

12.9.2 Financial

12.9.3 Products/ Services Offered

12.9.4 SWOT Analysis

12.10 SAAB AB

12.10.1 Company Overview

12.10.2 Financial

12.10.3 Products/ Services Offered

12.10.4 SWOT Analysis

13. Use Cases and Best Practices

14. Conclusion

An accurate research report requires proper strategizing as well as implementation. There are multiple factors involved in the completion of good and accurate research report and selecting the best methodology to compete the research is the toughest part. Since the research reports we provide play a crucial role in any company’s decision-making process, therefore we at SNS Insider always believe that we should choose the best method which gives us results closer to reality. This allows us to reach at a stage wherein we can provide our clients best and accurate investment to output ratio.

Each report that we prepare takes a timeframe of 350-400 business hours for production. Starting from the selection of titles through a couple of in-depth brain storming session to the final QC process before uploading our titles on our website we dedicate around 350 working hours. The titles are selected based on their current market cap and the foreseen CAGR and growth.


The 5 steps process:

Step 1: Secondary Research:

Secondary Research or Desk Research is as the name suggests is a research process wherein, we collect data through the readily available information. In this process we use various paid and unpaid databases which our team has access to and gather data through the same. This includes examining of listed companies’ annual reports, Journals, SEC filling etc. Apart from this our team has access to various associations across the globe across different industries. Lastly, we have exchange relationships with various university as well as individual libraries.

Secondary Research

Step 2: Primary Research

When we talk about primary research, it is a type of study in which the researchers collect relevant data samples directly, rather than relying on previously collected data.  This type of research is focused on gaining content specific facts that can be sued to solve specific problems. Since the collected data is fresh and first hand therefore it makes the study more accurate and genuine.

We at SNS Insider have divided Primary Research into 2 parts.

Part 1 wherein we interview the KOLs of major players as well as the upcoming ones across various geographic regions. This allows us to have their view over the market scenario and acts as an important tool to come closer to the accurate market numbers. As many as 45 paid and unpaid primary interviews are taken from both the demand and supply side of the industry to make sure we land at an accurate judgement and analysis of the market.

This step involves the triangulation of data wherein our team analyses the interview transcripts, online survey responses and observation of on filed participants. The below mentioned chart should give a better understanding of the part 1 of the primary interview.

Primary Research

Part 2: In this part of primary research the data collected via secondary research and the part 1 of the primary research is validated with the interviews from individual consultants and subject matter experts.

Consultants are those set of people who have at least 12 years of experience and expertise within the industry whereas Subject Matter Experts are those with at least 15 years of experience behind their back within the same space. The data with the help of two main processes i.e., FGDs (Focused Group Discussions) and IDs (Individual Discussions). This gives us a 3rd party nonbiased primary view of the market scenario making it a more dependable one while collation of the data pointers.

Step 3: Data Bank Validation

Once all the information is collected via primary and secondary sources, we run that information for data validation. At our intelligence centre our research heads track a lot of information related to the market which includes the quarterly reports, the daily stock prices, and other relevant information. Our data bank server gets updated every fortnight and that is how the information which we collected using our primary and secondary information is revalidated in real time.

Data Bank Validation

Step 4: QA/QC Process

After all the data collection and validation our team does a final level of quality check and quality assurance to get rid of any unwanted or undesired mistakes. This might include but not limited to getting rid of the any typos, duplication of numbers or missing of any important information. The people involved in this process include technical content writers, research heads and graphics people. Once this process is completed the title gets uploader on our platform for our clients to read it.

Step 5: Final QC/QA Process:

This is the last process and comes when the client has ordered the study. In this process a final QA/QC is done before the study is emailed to the client. Since we believe in giving our clients a good experience of our research studies, therefore, to make sure that we do not lack at our end in any way humanly possible we do a final round of quality check and then dispatch the study to the client.

Key Segments: 

By Platform

  • Military and Defense

  • Commercial

By Application

  • Intelligence & Reconnaissance

  • Communication & Navigation

  • Electronic Warfare

  • Target Recognition

  • Surveillance & Monitoring

  • Others

By Type

  • Acoustic Sensors

  • Magnetic Sensors

  • Sonars

  • Pressure Sensors

  • Temperature Sensors

  • Flow and Level Sensors

  • Others

By Connectivity

  • Wired

  • Wireless

Request for Segment Customization as per your Business Requirement: Segment Customization Request

Regional Coverage: 

North America

  • US

  • Canada

  • Mexico

Europe

  • Germany

  • France

  • UK

  • Italy

  • Spain

  • Poland

  • Turkey

  • Rest of Europe

Asia Pacific

  • China

  • India

  • Japan

  • South Korea

  • Singapore

  • Australia

  • Taiwan

  • Rest of Asia Pacific

Middle East & Africa

  • UAE

  • Saudi Arabia

  • Qatar

  • South Africa

  • Rest of Middle East & Africa

Latin America

  • Brazil

  • Argentina

  • Rest of Latin America

Request for Country Level Research Report: Country Level Customization Request

Available Customization 

With the given market data, SNS Insider offers customization as per the company’s specific needs. The following customization options are available for the report: 

  • Detailed Volume Analysis 

  • Criss-Cross segment analysis (e.g. Product X Application) 

  • Competitive Product Benchmarking 

  • Geographic Analysis 

  • Additional countries in any of the regions 

  • Customized Data Representation 

  • Detailed analysis and profiling of additional market players

Explore Key Insights.


  • Analyzes market trends, forecasts, and regional dynamics
  • Covers core offerings, innovations, and industry use cases
  • Profiles major players, value chains, and strategic developments
  • Highlights innovation trends, regulatory impacts, and growth opportunities
Request an Analyst Call