Power Transistor Market Size & Trends Analysis:
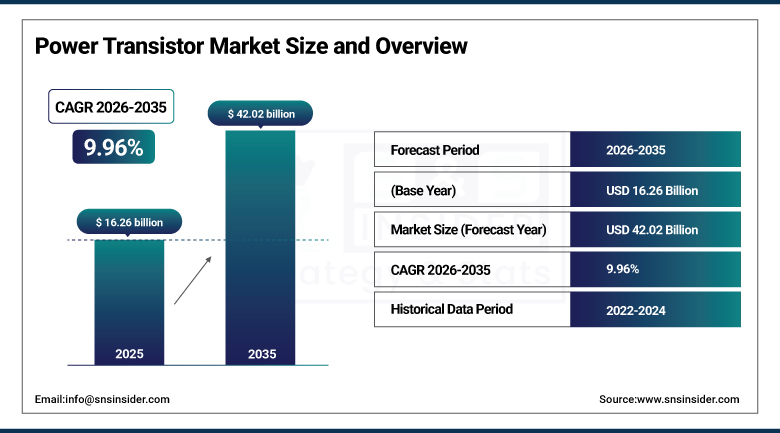
The Power Transistor Market size was valued at USD 16.26 Billion in 2025 and is expected to reach USD 42.02 Billion by 2035, growing at a CAGR of 9.96% over the forecast period of 2026-2035.
The Power Transistor Market trends include growing adoption in electric vehicles and emerging high-voltage and RF technologies, increased demand for compact and energy-efficient devices, and greater integration in renewable energy systems and industrial automation applications.
The Power Transistor Market growth is primarily driven by the increasing demand for energy-efficient power management solutions across critical sectors, especially electric vehicles, renewable energy systems, industrial automation, and consumer electronics propelled by global trend of sustainability, electrification, and proliferation of smart devices. These transistors are critical to high current capability, thermal performance, and compact packaging, and innovations in SiC and GaN technologies can improve efficiency and performance in high-voltage and high-frequency applications.
-
Modern solar inverters equipped with GaN and SiC transistors can achieve up to 98.5% efficiency, significantly reducing energy loss in residential and commercial solar installations.
Power Transistor Market Size and Growth Forecast:
-
Market Size in 2025 USD 16.26 Billion
-
Market Size by 2035 USD 42.02 Billion
-
CAGR of 9.96% from 2026 to 2035
-
Base Year 2025
-
Forecast Period 2026-2035
-
Historical Data 2022-2024
To Get more information on Power Transistor Market - Request Free Sample Report
Key Power Transistor Market Trends Highlights:
-
Porsche Engineering is developing AI-based soft switching for EV inverters that can reduce switching losses in power transistors by 70–95 percent, improving EV range, reducing heat, and shrinking inverter size by up to 50 percent
-
Diodes Incorporated launched ultra-low VCE(sat) bipolar transistors designed for automotive power electronics that deliver higher conduction efficiency, better thermal performance, and reduced PCB footprint, supporting compact and high-efficiency EV and control systems
-
NXP Semiconductors announced a strategic exit from the 5G RF power transistor and amplifier market, planning to close its Chandler, Arizona GaN fab by early 2027 due to slowing global 5G investment, narrowing supplier options for telecom power components
-
The NXP exit is driven by slower-than-expected 5G rollout and ROI pressures, which may impact availability and pricing dynamics for GaN and RF power transistor solutions in telecom networks
-
Power transistors, especially IGBTs and bipolar devices, remain critical in automotive power control, motor drives, converters, and other industrial systems, with increasing demand from electrification and efficiency-driven design
-
Industry trends toward wide-bandgap materials like SiC and GaN, along with AI-assisted control, suggest the market will evolve toward higher efficiency, compact integration, and system-level optimization across EVs, renewable energy, and industrial automation
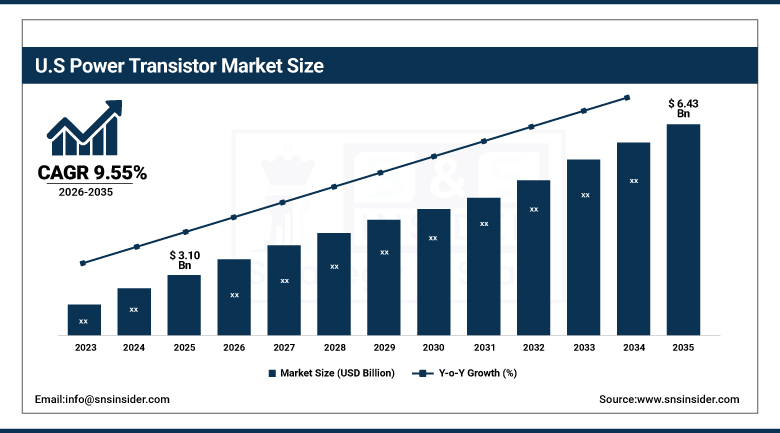
U.S. Power Transistor Market Size Outlook
The U.S. Power Transistor Market size was valued at USD 3.10 billion in 2025 and is projected to grow at a CAGR of 9.55%, reaching USD 6.43 billion by 2035. Rising EV adoption drives demand for high-performance IGBTs and MOSFETs in automotive powertrains, while accelerating renewable energy deployment boosts the need for efficient power electronics in inverters and grid systems, in turn contributing to the growth of the U.S. Power Transistor Market.
Power Transistor Market Drivers:
-
Rising Demand for Energy Efficient Power Transistors Driven by EV Adoption and Sustainability Goals
The rising requirement for energy-efficient electronic components in various applications, such as automotive, industrial automation, renewable energy, and consumer electronics is gaining traction, which is one of the global power transistor market contributing factors. Growth in electric vehicles is especially important since EVs demand high-performance power transistors to manage battery systems, inverters, and onboard charging. Further, the high energy regulation and carbon neutrality goals are pushing the industries to go with efficient power management solutions, which is further supporting the market demand for advanced transistors including IGBT, SiC and GaN.
Hyundai/Kia’s adoption of STMicroelectronics SiC inverters upgraded charging from 400 V to 800 V, enabling up to threefold faster charging.
Power Transistor Market Restraints:
-
Manufacturing Complexity and Material Limitations Restrain Adoption of SiC and GaN Power Transistor Technologies
The complex manufacturing process as well as technical limitations associated with wide-bandgap materials, such as silicon carbide (SiC) and gallium nitride (GaN) represents a major restraint in the global power transistor market. Although these materials have much better performance, they require additional developed and more precise fabrication technologies, quality controls, and non-standard substrates, which makes production more complex. Further, the limited availability of high-purity feedstock and less established supply chains are major hurdles to mass adoption.
Power Transistor Market Opportunities:
-
Growing Use of SiC and GaN Unlocks Opportunities in High Voltage Power Transistor Applications
One such opportunity is in the increasing use of wide-bandgap semiconductor technologies primarily silicon carbide (SiC) and gallium nitride (GaN). They deliver higher efficiency, faster switching speeds, and lower thermal resistance than classic silicon materials. As Industries make the shift toward high-voltage and high-frequency applications such as EV fast chargers, smart grids, and compact power supplies manufacturers able to innovate will take advantage of next-generation power transistor development.
Wolfspeed’s SiC modules used in Rivian R1T inverters added approximately 40 extra miles of driving range, owing to 50% lower losses.
Power Transistor Market Segment Analysis:
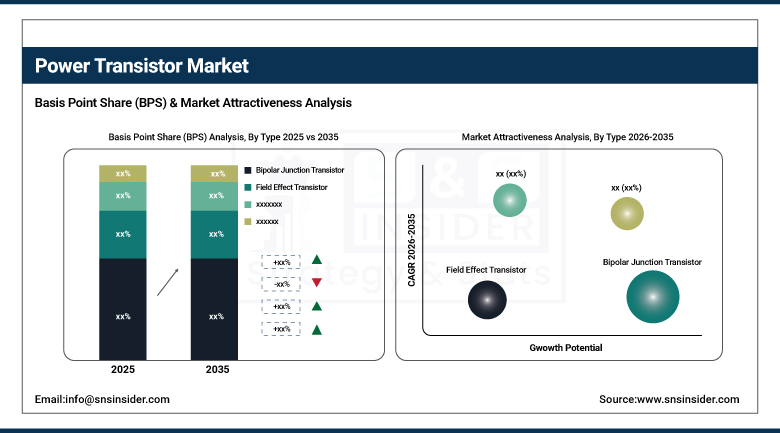
By Type
Bipolar Junction Transistors (BJTs) had the greatest share of the global power transistor market in 2025, with 41.4% of the overall market share. For the range of products including industrial controls, amplifiers, and power regulation systems, their primary advantage is the current-carrying capability, robustness, and cost of the design. BJTs work perfectly in steady current amplification and switching at medium frequency environmental conditions. Their incumbent presence and proven track record on legacy systems have made them a salient option in some of the high-power applications and industries.
Field Effect Transistors (FETs) will have the highest growth rate in the market over 2026-2035. The growth is being propelled with the growing need for compact, high-speed and energy-efficient electronic components in contemporary use cases including electric vehicles, consumer electronics, and IoT devices. FETs, especially the MOSFETs and their GaN-based variants, possess benefits, such as rapid switching time, increased performance, and a variety of sizes for scalable power management and signal processing requirements for future generations.
By Technology
In 2025, Low-voltage FETs remained the largest power transistor category with 35.5% of the total share. This dominance can be attributed to their widespread use in portable consumer electronics/ computing devices and battery powered applications, where fast switching and low power consumption is critical to the technology. Low-voltage FETs excel in achieving low gate drive power, fast switching time and footprint, which are the keys to high efficiency in compact mobile and computing electronic circuit designs, such as smartphones, tablets, and other small digital devices.
Due to an increase in demand for low-cost electronics products, the fastest compound annual growth rate (CAGR) over 2026-2035 is likely to be for Insulated Gate Bipolar Transistors (IGBTs). This growth is primarily driven by the increasing adoption of GaN devices in high-power applications electric vehicles, industrial motor drives, rail traction systems, and renewable energy infrastructure. By merging the high efficiencies and fast switching of MOSFETs with the high-voltage capability of BJTs, IGBTs work exceptionally well in harsh, high-voltage, and high-current environments.
By End-Use
The consumer electronics segment accounted for the largest share of 35.2% of the global power transistor market share in 2025. This leadership is largely fueled by the massive demand for smartphones, laptops, tablets, smart home gadgets, and wearables globally. In the power management solution of these devices, compact, energy-efficient, and high-speed are the essential components where power transistor (particularly low-voltage FET) plays an important role. They also help electronics regulate voltage and current with exceptional efficiency, enabling long battery life and high performance in small devices. The continuous development of high-efficiency power supplies and portable gadgets keeps the consumer electronics segment on top.
The automotive segment will be the fastest growing segment during the forecast period over 2026-2035 in the power transistor market. This boom is driven by ongoing EV and hybrid systems, and ADAS growth. Power transistors, including IGBTs and SiC MOSFETs, play a critical role in the management of EV powertrains, onboard charging and battery systems, facilitating high-voltage performance, efficiency and temperature stability, which are all key to automotive innovation.
Power Transistor Market Regional Analysis:
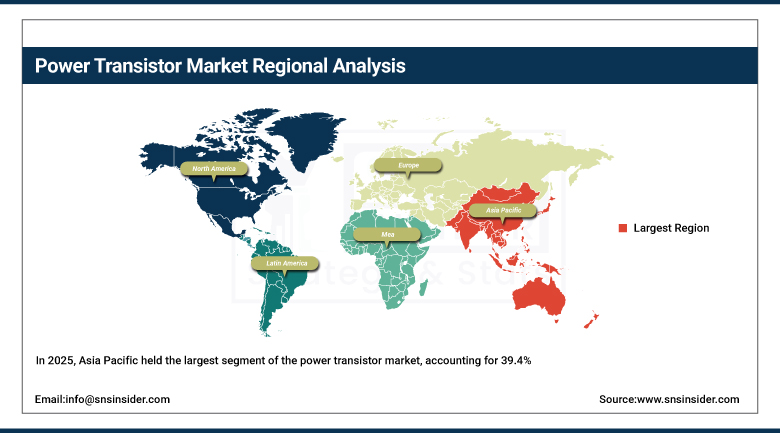
Asia-Pacific Power Transistor Market Trends:
In 2025, Asia Pacific held the largest segment of the power transistor market, accounting for 39.4%, and is expected to grow at the fastest CAGR of 10.33% during the forecast period 2026 to 2035. The solid growth is fueled by a strong manufacturing base, rapid industrialization, and increasing penetration of electric vehicles and consumer electronics in the region. The demand for advanced power transistors is being driven by the several semiconductor fabrication facilities along with large investments in renewable energy and smart grid infrastructure. The growth is also being propelled by rising adoption of automation in various industries and the growing penetration of 5G and IoT. Opportunities for power recovery manufacturers persist due to the region's focus on energy efficient next generation power technologies.
China was the leading Asia Pacific power transistor market due to its robust electronics manufacturing base, increasing EV adoption, a rapidly growing industrial sector, and state support for semiconductor autonomy and innovation.
Get Customized Report as per Your Business Requirement - Enquiry Now
North America Power Transistor Market Trends:
Power Transistor Market in North America is projected to grow at a steady rate over the forecast period due to the increasing strategic alliances in earmarking electric vehicles, renewable energy systems, and industrial automation. Leading semiconductor manufacturers and technology innovators making high efficiency power management solutions are present here in great numbers. Growing investments toward the clean energy infrastructure, along with the increasing demand for data centers and consumer electronics are propelling the demand for advanced transistors, such as SiC and GaN. Moreover, strict energy regulations and increased focus on green-tech are driving the adoption of energy efficient parts in various industries, further strengthening the regional market share on the global scales.
U.S. led the North America power transistor market due to the strong presence of semiconductor companies and a well-established R&D infrastructure and ecosystem, while high EV penetration rate of the region and heavy investments in clean energy technologies further augment the growth in the country.
Europe Power Transistor Market Trends:
The power transistor market in Europe is witnessing gradual growth owing to the significant initiatives taken in the electric mobility, renewable energy, and industrial automation industry. Sustainable energy transitions are increasingly becoming a priority in the region which in turn is leading to escalating demand for energy-efficient power devices. Electrification of automotive especially in the premium and commercial segments is an important growth driver and power transistors are key elements in the vast majority of automotive EV powertrains and charging systems. Furthermore, the growing demand for smart manufacturing along with advancements in automation across all industries are increasing the range of applications and demand for transistors.
Latin America and Middle East & Africa Power Transistor Market Trends:
Emerging markets in Latin America and the Middle East & Africa with growing investments in infrastructure, renewable energy and industrial development. The growing acceptance of electric vehicles and smart grid technologies is rising demand for effective power management solutions. Several government efforts to upgrade energy systems and increase connectivity support advanced transistors. These regions are still developing and have the potential for long-term growth as technology continues to grow and manufacturing capacities increase locally.
Power Transistor Market Competitive Landscape:
Infineon Technologies, established in 1999 and headquartered in Germany, is a global leader in semiconductor solutions focusing on automotive, industrial power control, and digital security applications. The company develops high-performance power transistors, microcontrollers, sensors, and ICs, enabling energy-efficient technologies, electric mobility, and secure connectivity across various industries worldwide.
-
In April 2025, Infineon Technologies, released the first industrial GaN transistor with integrated Schottky diode (100 V, PQFN), reducing dead‑time losses and simplifying designs.
Nexperia, established in 2017 and headquartered in the Netherlands, is a leading semiconductor company specializing in discrete, logic, and MOSFET components. It focuses on high-volume, energy-efficient, and reliable solutions for automotive, industrial, and consumer electronics, providing essential power transistors and ICs that enable modern electronics and smart device applications globally.
-
In May 2025, Nexperia launched automotive-qualified 1200 V SiC MOSFETs in D²PAK‑7, maintaining stable on-resistance up to 175 °C, which is ideal for EV traction.
Power Transistor Companies are:
-
STMicroelectronics
-
Toshiba Corporation
-
ON Semiconductor
-
Nexperia
-
ROHM Semiconductor
-
Mitsubishi Electric
-
Texas Instruments
-
Vishay Intertechnology
-
Analog Devices
-
Microchip Technology
-
Fuji Electric
-
IXYS Corporation
-
Semikron Danfoss
-
Littelfuse
-
Alpha and Omega Semiconductor
-
Broadcom
-
Diodes Incorporated
-
Panasonic Industry
| Report Attributes | Details |
|---|---|
| Market Size in 2025 | USD 16.26 Billion |
| Market Size by 2035 | USD 42.02 Billion |
| CAGR | CAGR of 9.96% From 2026 to 2035 |
| Base Year | 2025 |
| Forecast Period | 2026-2035 |
| Historical Data | 2022-2024 |
| Report Scope & Coverage | Market Size, Segments Analysis, Competitive Landscape, Regional Analysis, DROC & SWOT Analysis, Forecast Outlook |
| Key Segments | • By Type (Bipolar Junction Transistor, Field Effect Transistor, Heterojunction Bipolar Transistor, and Others) • By Technology (Low-voltage FETs, RF and Microwave Power, High-Voltage FETs, and IGBT Transistor) • By End Use (Consumer Electronics, Automotive, Industrial, IT & Telecommunications, and Others) |
| Regional Analysis/Coverage | North America (US, Canada), Europe (Germany, UK, France, Italy, Spain, Russia, Poland, Rest of Europe), Asia Pacific (China, India, Japan, South Korea, Australia, ASEAN Countries, Rest of Asia Pacific), Middle East & Africa (UAE, Saudi Arabia, Qatar, South Africa, Rest of Middle East & Africa), Latin America (Brazil, Argentina, Mexico, Colombia, Rest of Latin America). |
| Company Profiles | Infineon Technologies, STMicroelectronics, Toshiba Corporation, ON Semiconductor, Nexperia, Renesas Electronics, ROHM Semiconductor, Mitsubishi Electric, Texas Instruments, Vishay Intertechnology, Analog Devices, Microchip Technology, Fuji Electric, IXYS Corporation, Semikron Danfoss, Littelfuse, Alpha and Omega Semiconductor, Broadcom, Diodes Incorporated, Panasonic Industry |
Frequently Asked Questions
Ans: Asia Pacific dominated the Power Transistor Market in 2025.
Ans: The Bipolar Junction Transistor segment dominated the Power Transistor Market in 2025.
Ans: The major growth factor of the Power Transistor Market is the rising demand for energy-efficient electronics across automotive, industrial, and consumer applications.
Ans: The Power Transistor Market size was USD 16.26 Billion in 2025 and is expected to reach USD 42.02 Billion by 2035.
Ans: The Power Transistor Market is expected to grow at a CAGR of 9.96% from 2026-2035.
Get in Touch
