image

Mechanical Performance Tuning Components Market Key  Insights:

Mechanical Performance Tuning Components Market Revenue Analysis

Get More Information on Mechanical Performance Tuning Components Market - Request Sample Report

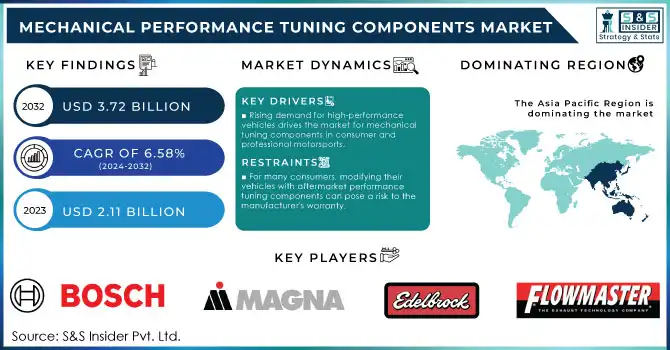
The Mechanical Performance Tuning Components Market size was valued at USD 2.11 Bn in 2023 and will reach $3.72 Bn by 2032 & grow at a CAGR of 6.58% over the forecast period of 2024-2032.
The mechanical performance tuning components market is experiencing significant growth due to advancements in technology, the rising demand for high-performance machinery, and the increasing need for cost-effective solutions that extend the lifespan of equipment. In the automotive industry, the adoption of mechanical performance tuning components is becoming more widespread, driven by the need to improve power output, fuel efficiency, and the overall driving experience of vehicles. With global auto sales projected to surpass 92 million units in 2024, and vehicle sales in the U.S. expected to grow moderately to 15.9 million units, the demand for tuning components is on the rise. Key components such as turbochargers, performance exhaust systems, and engine control units (ECUs) are in high demand as they help optimize engine performance, boost acceleration, and enhance fuel efficiency while adhering to stringent emission standards. As manufacturers and consumers alike seek solutions to meet tightening emission regulations and improve fuel economy, the need for mechanical performance tuning components continues to grow, driving the market's expansion.

In the industrial sector, including manufacturing and construction, mechanical performance tuning components are crucial for enhancing the functionality and efficiency of machines and equipment, such as motors, pumps, and conveyors. Essential components like high-efficiency bearings, vibration dampers, and advanced lubrication systems ensure smooth operations and minimize downtime in industrial processes. The increasing demand for automation, precision machinery, and innovation in robotics, metalworking, and heavy machinery is further fueling the growth of the mechanical performance tuning components market. As industries prioritize cost-effective and high-performance solutions to improve operational efficiency, the market for these components is poised for continued expansion.

Mechanical Performance Tuning Components Market Dynamics

Drivers

  • The increasing demand for high-performance vehicles, in both consumer and professional motorsports sectors, is a key factor driving the market for mechanical performance tuning components.

Consumers are increasingly looking to tune components to improve engine power, handling, and driving experience as they become more interested in vehicle performance. This request is fueled not just by car lovers, but also by the growing trend of high-performance vehicles such as luxury cars and SUVs. These cars typically have basic setups that can be upgraded with aftermarket parts like performance exhausts, turbochargers, cold air intakes, and ECU tuning chips. Furthermore, motorsports contribute significantly to the development of performance-tuning components. Both professional racing teams and hobbyist racers are always looking for ways to enhance their vehicle's performance to gain a competitive edge. This has resulted in the creation and enhancement of aftermarket components providing better performance without sacrificing safety or dependability. For instance, upgrades in mechanical performance like lightweight engine parts, enhanced suspension systems, and high-performance brakes help vehicles achieve quicker lap times, superior handling, and increased durability in extreme conditions.

  • With governments worldwide enforcing more stringent emissions rules and consumers growing more aware of the environment, the automotive sector faces mounting demands to enhance fuel efficiency and lower vehicles' carbon footprint.

There is a high demand for performance tuning components that enhance engine performance, boost fuel efficiency, and cut down on harmful emissions. For instance, optimizing components like high-flow air filters, performance exhaust systems, and electronic tuning chips can enhance engine combustion efficiency, resulting in improved fuel economy and decreased emissions. Numerous customers are seeking aftermarket components to improve their vehicles' performance and environmental friendliness. This movement has resulted in the increase of environmentally friendly performance tuning parts that assist in obtaining a equilibrium between higher horsepower and lower environmental harm. As governments further implement strict regulations on fuel efficiency and emissions, the need for tuning components that adhere to these rules will rise. This set of regulations is pushing the creation of new technologies focused on enhancing performance and sustainability of the environment. Producers of performance tuning parts are now more dedicated to creating items that improve vehicle performance while also having a smaller environmental footprint.

Restraints

  • For many consumers, modifying their vehicles with aftermarket performance tuning components can pose a risk to the manufacturer's warranty.

Many automakers have strict policies that prohibit modifications to key vehicle systems, such as the engine, exhaust, or suspension, as these can affect the vehicle's overall performance, safety, and emissions compliance. If a vehicle owner installs aftermarket tuning components, it could void the warranty, leaving them responsible for any potential repairs or replacements. This risk can deter consumers from pursuing vehicle performance tuning, especially those who rely on their vehicle warranties for peace of mind. Some tuning component manufacturers offer warranties on their parts, but these warranties may not cover any damage to the vehicle itself or any issues caused by the modification. As a result, consumers may be hesitant to invest in tuning components if they perceive the risk of voiding their vehicle's warranty to be too great.

Key Segmentation Analysis

By Distribution Channel

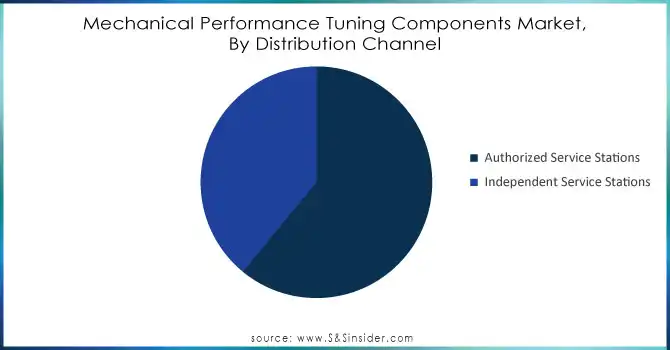
The authorized service stations segment dominated in 2023 with a 58% market share. These stations are typically affiliated with well-established vehicle manufacturers and offer a range of services that are guaranteed and supported by original equipment manufacturers (OEMs). Customers often prefer these stations for the assurance of quality and adherence to warranty standards. For instance, Bosch provides advanced fuel management systems and exhaust tuning solutions used in authorized service stations to enhance engine performance and efficiency.

The independent service stations segment is anticipated to become the fastest-growing segment due to the rising demand for cost-effective and customized performance tuning solutions. These stations offer more flexibility in services and use both OEM and aftermarket parts. They attract customers who seek personalized, budget-friendly tuning options. Independent stations tend to specialize in specific vehicle modifications, such as suspension or exhaust upgrades. Companies like HKS and Borla Exhaust supply aftermarket performance parts for such stations.
Mechanical-Performance-Tuning-Components-Market-By-Distribution-Channel

Need Any Customization Research On Mechanical Performance Tuning Components Market - Inquiry Now

By Vehicle Type

The passenger cars segment dominated in 2023, securing a 45% market share, driven by the rising popularity of personal vehicles among consumers and the growing focus on improving vehicle performance. As customers seek improved fuel efficiency, increased power output, and an enhanced driving experience, mechanical performance tuning parts like turbochargers, exhaust systems, and engine remapping kits are now necessary. Major companies such as Borla Exhaust and HKS provide custom items such as high-performance exhaust systems and air intakes designed to enhance the performance of passenger vehicle engines.

The LCVs segment is expected to experience a rapid growth rate during 2024-2032, due to the rising need for fleet efficiency and vehicle customization in logistics, delivery services, and small enterprises. With the growth of the e-commerce industry, companies such as Ford and Mercedes-Benz are incorporating performance tuning choices to improve the capability of carrying loads, fuel efficiency, and power in their vehicles. For instance, Eibach provides suspension kits designed for LCVs to enhance performance when transporting heavy loads.

Mechanical Performance Tuning Components Market Regional Analysis

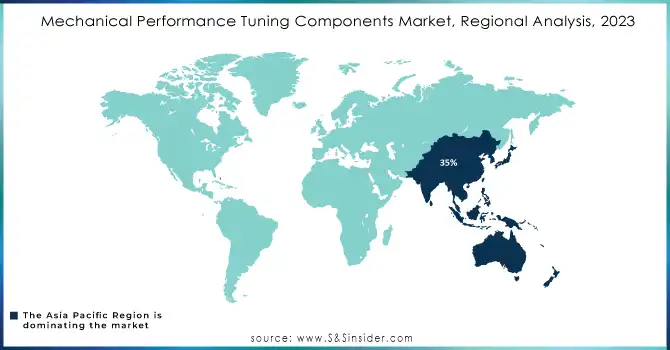
Asia-Pacific region dominated the market with a 35% market share in 2023, driven by strong growth in the automotive sector, higher disposable incomes, and the growing trend of motorsports and vehicle personalization. China, India, and Japan play a major role in driving the demand for performance tuning components due to their large automotive production and increasing consumer interest in improved vehicle performance. Key players such as DENSO Corporation, Mahle GmbH, and Hitachi Ltd. are increasing their presence in this area.

North America is forecasted to grow with the fastest CAGR between 2024 and 2032, fueled by a robust automotive enthusiast community, stricter emission standards, and the continual advancement of electric vehicles. Car enthusiasts and motorsports are driving the demand for performance tuning components, especially in the United States and Canada, as interest in customizing vehicles for improved fuel efficiency, safety, and performance continues to rise. Key players like Tenneco Inc., BorgWarner Inc., and Honeywell International Inc., play a vital role in advancing innovation in performance parts such as turbochargers and exhaust systems.
Mechanical-Performance-Tuning-Components-Market-Regional-Analysis-2023

Key Players in Mechanical Performance Tuning Components Market

The major key players in the Mechanical Performance Tuning Components Market are:

  • Bosch Engineering (Turbochargers, Engine Management Systems)

  • Magna International (Suspension Systems, Performance Exhaust Systems)

  • Edelbrock (Intake Manifolds, Superchargers)

  • K&N Engineering (Air Filters, Cold Air Intakes)

  • Flowmaster (Performance Mufflers, Exhaust Systems)

  • Brembo (Brake Calipers, Performance Brake Pads)

  • HKS (Turbo Kits, Performance Intercoolers)

  • Sachs (Shock Absorbers, Performance Springs)

  • Bilstein (Shock Absorbers, Performance Dampers)

  • AEM Performance Electronics (Air Fuel Ratio Gauges, Fuel Management Systems)

  • APR (Turbocharger Kits, Performance ECU Tuning)

  • Tein (Coilover Kits, Performance Springs)

  • SPARCO (Racing Seats, Performance Steering Wheels)

  • Tomei Powered (Exhaust Manifolds, Performance Camshafts)

  • Garrett Motion (Turbochargers, Wastegates)

  • Mishimoto (Radiators, Performance Cooling Fans)

  • Greddy (Intercoolers, Exhaust Systems)

  • Vortech Superchargers (Supercharger Kits, Fuel Systems)

  • Racepak (Data Loggers, Performance Gauges)

  • Cobb Tuning (ECU Tuning, Performance Exhaust Systems)

Suppliers that provide raw materials/components to these manufacturers:

  • Alcoa (Aluminum)

  • Acerinox (Stainless Steel)

  • SABIC (Plastics and Polymers)

  • ArcelorMittal (Steel Alloys)

  • Freudenberg Sealing Technologies (Seals and Gaskets)

  • 3M (Adhesives, Performance Materials)

  • Saint-Gobain (Ceramic Materials, Bearings)

  • SKF (Bearings, Seals)

  • Dow Chemical (Silicones, Lubricants)

  • Sumitomo Electric (Wires, Cables, Electrical Components)

Mechanical Performance Tuning Components Market Report Scope:

Report Attributes Details
Market Size in 2023 USD 205.88 Billion 
Market Size by 2032 USD 281.21 Billion 
CAGR CAGR of 3.57% From 2024 to 2032
Base Year 2023
Forecast Period 2024-2032
Historical Data 2020-2022
Report Scope & Coverage Market Size, Segments Analysis, Competitive  Landscape, Regional Analysis, DROC & SWOT Analysis, Forecast Outlook
Key Segments • By Product (Engine, Transmission, Fuel System, Brake, Body & Suspension, Exhaust Mufflers)
• By Distribution Channel (Authorized Service Stations, Independent Service Stations)
• By Vehicle Type (Passenger Cars, LCVs, HCVs)
Regional Analysis/Coverage North America (US, Canada, Mexico), Europe (Eastern Europe [Poland, Romania, Hungary, Turkey, Rest of Eastern Europe] Western Europe] Germany, France, UK, Italy, Spain, Netherlands, Switzerland, Austria, Rest of Western Europe]), Asia Pacific (China, India, Japan, South Korea, Vietnam, Singapore, Australia, Rest of Asia Pacific), Middle East & Africa (Middle East [UAE, Egypt, Saudi Arabia, Qatar, Rest of Middle East], Africa [Nigeria, South Africa, Rest of Africa], Latin America (Brazil, Argentina, Colombia, Rest of Latin America)
Company Profiles Bosch Engineering, Magna International, Edelbrock, K&N Engineering, Flowmaster, Brembo, HKS, Sachs, Bilstein, AEM Performance Electronics, APR, Tein, SPARCO, Tomei Powered, Garrett Motion, Mishimoto, Greddy, Vortech Superchargers, Racepak, Cobb Tuning
Key Drivers • The increasing demand for high-performance vehicles, in both consumer and professional motorsports sectors, is a key factor driving the market for mechanical performance tuning components.
• With strict government rules, the automotive sector faces mounting demands to enhance fuel efficiency and lower vehicles' carbon footprint.  
Restraints • Governments around the world are implementing increasingly stringent regulations regarding vehicle emissions and safety, and these regulations can impact the market. 

Frequently Asked Questions

Ans:  The Mechanical Performance Tuning Components Market is expected to grow at a CAGR of 3.57%.

Ans: The Mechanical Performance Tuning Components Market size was USD 205.88 billion in 2023 and is expected to Reach USD 281.21 billion by 2032.

Ans: The increasing demand for high-performance vehicles, in both consumer and professional motorsports sectors, is a key factor driving the market for mechanical performance tuning components.

Ans: The Authorized Service Stations segment dominated the Mechanical Performance Tuning Components Market in 2023.

Ans: APAC dominated the Mechanical Performance Tuning Components Market in 2023.

Table of Contents

1. Introduction

1.1 Market Definition

1.2 Scope (Inclusion and Exclusions)

1.3 Research Assumptions

2. Executive Summary

2.1 Market Overview

2.2 Regional Synopsis

2.3 Competitive Summary

3. Research Methodology

3.1 Top-Down Approach

3.2 Bottom-up Approach

3.3. Data Validation

3.4 Primary Interviews

4. Market Dynamics Impact Analysis

4.1 Market Driving Factors Analysis

4.1.1 Drivers

4.1.2 Restraints

4.1.3 Opportunities

4.1.4 Challenges

4.2 PESTLE Analysis

4.3 Porter’s Five Forces Model

5. Statistical Insights and Trends Reporting

5.1 Mechanical Performance Tuning Components R&D Spending Trends

     5.2 Price Trends

     5.3 Innovation and R&D Investment

     5.4 Supply Chain Analysis

6. Competitive Landscape

6.1 List of Major Companies, By Region

6.2 Market Share Analysis, By Region

6.3 Product Benchmarking

6.3.1 Product specifications and features

6.3.2 Pricing

6.4 Strategic Initiatives

6.4.1 Marketing and promotional activities

6.4.2 Distribution and Supply Chain Strategies

6.4.3 Expansion plans and new product launches

6.4.4 Strategic partnerships and collaborations

6.5 Technological Advancements

6.6 Market Positioning and Branding

7. Mechanical Performance Tuning Components Market Segmentation, by Product Type

7.1 Chapter Overview

7.2 Engine

7.2.1 Engine Market Trends Analysis (2020-2032)

7.2.2 Engine Market Size Estimates and Forecasts to 2032 (USD Billion)

7.2.3 Engine Oil

7.2.3.1 Engine Oil Market Trends Analysis (2020-2032)

7.2.3.2 Engine Oil Market Size Estimates and Forecasts to 2032 (USD Billion)

7.2.4 Oil Filters

7.2.4.1 Oil Filters Market Trends Analysis (2020-2032)

7.2.4.2 Oil Filters Market Size Estimates and Forecasts to 2032 (USD Billion)

7.2.5 Cam Pulleys

7.2.5.1 Cam Pulleys Market Trends Analysis (2020-2032)

7.2.5.2 Cam Pulleys Market Size Estimates and Forecasts to 2032 (USD Billion)

7.2.6 Engine Mounts

7.2.6.1 Engine Mounts Market Trends Analysis (2020-2032)

7.2.6.2 Engine Mounts Market Size Estimates and Forecasts to 2032 (USD Billion)

7.3 Transmission

7.3.1 Transmission Market Trends Analysis (2020-2032)

7.3.2 Transmission Market Size Estimates and Forecasts to 2032 (USD Billion)

7.3.3 Belts

7.3.3.1 Belts Market Trends Analysis (2020-2032)

7.3.3.2 Belts Market Size Estimates and Forecasts to 2032 (USD Billion)

7.3.4 Gear Oils

7.3.4.1 Gear Oils Market Trends Analysis (2020-2032)

7.3.4.2 Gear Oils Market Size Estimates and Forecasts to 2032 (USD Billion)

7.3.5 Turbochargers

7.3.5.1 Turbochargers Market Trends Analysis (2020-2032)

7.3.5.2 Turbochargers Market Size Estimates and Forecasts to 2032 (USD Billion)

7.3.6 Pressure Plates

7.3.6.1 Pressure Plates Market Trends Analysis (2020-2032)

7.3.6.2 Pressure Plates Market Size Estimates and Forecasts to 2032 (USD Billion)

7.3.7 Throttle Cables

7.3.7.1 Throttle Cables Market Trends Analysis (2020-2032)

7.3.7.2 Throttle Cables Market Size Estimates and Forecasts to 2032 (USD Billion)

7.3.8 Others

7.3.8.1 Others Market Trends Analysis (2020-2032)

7.3.8.2 Others Market Size Estimates and Forecasts to 2032 (USD Billion)

7.4 Fuel System

7.4.1 Fuel System Market Trends Analysis (2020-2032)

7.4.2 Fuel System Market Size Estimates and Forecasts to 2032 (USD Billion)

7.4.3 Fuel Injectors

7.4.3.1 Fuel Injectors Market Trends Analysis (2020-2032)

7.4.3.2 Fuel Injectors Market Size Estimates and Forecasts to 2032 (USD Billion)

7.4.4 Pumps

7.4.4.1 Pumps Market Trends Analysis (2020-2032)

7.4.4.2 Pumps Market Size Estimates and Forecasts to 2032 (USD Billion)

7.4.5 Plugs

7.4.5.1 Plugs Market Trends Analysis (2020-2032)

7.4.5.2 Plugs Market Size Estimates and Forecasts to 2032 (USD Billion)

7.4.6 Filters

7.4.6.1 Filters Market Trends Analysis (2020-2032)

7.4.6.2 Filters Market Size Estimates and Forecasts to 2032 (USD Billion)

7.5 Brake

7.5.1 Brake Market Trends Analysis (2020-2032)

7.5.2 Brake Market Size Estimates and Forecasts to 2032 (USD Billion)

7.5.3 Brake Oil

7.5.3.1 Brake Oil Market Trends Analysis (2020-2032)

7.5.3.2 Brake Oil Market Size Estimates and Forecasts to 2032 (USD Billion)

7.5.4 Brake Liners

7.5.4.1 Brake Liners Market Trends Analysis (2020-2032)

7.5.4.2 Brake Liners Market Size Estimates and Forecasts to 2032 (USD Billion)

7.5.5 Master Cylinders

7.5.5.1 Master Cylinders Market Trends Analysis (2020-2032)

7.5.5.2 Master Cylinders Market Size Estimates and Forecasts to 2032 (USD Billion)

7.5.6 Brake Calipers

7.5.6.1 Brake Calipers Market Trends Analysis (2020-2032)

7.5.6.2 Brake Calipers Market Size Estimates and Forecasts to 2032 (USD Billion)

7.5.7 Brake Shoes

7.5.7.1 Brake Shoes Market Trends Analysis (2020-2032)

7.5.7.2 Brake Shoes Market Size Estimates and Forecasts to 2032 (USD Billion)

7.6 Body & Suspension

7.6.1 Body & Suspension Market Trends Analysis (2020-2032)

7.6.2 Body & Suspension Market Size Estimates and Forecasts to 2032 (USD Billion)

7.6.3 Sway Bars

7.6.3.1 Sway Bars Market Trends Analysis (2020-2032)

7.6.3.2 Sway Bars Market Size Estimates and Forecasts to 2032 (USD Billion)

7.6.4 Shock Absorbers

7.6.4.1 Shock Absorbers Market Trends Analysis (2020-2032)

7.6.4.2 Shock Absorbers Market Size Estimates and Forecasts to 2032 (USD Billion)

7.6.5 Suspension Bushes

7.6.5.1 Suspension Bushes Market Trends Analysis (2020-2032)

7.6.5.2 Suspension Bushes Market Size Estimates and Forecasts to 2032 (USD Billion)

7.7 Exhaust Mufflers

7.7.1 Exhaust Mufflers Market Trends Analysis (2020-2032)

7.7.2 Exhaust Mufflers Market Size Estimates and Forecasts to 2032 (USD Billion)

8. Mechanical Performance Tuning Components Market Segmentation, by Distribution Channel

8.1 Chapter Overview

8.2 Authorized Service Stations

8.2.1 Authorized Service Stations Market Trends Analysis (2020-2032)

8.2.2 Authorized Service Stations Market Size Estimates and Forecasts to 2032 (USD Billion)

8.3 Independent Service Stations

8.3.1 Independent Service Stations Market Trends Analysis (2020-2032)

8.3.2 Independent Service Stations Market Size Estimates and Forecasts to 2032 (USD Billion)

9. Mechanical Performance Tuning Components Market Segmentation, By Vehicle Type

9.1 Chapter Overview

9.2 Passenger Cars

9.2.1 Passenger Cars Market Trends Analysis (2020-2032)

9.2.2 Passenger Cars Market Size Estimates and Forecasts to 2032 (USD Billion)

9.3 LCVs

9.3.1 LCVs Market Trends Analysis (2020-2032)

9.3.2 LCVs Market Size Estimates and Forecasts to 2032 (USD Billion)

9.4 HCVs

9.4.1 HCVs Market Trends Analysis (2020-2032)

9.4.2 HCVs Market Size Estimates and Forecasts to 2032 (USD Billion)

10. Regional Analysis

10.1 Chapter Overview

10.2 North America

10.2.1 Trends Analysis

10.2.2 North America Mechanical Performance Tuning Components Market Estimates and Forecasts, by Country (2020-2032) (USD Billion)

10.2.3 North America Mechanical Performance Tuning Components Market Estimates and Forecasts, by Product Type (2020-2032) (USD Billion)  

10.2.4 North America Mechanical Performance Tuning Components Market Estimates and Forecasts, by Distribution Channel (2020-2032) (USD Billion)

10.2.5 North America Mechanical Performance Tuning Components Market Estimates and Forecasts, By Vehicle Type (2020-2032) (USD Billion)

10.2.6 USA

10.2.6.1 USA Mechanical Performance Tuning Components Market Estimates and Forecasts, by Product Type (2020-2032) (USD Billion)

10.2.6.2 USA Mechanical Performance Tuning Components Market Estimates and Forecasts, by Distribution Channel (2020-2032) (USD Billion)

10.2.6.3 USA Mechanical Performance Tuning Components Market Estimates and Forecasts, By Vehicle Type (2020-2032) (USD Billion)

10.2.7 Canada

10.2.7.1 Canada Mechanical Performance Tuning Components Market Estimates and Forecasts, by Product Type (2020-2032) (USD Billion)

10.2.7.2 Canada Mechanical Performance Tuning Components Market Estimates and Forecasts, by Distribution Channel (2020-2032) (USD Billion)

10.2.7.3 Canada Mechanical Performance Tuning Components Market Estimates and Forecasts, By Vehicle Type (2020-2032) (USD Billion)

10.2.8 Mexico

10.2.8.1 Mexico Mechanical Performance Tuning Components Market Estimates and Forecasts, by Product Type (2020-2032) (USD Billion)

10.2.8.2 Mexico Mechanical Performance Tuning Components Market Estimates and Forecasts, by Distribution Channel (2020-2032) (USD Billion)

10.2.8.3 Mexico Mechanical Performance Tuning Components Market Estimates and Forecasts, By Vehicle Type (2020-2032) (USD Billion)

10.3 Europe

10.3.1 Eastern Europe

10.3.1.1 Trends Analysis

10.3.1.2 Eastern Europe Mechanical Performance Tuning Components Market Estimates and Forecasts, by Country (2020-2032) (USD Billion)

10.3.1.3 Eastern Europe Mechanical Performance Tuning Components Market Estimates and Forecasts, by Product Type (2020-2032) (USD Billion)  

10.3.1.4 Eastern Europe Mechanical Performance Tuning Components Market Estimates and Forecasts, by Distribution Channel (2020-2032) (USD Billion)

10.3.1.5 Eastern Europe Mechanical Performance Tuning Components Market Estimates and Forecasts, By Vehicle Type (2020-2032) (USD Billion)

10.3.1.6 Poland

10.3.1.6.1 Poland Mechanical Performance Tuning Components Market Estimates and Forecasts, by Product Type (2020-2032) (USD Billion)

10.3.1.6.2 Poland Mechanical Performance Tuning Components Market Estimates and Forecasts, by Distribution Channel (2020-2032) (USD Billion)

10.3.1.6.3 Poland Mechanical Performance Tuning Components Market Estimates and Forecasts, By Vehicle Type (2020-2032) (USD Billion)

10.3.1.7 Romania

10.3.1.7.1 Romania Mechanical Performance Tuning Components Market Estimates and Forecasts, by Product Type (2020-2032) (USD Billion)

10.3.1.7.2 Romania Mechanical Performance Tuning Components Market Estimates and Forecasts, by Distribution Channel (2020-2032) (USD Billion)

10.3.1.7.3 Romania Mechanical Performance Tuning Components Market Estimates and Forecasts, By Vehicle Type (2020-2032) (USD Billion)

10.3.1.8 Hungary

10.3.1.8.1 Hungary Mechanical Performance Tuning Components Market Estimates and Forecasts, by Product Type (2020-2032) (USD Billion)

10.3.1.8.2 Hungary Mechanical Performance Tuning Components Market Estimates and Forecasts, by Distribution Channel (2020-2032) (USD Billion)

10.3.1.8.3 Hungary Mechanical Performance Tuning Components Market Estimates and Forecasts, By Vehicle Type (2020-2032) (USD Billion)

10.3.1.9 Turkey

10.3.1.9.1 Turkey Mechanical Performance Tuning Components Market Estimates and Forecasts, by Product Type (2020-2032) (USD Billion)

10.3.1.9.2 Turkey Mechanical Performance Tuning Components Market Estimates and Forecasts, by Distribution Channel (2020-2032) (USD Billion)

10.3.1.9.3 Turkey Mechanical Performance Tuning Components Market Estimates and Forecasts, By Vehicle Type (2020-2032) (USD Billion)

10.3.1.10 Rest of Eastern Europe

10.3.1.10.1 Rest of Eastern Europe Mechanical Performance Tuning Components Market Estimates and Forecasts, by Product Type (2020-2032) (USD Billion)

10.3.1.10.2 Rest of Eastern Europe Mechanical Performance Tuning Components Market Estimates and Forecasts, by Distribution Channel (2020-2032) (USD Billion)

10.3.1.10.3 Rest of Eastern Europe Mechanical Performance Tuning Components Market Estimates and Forecasts, By Vehicle Type (2020-2032) (USD Billion)

10.3.2 Western Europe

10.3.2.1 Trends Analysis

10.3.2.2 Western Europe Mechanical Performance Tuning Components Market Estimates and Forecasts, by Country (2020-2032) (USD Billion)

10.3.2.3 Western Europe Mechanical Performance Tuning Components Market Estimates and Forecasts, by Product Type (2020-2032) (USD Billion)  

10.3.2.4 Western Europe Mechanical Performance Tuning Components Market Estimates and Forecasts, by Distribution Channel (2020-2032) (USD Billion)

10.3.2.5 Western Europe Mechanical Performance Tuning Components Market Estimates and Forecasts, By Vehicle Type (2020-2032) (USD Billion)

10.3.2.6 Germany

10.3.2.6.1 Germany Mechanical Performance Tuning Components Market Estimates and Forecasts, by Product Type (2020-2032) (USD Billion)

10.3.2.6.2 Germany Mechanical Performance Tuning Components Market Estimates and Forecasts, by Distribution Channel (2020-2032) (USD Billion)

10.3.2.6.3 Germany Mechanical Performance Tuning Components Market Estimates and Forecasts, By Vehicle Type (2020-2032) (USD Billion)

10.3.2.7 France

10.3.2.7.1 France Mechanical Performance Tuning Components Market Estimates and Forecasts, by Product Type (2020-2032) (USD Billion)

10.3.2.7.2 France Mechanical Performance Tuning Components Market Estimates and Forecasts, by Distribution Channel (2020-2032) (USD Billion)

10.3.2.7.3 France Mechanical Performance Tuning Components Market Estimates and Forecasts, By Vehicle Type (2020-2032) (USD Billion)

10.3.2.8 UK

10.3.2.8.1 UK Mechanical Performance Tuning Components Market Estimates and Forecasts, by Product Type (2020-2032) (USD Billion)

10.3.2.8.2 UK Mechanical Performance Tuning Components Market Estimates and Forecasts, by Distribution Channel (2020-2032) (USD Billion)

10.3.2.8.3 UK Mechanical Performance Tuning Components Market Estimates and Forecasts, By Vehicle Type (2020-2032) (USD Billion)

10.3.2.9 Italy

10.3.2.9.1 Italy Mechanical Performance Tuning Components Market Estimates and Forecasts, by Product Type (2020-2032) (USD Billion)

10.3.2.9.2 Italy Mechanical Performance Tuning Components Market Estimates and Forecasts, by Distribution Channel (2020-2032) (USD Billion)

10.3.2.9.3 Italy Mechanical Performance Tuning Components Market Estimates and Forecasts, By Vehicle Type (2020-2032) (USD Billion)

10.3.2.10 Spain

10.3.2.10.1 Spain Mechanical Performance Tuning Components Market Estimates and Forecasts, by Product Type (2020-2032) (USD Billion)

10.3.2.10.2 Spain Mechanical Performance Tuning Components Market Estimates and Forecasts, by Distribution Channel (2020-2032) (USD Billion)

10.3.2.10.3 Spain Mechanical Performance Tuning Components Market Estimates and Forecasts, By Vehicle Type (2020-2032) (USD Billion)

10.3.2.11 Netherlands

10.3.2.11.1 Netherlands Mechanical Performance Tuning Components Market Estimates and Forecasts, by Product Type (2020-2032) (USD Billion)

10.3.2.11.2 Netherlands Mechanical Performance Tuning Components Market Estimates and Forecasts, by Distribution Channel (2020-2032) (USD Billion)

10.3.2.11.3 Netherlands Mechanical Performance Tuning Components Market Estimates and Forecasts, By Vehicle Type (2020-2032) (USD Billion)

10.3.2.12 Switzerland

10.3.2.12.1 Switzerland Mechanical Performance Tuning Components Market Estimates and Forecasts, by Product Type (2020-2032) (USD Billion)

10.3.2.12.2 Switzerland Mechanical Performance Tuning Components Market Estimates and Forecasts, by Distribution Channel (2020-2032) (USD Billion)

10.3.2.12.3 Switzerland Mechanical Performance Tuning Components Market Estimates and Forecasts, By Vehicle Type (2020-2032) (USD Billion)

10.3.2.13 Austria

10.3.2.13.1 Austria Mechanical Performance Tuning Components Market Estimates and Forecasts, by Product Type (2020-2032) (USD Billion)

10.3.2.13.2 Austria Mechanical Performance Tuning Components Market Estimates and Forecasts, by Distribution Channel (2020-2032) (USD Billion)

10.3.2.13.3 Austria Mechanical Performance Tuning Components Market Estimates and Forecasts, By Vehicle Type (2020-2032) (USD Billion)

10.3.2.14 Rest of Western Europe

10.3.2.14.1 Rest of Western Europe Mechanical Performance Tuning Components Market Estimates and Forecasts, by Product Type (2020-2032) (USD Billion)

10.3.2.14.2 Rest of Western Europe Mechanical Performance Tuning Components Market Estimates and Forecasts, by Distribution Channel (2020-2032) (USD Billion)

10.3.2.14.3 Rest of Western Europe Mechanical Performance Tuning Components Market Estimates and Forecasts, By Vehicle Type (2020-2032) (USD Billion)

10.4 Asia Pacific

10.4.1 Trends Analysis

10.4.2 Asia Pacific Mechanical Performance Tuning Components Market Estimates and Forecasts, by Country (2020-2032) (USD Billion)

10.4.3 Asia Pacific Mechanical Performance Tuning Components Market Estimates and Forecasts, by Product Type (2020-2032) (USD Billion)  

10.4.4 Asia Pacific Mechanical Performance Tuning Components Market Estimates and Forecasts, by Distribution Channel (2020-2032) (USD Billion)

10.4.5 Asia Pacific Mechanical Performance Tuning Components Market Estimates and Forecasts, By Vehicle Type (2020-2032) (USD Billion)

10.4.6 China

10.4.6.1 China Mechanical Performance Tuning Components Market Estimates and Forecasts, by Product Type (2020-2032) (USD Billion)

10.4.6.2 China Mechanical Performance Tuning Components Market Estimates and Forecasts, by Distribution Channel (2020-2032) (USD Billion)

10.4.6.3 China Mechanical Performance Tuning Components Market Estimates and Forecasts, By Vehicle Type (2020-2032) (USD Billion)

10.4.7 India

10.4.7.1 India Mechanical Performance Tuning Components Market Estimates and Forecasts, by Product Type (2020-2032) (USD Billion)

10.4.7.2 India Mechanical Performance Tuning Components Market Estimates and Forecasts, by Distribution Channel (2020-2032) (USD Billion)

10.4.7.3 India Mechanical Performance Tuning Components Market Estimates and Forecasts, By Vehicle Type (2020-2032) (USD Billion)

10.4.8 Japan

10.4.8.1 Japan Mechanical Performance Tuning Components Market Estimates and Forecasts, by Product Type (2020-2032) (USD Billion)

10.4.8.2 Japan Mechanical Performance Tuning Components Market Estimates and Forecasts, by Distribution Channel (2020-2032) (USD Billion)

10.4.8.3 Japan Mechanical Performance Tuning Components Market Estimates and Forecasts, By Vehicle Type (2020-2032) (USD Billion)

10.4.9 South Korea

10.4.9.1 South Korea Mechanical Performance Tuning Components Market Estimates and Forecasts, by Product Type (2020-2032) (USD Billion)

10.4.9.2 South Korea Mechanical Performance Tuning Components Market Estimates and Forecasts, by Distribution Channel (2020-2032) (USD Billion)

10.4.9.3 South Korea Mechanical Performance Tuning Components Market Estimates and Forecasts, By Vehicle Type (2020-2032) (USD Billion)

10.4.10 Vietnam

10.4.10.1 Vietnam Mechanical Performance Tuning Components Market Estimates and Forecasts, by Product Type (2020-2032) (USD Billion)

10.4.10.2 Vietnam Mechanical Performance Tuning Components Market Estimates and Forecasts, by Distribution Channel (2020-2032) (USD Billion)

10.4.10.3 Vietnam Mechanical Performance Tuning Components Market Estimates and Forecasts, By Vehicle Type (2020-2032) (USD Billion)

10.4.11 Singapore

10.4.11.1 Singapore Mechanical Performance Tuning Components Market Estimates and Forecasts, by Product Type (2020-2032) (USD Billion)

10.4.11.2 Singapore Mechanical Performance Tuning Components Market Estimates and Forecasts, by Distribution Channel (2020-2032) (USD Billion)

10.4.11.3 Singapore Mechanical Performance Tuning Components Market Estimates and Forecasts, By Vehicle Type (2020-2032) (USD Billion)

10.4.12 Australia

10.4.12.1 Australia Mechanical Performance Tuning Components Market Estimates and Forecasts, by Product Type (2020-2032) (USD Billion)

10.4.12.2 Australia Mechanical Performance Tuning Components Market Estimates and Forecasts, by Distribution Channel (2020-2032) (USD Billion)

10.4.12.3 Australia Mechanical Performance Tuning Components Market Estimates and Forecasts, By Vehicle Type (2020-2032) (USD Billion)

10.4.13 Rest of Asia Pacific

10.4.13.1 Rest of Asia Pacific Mechanical Performance Tuning Components Market Estimates and Forecasts, by Product Type (2020-2032) (USD Billion)

10.4.13.2 Rest of Asia Pacific Mechanical Performance Tuning Components Market Estimates and Forecasts, by Distribution Channel (2020-2032) (USD Billion)

10.4.13.3 Rest of Asia Pacific Mechanical Performance Tuning Components Market Estimates and Forecasts, By Vehicle Type (2020-2032) (USD Billion)

10.5 Middle East and Africa

10.5.1 Middle East

10.5.1.1 Trends Analysis

10.5.1.2 Middle East Mechanical Performance Tuning Components Market Estimates and Forecasts, by Country (2020-2032) (USD Billion)

10.5.1.3 Middle East Mechanical Performance Tuning Components Market Estimates and Forecasts, by Product Type (2020-2032) (USD Billion)  

10.5.1.4 Middle East Mechanical Performance Tuning Components Market Estimates and Forecasts, by Distribution Channel (2020-2032) (USD Billion)

10.5.1.5 Middle East Mechanical Performance Tuning Components Market Estimates and Forecasts, By Vehicle Type (2020-2032) (USD Billion)

10.5.1.6 UAE

10.5.1.6.1 UAE Mechanical Performance Tuning Components Market Estimates and Forecasts, by Product Type (2020-2032) (USD Billion)

10.5.1.6.2 UAE Mechanical Performance Tuning Components Market Estimates and Forecasts, by Distribution Channel (2020-2032) (USD Billion)

10.5.1.6.3 UAE Mechanical Performance Tuning Components Market Estimates and Forecasts, By Vehicle Type (2020-2032) (USD Billion)

10.5.1.7 Egypt

10.5.1.7.1 Egypt Mechanical Performance Tuning Components Market Estimates and Forecasts, by Product Type (2020-2032) (USD Billion)

10.5.1.7.2 Egypt Mechanical Performance Tuning Components Market Estimates and Forecasts, by Distribution Channel (2020-2032) (USD Billion)

10.5.1.7.3 Egypt Mechanical Performance Tuning Components Market Estimates and Forecasts, By Vehicle Type (2020-2032) (USD Billion)

10.5.1.8 Saudi Arabia

10.5.1.8.1 Saudi Arabia Mechanical Performance Tuning Components Market Estimates and Forecasts, by Product Type (2020-2032) (USD Billion)

10.5.1.8.2 Saudi Arabia Mechanical Performance Tuning Components Market Estimates and Forecasts, by Distribution Channel (2020-2032) (USD Billion)

10.5.1.8.3 Saudi Arabia Mechanical Performance Tuning Components Market Estimates and Forecasts, By Vehicle Type (2020-2032) (USD Billion)

10.5.1.9 Qatar

10.5.1.9.1 Qatar Mechanical Performance Tuning Components Market Estimates and Forecasts, by Product Type (2020-2032) (USD Billion)

10.5.1.9.2 Qatar Mechanical Performance Tuning Components Market Estimates and Forecasts, by Distribution Channel (2020-2032) (USD Billion)

10.5.1.9.3 Qatar Mechanical Performance Tuning Components Market Estimates and Forecasts, By Vehicle Type (2020-2032) (USD Billion)

10.5.1.10 Rest of Middle East

10.5.1.10.1 Rest of Middle East Mechanical Performance Tuning Components Market Estimates and Forecasts, by Product Type (2020-2032) (USD Billion)

10.5.1.10.2 Rest of Middle East Mechanical Performance Tuning Components Market Estimates and Forecasts, by Distribution Channel (2020-2032) (USD Billion)

10.5.1.10.3 Rest of Middle East Mechanical Performance Tuning Components Market Estimates and Forecasts, By Vehicle Type (2020-2032) (USD Billion)

10.5.2 Africa

10.5.2.1 Trends Analysis

10.5.2.2 Africa Mechanical Performance Tuning Components Market Estimates and Forecasts, by Country (2020-2032) (USD Billion)

10.5.2.3 Africa Mechanical Performance Tuning Components Market Estimates and Forecasts, by Product Type (2020-2032) (USD Billion)  

10.5.2.4 Africa Mechanical Performance Tuning Components Market Estimates and Forecasts, by Distribution Channel (2020-2032) (USD Billion)

10.5.2.5 Africa Mechanical Performance Tuning Components Market Estimates and Forecasts, By Vehicle Type (2020-2032) (USD Billion)

10.5.2.6 South Africa

10.5.2.6.1 South Africa Mechanical Performance Tuning Components Market Estimates and Forecasts, by Product Type (2020-2032) (USD Billion)

10.5.2.6.2 South Africa Mechanical Performance Tuning Components Market Estimates and Forecasts, by Distribution Channel (2020-2032) (USD Billion)

10.5.2.6.3 South Africa Mechanical Performance Tuning Components Market Estimates and Forecasts, By Vehicle Type (2020-2032) (USD Billion)

10.5.2.7 Nigeria

10.5.2.7.1 Nigeria Mechanical Performance Tuning Components Market Estimates and Forecasts, by Product Type (2020-2032) (USD Billion)

10.5.2.7.2 Nigeria Mechanical Performance Tuning Components Market Estimates and Forecasts, by Distribution Channel (2020-2032) (USD Billion)

10.5.2.7.3 Nigeria Mechanical Performance Tuning Components Market Estimates and Forecasts, By Vehicle Type (2020-2032) (USD Billion)

10.5.2.8 Rest of Africa

10.5.2.8.1 Rest of Africa Mechanical Performance Tuning Components Market Estimates and Forecasts, by Product Type (2020-2032) (USD Billion)

10.5.2.8.2 Rest of Africa Mechanical Performance Tuning Components Market Estimates and Forecasts, by Distribution Channel (2020-2032) (USD Billion)

10.5.2.8.3 Rest of Africa Mechanical Performance Tuning Components Market Estimates and Forecasts, By Vehicle Type (2020-2032) (USD Billion)

10.6 Latin America

10.6.1 Trends Analysis

10.6.2 Latin America Mechanical Performance Tuning Components Market Estimates and Forecasts, by Country (2020-2032) (USD Billion)

10.6.3 Latin America Mechanical Performance Tuning Components Market Estimates and Forecasts, by Product Type (2020-2032) (USD Billion)  

10.6.4 Latin America Mechanical Performance Tuning Components Market Estimates and Forecasts, by Distribution Channel (2020-2032) (USD Billion)

10.6.5 Latin America Mechanical Performance Tuning Components Market Estimates and Forecasts, By Vehicle Type (2020-2032) (USD Billion)

10.6.6 Brazil

10.6.6.1 Brazil Mechanical Performance Tuning Components Market Estimates and Forecasts, by Product Type (2020-2032) (USD Billion)

10.6.6.2 Brazil Mechanical Performance Tuning Components Market Estimates and Forecasts, by Distribution Channel (2020-2032) (USD Billion)

10.6.6.3 Brazil Mechanical Performance Tuning Components Market Estimates and Forecasts, By Vehicle Type (2020-2032) (USD Billion)

10.6.7 Argentina

10.6.7.1 Argentina Mechanical Performance Tuning Components Market Estimates and Forecasts, by Product Type (2020-2032) (USD Billion)

10.6.7.2 Argentina Mechanical Performance Tuning Components Market Estimates and Forecasts, by Distribution Channel (2020-2032) (USD Billion)

10.6.7.3 Argentina Mechanical Performance Tuning Components Market Estimates and Forecasts, By Vehicle Type (2020-2032) (USD Billion)

10.6.8 Colombia

10.6.8.1 Colombia Mechanical Performance Tuning Components Market Estimates and Forecasts, by Product Type (2020-2032) (USD Billion)

10.6.8.2 Colombia Mechanical Performance Tuning Components Market Estimates and Forecasts, by Distribution Channel (2020-2032) (USD Billion)

10.6.8.3 Colombia Mechanical Performance Tuning Components Market Estimates and Forecasts, By Vehicle Type (2020-2032) (USD Billion)

10.6.9 Rest of Latin America

10.6.9.1 Rest of Latin America Mechanical Performance Tuning Components Market Estimates and Forecasts, by Product Type (2020-2032) (USD Billion)

10.6.9.2 Rest of Latin America Mechanical Performance Tuning Components Market Estimates and Forecasts, by Distribution Channel (2020-2032) (USD Billion)

10.6.9.3 Rest of Latin America Mechanical Performance Tuning Components Market Estimates and Forecasts, By Vehicle Type (2020-2032) (USD Billion)

11. Company Profiles

11.1 Bosch Engineering

11.1.1 Company Overview

11.1.2 Financial

11.1.3 Products/ Services Offered

11.1.4 SWOT Analysis

11.2 Magna International

11.2.1 Company Overview

11.2.2 Financial

11.2.3 Products/ Services Offered

11.2.4 SWOT Analysis

11.3 Edelbrock

11.3.1 Company Overview

11.3.2 Financial

11.3.3 Products/ Services Offered

11.3.4 SWOT Analysis

11.4 K&N Engineering

11.4.1 Company Overview

11.4.2 Financial

11.4.3 Products/ Services Offered

11.4.4 SWOT Analysis

11.5 Flowmaster

11.5.1 Company Overview

11.5.2 Financial

11.5.3 Products/ Services Offered

11.5.4 SWOT Analysis

11.6 Brembo

11.6.1 Company Overview

11.6.2 Financial

11.6.3 Products/ Services Offered

11.6.4 SWOT Analysis

11.7 HKS

11.7.1 Company Overview

11.7.2 Financial

11.7.3 Products/ Services Offered

11.7.4 SWOT Analysis

11.8 Sachs

11.8.1 Company Overview

11.8.2 Financial

11.8.3 Products/ Services Offered

11.8.4 SWOT Analysis

11.9 Mishimoto

11.9.1 Company Overview

11.9.2 Financial

11.9.3 Products/ Services Offered

11.9.4 SWOT Analysis

11.10 Greddy

11.10.1 Company Overview

11.10.2 Financial

11.10.3 Products/ Services Offered

11.10.4 SWOT Analysis

12. Use Cases and Best Practices

13. Conclusion

An accurate research report requires proper strategizing as well as implementation. There are multiple factors involved in the completion of good and accurate research report and selecting the best methodology to compete the research is the toughest part. Since the research reports we provide play a crucial role in any company’s decision-making process, therefore we at SNS Insider always believe that we should choose the best method which gives us results closer to reality. This allows us to reach at a stage wherein we can provide our clients best and accurate investment to output ratio.

Each report that we prepare takes a timeframe of 350-400 business hours for production. Starting from the selection of titles through a couple of in-depth brain storming session to the final QC process before uploading our titles on our website we dedicate around 350 working hours. The titles are selected based on their current market cap and the foreseen CAGR and growth.


The 5 steps process:

Step 1: Secondary Research:

Secondary Research or Desk Research is as the name suggests is a research process wherein, we collect data through the readily available information. In this process we use various paid and unpaid databases which our team has access to and gather data through the same. This includes examining of listed companies’ annual reports, Journals, SEC filling etc. Apart from this our team has access to various associations across the globe across different industries. Lastly, we have exchange relationships with various university as well as individual libraries.

Secondary Research

Step 2: Primary Research

When we talk about primary research, it is a type of study in which the researchers collect relevant data samples directly, rather than relying on previously collected data.  This type of research is focused on gaining content specific facts that can be sued to solve specific problems. Since the collected data is fresh and first hand therefore it makes the study more accurate and genuine.

We at SNS Insider have divided Primary Research into 2 parts.

Part 1 wherein we interview the KOLs of major players as well as the upcoming ones across various geographic regions. This allows us to have their view over the market scenario and acts as an important tool to come closer to the accurate market numbers. As many as 45 paid and unpaid primary interviews are taken from both the demand and supply side of the industry to make sure we land at an accurate judgement and analysis of the market.

This step involves the triangulation of data wherein our team analyses the interview transcripts, online survey responses and observation of on filed participants. The below mentioned chart should give a better understanding of the part 1 of the primary interview.

Primary Research

Part 2: In this part of primary research the data collected via secondary research and the part 1 of the primary research is validated with the interviews from individual consultants and subject matter experts.

Consultants are those set of people who have at least 12 years of experience and expertise within the industry whereas Subject Matter Experts are those with at least 15 years of experience behind their back within the same space. The data with the help of two main processes i.e., FGDs (Focused Group Discussions) and IDs (Individual Discussions). This gives us a 3rd party nonbiased primary view of the market scenario making it a more dependable one while collation of the data pointers.

Step 3: Data Bank Validation

Once all the information is collected via primary and secondary sources, we run that information for data validation. At our intelligence centre our research heads track a lot of information related to the market which includes the quarterly reports, the daily stock prices, and other relevant information. Our data bank server gets updated every fortnight and that is how the information which we collected using our primary and secondary information is revalidated in real time.

Data Bank Validation

Step 4: QA/QC Process

After all the data collection and validation our team does a final level of quality check and quality assurance to get rid of any unwanted or undesired mistakes. This might include but not limited to getting rid of the any typos, duplication of numbers or missing of any important information. The people involved in this process include technical content writers, research heads and graphics people. Once this process is completed the title gets uploader on our platform for our clients to read it.

Step 5: Final QC/QA Process:

This is the last process and comes when the client has ordered the study. In this process a final QA/QC is done before the study is emailed to the client. Since we believe in giving our clients a good experience of our research studies, therefore, to make sure that we do not lack at our end in any way humanly possible we do a final round of quality check and then dispatch the study to the client.

Key Segmentation

By Product

  • Engine

    • Engine Oil

    • Oil Filters

    • Cam Pulleys

    • Engine Mounts

  • Transmission

    • Belts

    • Gear Oil

    • Turbochargers

    • Pressure Plates

    • Throttle Cables

    • others

  • Fuel System

    • Fuel Injectors

    • Pumps

    • Plugs

    • Filters

  • Brake

    • Brake Oil

    • Brake Liners

    • Master Cylinders

    • Others

  • Body & Suspension

    • Sway Bars

    • Shock Absorbers

    • Suspension Bushes

  • Exhaust Mufflers

By Distribution Channel

  • Authorized Service Stations

  • Independent Service Stations

By Vehicle Type

  • Passenger Cars

  • LCVs

  • HCVs

Request for Segment Customization as per your Business Requirement: Segment Customization Request

REGIONAL COVERAGE:

North America

  • US

  • Canada

  • Mexico

Europe

  • Eastern Europe

    • Poland

    • Romania

    • Hungary

    • Turkey

    • Rest of Eastern Europe

  • Western Europe

    • Germany

    • France

    • UK

    • Italy

    • Spain

    • Netherlands

    • Switzerland

    • Austria

    • Rest of Western Europe

Asia Pacific

  • China

  • India

  • Japan

  • South Korea

  • Vietnam

  • Singapore

  • Australia

  • Rest of Asia Pacific

Middle East & Africa

  • Middle East

    • UAE

    • Egypt

    • Saudi Arabia

    • Qatar

    • Rest of the Middle East

  • Africa

    • Nigeria

    • South Africa

    • Rest of Africa

Latin America

  • Brazil

  • Argentina

  • Colombia

  • Rest of Latin America

Request for Country Level Research Report: Country Level Customization Request

Available Customization

With the given market data, SNS Insider offers customization as per the company’s specific needs. The following customization options are available for the report:

  • Product Analysis

  • Criss-Cross segment analysis (e.g. Product X Application)

  • Product Matrix which gives a detailed comparison of the product portfolio of each company

  • Geographic Analysis

  • Additional countries in any of the regions

  • Company Information

  • Detailed analysis and profiling of additional market players (Up to five)


  •            5000 (33% Discount)


  •            8950 (40% Discount)


  •            3050 (23% Discount)

Start a Conversation

Hi! Click one of our member below to chat on Phone