Route Optimization Software Market Report Scope & Overview:

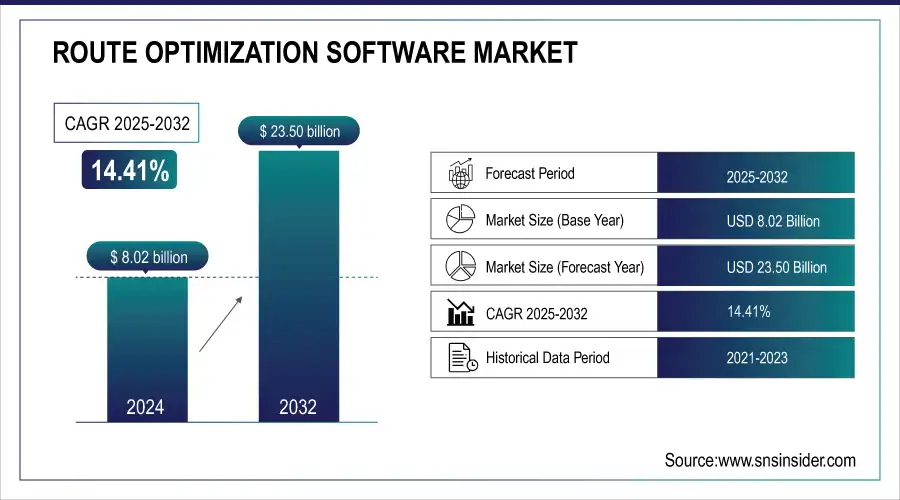
The Route Optimization Software Market Size was valued at USD 8.02 Billion in 2024 & will reach USD 23.50 Bn by 2032 & grow at a CAGR of 14.41% by 2025-2032

Route Optimization Software Market is becoming extremely promising with a growth rate as this software optimizes routes in real-time, reduces operation costs, helps ensure that delivery times are minimized along with respecting other factors such as traffic, weather, or road conditions. With the mounting pressures toward efficiency and also reduction of carbon footprint, route optimization software is now an important aspect in fleet management and supply chain operations. For instance NVIDIA's cuOpt real-time route-optimization software cracked records on an important route optimization benchmark, capturing new promise for faster deliveries worldwide. AT&T is using cuOpt to optimize the routes used by around 30,000 technicians. "With cuOpt, AT&T can find a solution 100x faster and update their dispatch in real-time," NVIDIA CEO said at the company's GTC technology conference 2024.

Route Optimization Software Market Revenue Analysis

Get More Information on Route Optimization Software Market - Request Sample Report

The policies of inducting advanced logistics technologies are on the rise in governments all over the world. For instance, in order to minimize the urban traffic congestion and emissions, smart city programs and policies are compelling companies to adopt ITS, including route optimization software. In addition, the policy and regulation, which is getting tighter on controlling emissions and fuel efficiency, will further support increased demand for route optimization solutions. The California Smog Check Program enforces requirements that California government agencies must follow. In an attempt to simplify the process, though, the BAR-run Continuous Testing Program (CTP) permits these agencies to send telematics data directly to BAR for verification with bypassing a physical smog check. Verizon Connect Reveal has been added to the list of approved telematics platforms of BAR under CTP.

The recent discoveries in the sectors of artificial intelligence, machine learning, and cloud computing have transformed the face of route optimization. AI-based routes now offer real-time predictive analytics that enable companies to plan for more efficient dynamic routes. Cloud-based solutions have democratized access to solving route optimization problems for small and medium enterprises (SMEs) who can now benefit from flexible, cost-effective solutions without massive up-front capital investments.

Route-Optimization-Software-Market-US

Key Route Optimization Software Market Trends:

• Rising global e-commerce drives increased adoption of route optimization software for efficient deliveries.
• Focus on reducing operational costs, including fuel expenditure, vehicle utilization, and delivery times.
• Growing consumer demand for faster, more accurate deliveries pushes companies to expand distribution and optimize routes.
• Volatile fuel prices encourage development of cost-effective, fuel-efficient routing solutions.
• Integration of real-time traffic, weather, and road data supports sustainability and green logistics initiatives.

Route Optimization Software Market Growth Drivers:

  • Growing e-commerce market is the most significant demand driver for best-in-class route optimization solutions.

As the scale of the global e-commerce market continues to grow, so companies operating in the logistics and last-mile delivery areas increasingly look to route optimization software to help their businesses run more efficiently. Efficient routes result in timely deliveries as well as reduced operational costs in terms of optimum fuel expenditure, better vehicle utilization, and faster deliveries. The increase in online shopping has increased competition between delivery services, and thus, route optimization becomes a crucial activity to sustain customer satisfaction. Furthermore, demand by consumers to have faster and more accurate delivery forces companies to extend their distribution practices to build the maximum fit onto the needs, which increases the use of applications of route optimization also.

  • Growing fuel prices add pressure toward development to make less costly routes.

One of the significant challenges posed by fuel prices is the volatile nature of such prices. This significantly affects the operational costs in transportation companies. Route Optimization Software addresses this challenge by assisting these organizations in planning routes that utilize minimal amounts of fuel. These systems also consider real-time traffic conditions, current weather, and road restrictions to reduce unnecessary mileage. Because fuel expense is the major part of logistics cost, direct savings are the consequences of route optimization and aid in sustainability efforts that reduce carbon footprints and support green initiatives. Such factors towards cost savings and environmental sustainability push forward route optimization solutions for the majority.

For instance, ORTEC is a leading provider of best-of-breed, end-to-end solutions for supply chains designed specifically for the needs of manufacturers, retailers, and distributors. Recently, it launched an innovative solution with the aim of directly tackling the operational needs of the manufacturing and finished goods logistics industries. The ORTEC Manufacturing Solution Suite provides companies with beneficial and planning tools for improving their supply chain while maximizing cost-cutting prospects.

Route Optimization Software Market Restraints:

  • Inability of the new software to integrate with the current systems.

Probably the biggest challenge in the route optimization software market is in the integration of new systems. Most logistics and transport companies already have very traditional legacy systems, some of which they have been using for years. In most cases, these companies find it very difficult to seamlessly integrate new technologies, which are usually such novel concepts like route optimization software. These legacy systems do not have a great degree of flexibility and are not compatible with any higher level of integration. This can be an expensive proposition in terms of time also. Companies end up spending money on in-house customized solutions or system upgrades, which is very costly for small and medium enterprises. They also need to train the workforce on how to effectively use new software; this adds to the costs also. This complexity of integration proves a challenge, especially for organizations that are unwilling to create change in the infrastructure they possess. The consequent reluctance to embrace route optimization solutions, quite often reflects in slow market growth, especially within markets dominated by intense legacy system presence.

Route Optimization Software Market Segment Analysis:

By Solutuion

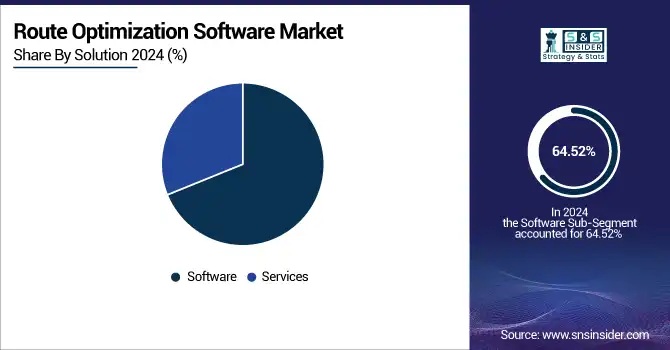
In 2024, software had a market share of 64.52% - primarily because this segment was in most demand by large enterprises to find strong, real-time optimization tools. Such solutions facilitate flexible routes planning, real-time tracking, and traffic monitoring, thus being necessary for logistics operations.

Services are expected to be grown at the fastest rate with a CAGR of 14.9% during 2025 to 2032. With companies increasingly adopting such solution, the demand for services on consulting, software deployment and support also increases. Consulting service is very vital as it will help them customize the software to their needs. Support and maintenance also ensure smooth integration and continued system functionality. The growth of services stands testament to the need for increasing the complexity of route optimization hence the requirement for specific professional know-how.

Route-Optimization-Software-Market-By-Solution

By Enterprice Size

Large enterprises have a lead in the market share in the year 2024 with 65.30%. Organizations need scalable solutions to accommodate the complexity of logistics operations that could involve large fleets and cross-border deliveries. For large companies with sufficient resources, it is possible for integration of complex features, such as AI-based route prediction, in the full route optimization software so they can be a market growth contributor.

SMEs are likely to exhibit a very high growth rate during the review period with a CAGR of 14.9% from 2025 to 2032. Increasing demand for cost-efficient solutions and operational efficiency is one of the leading factors driving the adoption of cloud route optimization software among SMEs. The company allows SMEs to benefit from flexible pricing models and scalable features that can make it easier to streamline their logistic operations without high upfront costs. With SMEs digitalizing more and more, it is expected to contribute to the growth of the market.

Route Optimization Software Market Regional Analysis:

North America Route Optimization Software Market Insights

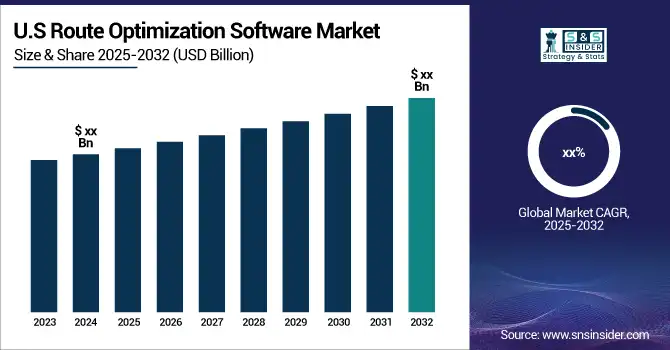
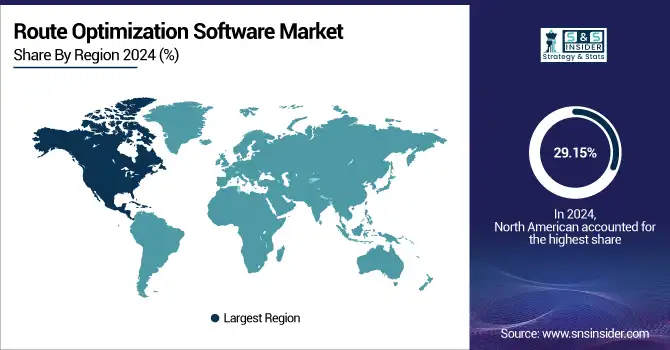
North America ruled the Route Optimization Software Market in 2024. The share of the region in the market is 29.15%. Well-set logistics networks, sophisticated technological infrastructure, and early adoption of route optimization solutions across sectors such as e-commerce, manufacturing, and retail have placed the region in a dominant position compared to other regions.

Route-Optimization-Software-Market-By-Region

Need any customization research on Route Optimization Software Market - Enquiry Now

Asia Pacific Route Optimization Software Market Insights

Asia Pacific is the expected fastest-growing region with a CAGR of 16.4% in the forecast period from 2025 to 2032. The high growth rate in e-commerce and investments in logistics infrastructure in countries such as China and India, leading to increased demand for route optimization solutions in the region, supports this aspect. The shift towards digital transformation and increasing need for real-time delivery tracking and efficient management of logistics has accelerated the momentum in the region's growth.

Europe Route Optimization Software Market Insights

Europe's route optimization software market is experiencing robust growth, driven by the expansion of e-commerce and the increasing demand for efficient logistics solutions. Companies are adopting advanced technologies to streamline operations, reduce costs, and enhance customer satisfaction. The region's focus on sustainability and regulatory compliance further accelerates the adoption of these solutions.

Latin America (LATAM) and Middle East & Africa (MEA) Route Optimization Software Market Insights

In Latin America, the route optimization software market is gaining momentum due to the rapid growth of e-commerce and the need for efficient delivery systems. Businesses are investing in technology to improve logistics operations, reduce delivery times, and meet customer expectations. The region's urbanization and infrastructure development also contribute to the market's expansion.The MEA region is witnessing significant growth in the route optimization software market, fueled by the rise in e-commerce and the demand for efficient logistics solutions. Companies are leveraging technology to optimize delivery routes, reduce costs, and enhance customer satisfaction. Infrastructure development and urbanization in key countries further drive market growth

Route Optimization Software Market Key Players:

Some of the Route Optimization Software Market Companies are

  • Verizon Connect (Fleet Management, Route Planning)

  • Omnitracs (Route Optimization, Transportation Management)

  • Trimble Inc. (Transportation Solutions, Asset Management)

  • Paragon Software Systems (Routing Software, Fleet Optimization)

  • ORTEC (Logistics Optimization, Workforce Scheduling)

  • Descartes Systems Group (Fleet Tracking, Routing Solutions)

  • MercuryGate (Transportation Management, Route Planning)

  • Samsara (Real-Time GPS Tracking, Fleet Management)

  • WorkWave (Field Service Management, Route Optimization)

  • Route4Me (Route Planning, Route Sequencing)

  • PTV Group (Logistics Software, Route Optimization)

  • Geotab (Telematics, Fleet Management)

  • Routific (Delivery Route Planning, Optimization Software)

  • Informatica (Data Integration, Route Optimization)

  • Oracle Corporation (Cloud Logistics, Route Planning)

  • Manhattan Associates (Warehouse Management, Route Optimization)

  • SAP SE (Supply Chain Management, Route Optimization)

  • LogiNext (Last-Mile Delivery, Route Planning)

  • Llamasoft (Supply Chain Analytics, Route Optimization)

  • OptimoRoute (Route Optimization, Fleet Planning)

RECENT DEVELOPMENTS:

Verizon Connect is a leading provider of fleet management and route optimization solutions, serving industries such as transportation, logistics, field services, and utilities. Their platform leverages GPS tracking, telematics, and AI-powered analytics to enhance operational efficiency, reduce fuel costs, and improve customer service. The company's RouteCloud API enables dynamic, multi-stop route planning, considering variables like vehicle capacity, certifications, and traffic conditions. Recognized as a leader in commercial telematics by ABI Research, Verizon Connect continues to innovate in the route optimization software market

  • August 2024: Verizon Connect Strengthens the Safety and Efficiency of Fleets through Vehicle Emissions Management with Latest Enhancements Verizon Connect has further asserted its leadership in fleet management solutions with a commitment to arming fleet operators with technologies essential to effectively manage vehicle emissions. Improvements have been designed to help fleets streamline compliance to environmental regulations, reduce downtime and contribute to sustainability goals.

Körber Supply Chain, now operating under the brand Infios, is a global leader in supply chain software solutions. Born from the integration of Körber Supply Chain Software and MercuryGate, Infios offers end-to-end logistics solutions encompassing transportation management, warehouse automation, labor management, and supply chain visibility. The company serves a diverse range of industries, including manufacturing, retail, and healthcare, providing scalable cloud and on-premise deployment options. With a strong emphasis on innovation, Infios leverages AI and machine learning to optimize supply chain operations, aiming to enhance efficiency and reduce costs for its clients.

  • Aug 2024: Körber Supply Chain Software, the product of the joint venture between Körber AG and global end-to-end leader in supply chain software solutions, KKR, has executed a definitive agreement to purchase MercuryGate International Inc., one of the world's most respected providers of transportation management systems.

Route Optimization Software Market Report Scope:

Report Attributes Details
Market Size in 2024 USD 8.02 Billion
Market Size by 2032 USD 23.50 Billion
CAGR CAGR of 14.41% From 2024 to 2032
Base Year 2024
Forecast Period 2025-2032
Historical Data 2021-2023
Report Scope & Coverage Market Size, Segments Analysis, Competitive Landscape, Regional Analysis, DROC & SWOT Analysis, Forecast Outlook
Key Segments • By Solution (Software, Services (Consulting, Map Integration & Software Deployment, Support & Maintenance))
• By Deployment (On premise, Cloud)
• BY Enterprise Size (Large Enterprises, Small & Medium Size)
• By Industry Vertical (Retail & FMCG, On-Demand Food & Grocery Delivery, Ride Hailing & Taxi Services, Homecare & Field Services, Logistics & Transportation, Others)
• By Functionality (Out Bound, In Bound)
Regional Analysis/Coverage North America (US, Canada), Europe (Germany, UK, France, Italy, Spain, Russia, Poland, Rest of Europe), Asia Pacific (China, India, Japan, South Korea, Australia, ASEAN Countries, Rest of Asia Pacific), Middle East & Africa (UAE, Saudi Arabia, Qatar, South Africa, Rest of Middle East & Africa), Latin America (Brazil, Argentina, Mexico, Colombia, Rest of Latin America).
Company Profiles Verizon Connect, Omnitracs, Trimble Inc., Paragon Software Systems, ORTEC, Descartes Systems Group, MercuryGate, Samsara, WorkWave, Route4Me, PTV Group, Geotab, Routific, Informatica, Oracle Corporation, Manhattan Associates, SAP SE, LogiNext, Llamasoft, OptimoRoute.

Table Of Contents

1. Introduction

1.1 Market Definition & Scope

 1.2 Research Assumptions & Abbreviations

 1.3 Research Methodology

2. Executive Summary

2.1 Market Snapshot

 2.2 Market Absolute $ Opportunity Assessment & Y-o-Y Analysis, 2021–2032

 2.3 Market Size & Forecast, By Segmentation, 2021–2032

  2.3.1 Market Size By Solution

  2.3.2 Market Size By Deployment

         2.3.2 Market Size By Enterprise Size

         2.3.2 Market Size By Industry Vertical

         2.3.2 Market Size By Functionality

 2.4 Market Share & BPS Analysis By Region, 2024

 2.5 Industry Growth Scenarios – Conservative, Likely & Optimistic

 2.6 Industry CxO’s Perspective

3. Market Overview

3.1 Market Dynamics

  3.1.1 Drivers

  3.1.2 Restraints

  3.1.3 Opportunities

  3.1.4 Key Market Trends

 3.2 Industry PESTLE Analysis

 3.3 Key Industry Forces (Porter’s) Impacting Market Growth

 3.4 Industry Supply Chain Analysis

  3.4.1 Raw Material Suppliers

  3.4.2 Manufacturers

  3.4.3 Distributors/Suppliers

  3.4.4 Customers/End-Users

 3.5 Industry Life Cycle Assessment

 3.6 Parent Market Overview

 3.7 Market Risk Assessment

4. Statistical Insights & Trends Reporting

4.1 Driver & Fleet Utilization Metrics

4.1.1 Average reduction in driver idle time (%) with optimized routes

4.1.2 Improvement in fleet utilization rate (%) across industries

4.1.3 Percentage reduction in overtime hours and driver fatigue incidents

4.2 Customer Experience & Service Metrics

4.2.1 Average reduction in delivery time windows (minutes/hours) for end customers

4.2.2 On-time delivery compliance rate (%) after software adoption

4.2.3 Customer satisfaction/Net Promoter Score (NPS) improvement (%) linked to faster deliveries

4.3 Scalability & Network Expansion Metrics

4.3.1 Average number of routes handled per software deployment (small fleets vs. enterprise fleets)

4.3.2 Share of deployments supporting multi-modal logistics (road, air, rail, maritime) (%)

4.3.3 Year-on-year growth (%) in cross-border and international route optimization deployments

4.4 Risk Management & Compliance Metrics

4.4.1 Reduction in traffic violations or route-related compliance breaches (%)

4.4.2 Average reduction in accident rates (%) due to optimized and safer routing

4.4.3 Share of companies integrating route optimization to meet sustainability and regulatory standards (%)

5. Route Optimization Software Market Segmental Analysis & Forecast, By Solution, 2021 – 2032, Value (USD Billion)

5.1 Introduction

 5.2 Software

  5.2.1 Key Trends

  5.2.2 Market Size & Forecast, 2021 – 2032

 5.3 Services

  5.3.1 Key Trends

  5.3.2 Market Size & Forecast, 2021 – 2032

6. Route Optimization Software Market Segmental Analysis & Forecast, By Deployment, 2021 – 2032, Value (USD Billion)

    6.1 Introduction

 6.2 On premise

  6.2.1 Key Trends

  6.2.2 Market Size & Forecast, 2021 – 2032

 6.3 Cloud

  6.3.1 Key Trends

  6.3.2 Market Size & Forecast, 2021 – 2032

7. Route Optimization Software Market Segmental Analysis & Forecast, By Enterprise Size, 2021 – 2032, Value (USD Billion)

    7.1 Introduction

 7.2 Large Enterprises

  7.2.1 Key Trends

  7.2.2 Market Size & Forecast, 2021 – 2032

 7.3 Small & Medium Size

  7.3.1 Key Trends

  7.3.2 Market Size & Forecast, 2021 – 2032

8. Route Optimization Software Market Segmental Analysis & Forecast, By Industry Vertical, 2021 – 2032, Value (USD Billion)

    8.1 Introduction

 8.2 Retail & FMCG

  8.2.1 Key Trends

  8.2.2 Market Size & Forecast, 2021 – 2032

 8.3 On-Demand Food & Grocery Delivery

  8.3.1 Key Trends

  8.3.2 Market Size & Forecast, 2021 – 2032

 8.4 Ride Hailing & Taxi Services

  8.4.1 Key Trends

  8.4.2 Market Size & Forecast, 2021 – 2032

 8.5 Homecare & Field Services

  8.5.1 Key Trends

  8.5.2 Market Size & Forecast, 2021 – 2032

 8.6 Logistics & Transportation

  8.6.1 Key Trends

  8.6.2 Market Size & Forecast, 2021 – 2032

 8.7 Others

  8.7.1 Key Trends

  8.7.2 Market Size & Forecast, 2021 – 2032

9. Route Optimization Software Market Segmental Analysis & Forecast, By Functionality, 2021 – 2032, Value (USD Billion)

    9.1 Introduction 

  9.2 Out Bound

   9.2.1 Key Trends 

   9.2.2 Market Size & Forecast, 2021 – 2032 

  9.3 In Bound

   9.3.1 Key Trends 

   9.3.2 Market Size & Forecast, 2021 – 2032   

10. Route Optimization Software Market Segmental Analysis & Forecast By Region, 2021 – 2032, Value (USD Billion)

 10.1 Introduction

 10.2 North America

  10.2.1 Key Trends

  10.2.2 Route Optimization Software Market Size & Forecast, By Solution, 2021 – 2032

  10.2.3 Route Optimization Software Market Size & Forecast, By Deployment, 2021 – 2032

  10.2.4 Route Optimization Software Market Size & Forecast, By Enterprise Size, 2021 – 2032

  10.2.5 Route Optimization Software Market Size & Forecast, By Industry Vertical, 2021 – 2032

  10.2.6 Route Optimization Software Market Size & Forecast, By Functionality, 2021 – 2032

  10.2.7 Route Optimization Software Market Size & Forecast, By Country, 2021 – 2032

   10.2.7.1 USA

    10.2.7.1.1 Route Optimization Software Market Size & Forecast, By Solution, 2021 – 2032

    10.2.7.1.2 Route Optimization Software Market Size & Forecast, By Deployment, 2021 – 2032

    10.2.7.1.3 Route Optimization Software Market Size & Forecast, By Enterprise Size, 2021 – 2032

    10.2.7.1.4 Route Optimization Software Market Size & Forecast, By Industry Vertical, 2021 – 2032

    10.2.7.1.5 Route Optimization Software Market Size & Forecast, By Functionality, 2021 – 2032

   10.2.7.2 Canada

    10.2.7.2.1 Route Optimization Software Market Size & Forecast, By Solution, 2021 – 2032

    10.2.7.2.2 Route Optimization Software Market Size & Forecast, By Deployment, 2021 – 2032

    10.2.7.2.3 Route Optimization Software Market Size & Forecast, By Enterprise Size, 2021 – 2032

    10.2.7.2.4 Route Optimization Software Market Size & Forecast, By Industry Vertical, 2021 – 2032

    10.2.7.2.5 Route Optimization Software Market Size & Forecast, By Functionality, 2021 – 2032

10.3 Europe

 10.3.1 Key Trends

 10.3.2 Route Optimization Software Market Size & Forecast, By Solution, 2021 – 2032

 10.3.3 Route Optimization Software Market Size & Forecast, By Deployment, 2021 – 2032

 10.3.4 Route Optimization Software Market Size & Forecast, By Enterprise Size, 2021 – 2032

 10.3.5 Route Optimization Software Market Size & Forecast, By Industry Vertical, 2021 – 2032

 10.3.6 Route Optimization Software Market Size & Forecast, By Functionality, 2021 – 2032

 10.3.7 Route Optimization Software Market Size & Forecast, By Country, 2021 – 2032

  10.3.7.1 Germany

   10.3.7.1.1 Route Optimization Software Market Size & Forecast, By Solution, 2021 – 2032

   10.3.7.1.2 Route Optimization Software Market Size & Forecast, By Deployment, 2021 – 2032

   10.3.7.1.3 Route Optimization Software Market Size & Forecast, By Enterprise Size, 2021 – 2032

   10.3.7.1.4 Route Optimization Software Market Size & Forecast, By Industry Vertical, 2021 – 2032

   10.3.7.1.5 Route Optimization Software Market Size & Forecast, By Functionality, 2021 – 2032

  10.3.7.2 UK

   10.3.7.2.1 Route Optimization Software Market Size & Forecast, By Solution, 2021 – 2032

   10.3.7.2.2 Route Optimization Software Market Size & Forecast, By Deployment, 2021 – 2032

   10.3.7.2.3 Route Optimization Software Market Size & Forecast, By Enterprise Size, 2021 – 2032

   10.3.7.2.4 Route Optimization Software Market Size & Forecast, By Industry Vertical, 2021 – 2032

   10.3.7.2.5 Route Optimization Software Market Size & Forecast, By Functionality, 2021 – 2032

  10.3.7.3 France

   10.3.7.3.1 Route Optimization Software Market Size & Forecast, By Solution, 2021 – 2032

   10.3.7.3.2 Route Optimization Software Market Size & Forecast, By Deployment, 2021 – 2032

   10.3.7.3.3 Route Optimization Software Market Size & Forecast, By Enterprise Size, 2021 – 2032

   10.3.7.3.4 Route Optimization Software Market Size & Forecast, By Industry Vertical, 2021 – 2032

   10.3.7.3.5 Route Optimization Software Market Size & Forecast, By Functionality, 2021 – 2032

  10.3.7.4 Italy

   10.3.7.4.1 Route Optimization Software Market Size & Forecast, By Solution, 2021 – 2032

   10.3.7.4.2 Route Optimization Software Market Size & Forecast, By Deployment, 2021 – 2032

   10.3.7.4.3 Route Optimization Software Market Size & Forecast, By Enterprise Size, 2021 – 2032

   10.3.7.4.4 Route Optimization Software Market Size & Forecast, By Industry Vertical, 2021 – 2032

   10.3.7.4.5 Route Optimization Software Market Size & Forecast, By Functionality, 2021 – 2032

  10.3.7.5 Spain

   10.3.7.5.1 Route Optimization Software Market Size & Forecast, By Solution, 2021 – 2032

   10.3.7.5.2 Route Optimization Software Market Size & Forecast, By Deployment, 2021 – 2032

   10.3.7.5.3 Route Optimization Software Market Size & Forecast, By Enterprise Size, 2021 – 2032

   10.3.7.5.4 Route Optimization Software Market Size & Forecast, By Industry Vertical, 2021 – 2032

   10.3.7.5.5 Route Optimization Software Market Size & Forecast, By Functionality, 2021 – 2032

  10.3.7.6 Russia

   10.3.7.6.1 Route Optimization Software Market Size & Forecast, By Solution, 2021 – 2032

   10.3.7.6.2 Route Optimization Software Market Size & Forecast, By Deployment, 2021 – 2032

   10.3.7.6.3 Route Optimization Software Market Size & Forecast, By Enterprise Size, 2021 – 2032

   10.3.7.6.4 Route Optimization Software Market Size & Forecast, By Industry Vertical, 2021 – 2032

   10.3.7.6.5 Route Optimization Software Market Size & Forecast, By Functionality, 2021 – 2032

  10.3.7.7 Poland

   10.3.7.7.1 Route Optimization Software Market Size & Forecast, By Solution, 2021 – 2032

   10.3.7.7.2 Route Optimization Software Market Size & Forecast, By Deployment, 2021 – 2032

   10.3.7.7.3 Route Optimization Software Market Size & Forecast, By Enterprise Size, 2021 – 2032

   10.3.7.7.4 Route Optimization Software Market Size & Forecast, By Industry Vertical, 2021 – 2032

   10.3.7.7.5 Route Optimization Software Market Size & Forecast, By Functionality, 2021 – 2032

  10.3.7.8 Rest of Europe

   10.3.7.8.1 Route Optimization Software Market Size & Forecast, By Solution, 2021 – 2032

   10.3.7.8.2 Route Optimization Software Market Size & Forecast, By Deployment, 2021 – 2032

   10.3.7.8.3 Route Optimization Software Market Size & Forecast, By Enterprise Size, 2021 – 2032

   10.3.7.8.4 Route Optimization Software Market Size & Forecast, By Industry Vertical, 2021 – 2032

   10.3.7.8.5 Route Optimization Software Market Size & Forecast, By Functionality, 2021 – 2032

10.4 Asia-Pacific

 10.4.1 Key Trends

 10.4.2 Route Optimization Software Market Size & Forecast, By Solution, 2021 – 2032

 10.4.3 Route Optimization Software Market Size & Forecast, By Deployment, 2021 – 2032

 10.4.4 Route Optimization Software Market Size & Forecast, By Enterprise Size, 2021 – 2032

 10.4.5 Route Optimization Software Market Size & Forecast, By Industry Vertical, 2021 – 2032

 10.4.6 Route Optimization Software Market Size & Forecast, By Functionality, 2021 – 2032

 10.4.7 Route Optimization Software Market Size & Forecast, By Country, 2021 – 2032

  10.4.7.1 China

   10.4.7.1.1 Route Optimization Software Market Size & Forecast, By Solution, 2021 – 2032

   10.4.7.1.2 Route Optimization Software Market Size & Forecast, By Deployment, 2021 – 2032

   10.4.7.1.3 Route Optimization Software Market Size & Forecast, By Enterprise Size, 2021 – 2032

   10.4.7.1.4 Route Optimization Software Market Size & Forecast, By Industry Vertical, 2021 – 2032

   10.4.7.1.5 Route Optimization Software Market Size & Forecast, By Functionality, 2021 – 2032

  10.4.7.2 India

   10.4.7.2.1 Route Optimization Software Market Size & Forecast, By Solution, 2021 – 2032

   10.4.7.2.2 Route Optimization Software Market Size & Forecast, By Deployment, 2021 – 2032

   10.4.7.2.3 Route Optimization Software Market Size & Forecast, By Enterprise Size, 2021 – 2032

   10.4.7.2.4 Route Optimization Software Market Size & Forecast, By Industry Vertical, 2021 – 2032

   10.4.7.2.5 Route Optimization Software Market Size & Forecast, By Functionality, 2021 – 2032

  10.4.7.3 Japan

   10.4.7.3.1 Route Optimization Software Market Size & Forecast, By Solution, 2021 – 2032

   10.4.7.3.2 Route Optimization Software Market Size & Forecast, By Deployment, 2021 – 2032

   10.4.7.3.3 Route Optimization Software Market Size & Forecast, By Enterprise Size, 2021 – 2032

   10.4.7.3.4 Route Optimization Software Market Size & Forecast, By Industry Vertical, 2021 – 2032

   10.4.7.3.5 Route Optimization Software Market Size & Forecast, By Functionality, 2021 – 2032

  10.4.7.4 South Korea

   10.4.7.4.1 Route Optimization Software Market Size & Forecast, By Solution, 2021 – 2032

   10.4.7.4.2 Route Optimization Software Market Size & Forecast, By Deployment, 2021 – 2032

   10.4.7.4.3 Route Optimization Software Market Size & Forecast, By Enterprise Size, 2021 – 2032

   10.4.7.4.4 Route Optimization Software Market Size & Forecast, By Industry Vertical, 2021 – 2032

   10.4.7.4.5 Route Optimization Software Market Size & Forecast, By Functionality, 2021 – 2032

  10.4.7.5 Australia

   10.4.7.5.1 Route Optimization Software Market Size & Forecast, By Solution, 2021 – 2032

   10.4.7.5.2 Route Optimization Software Market Size & Forecast, By Deployment, 2021 – 2032

   10.4.7.5.3 Route Optimization Software Market Size & Forecast, By Enterprise Size, 2021 – 2032

   10.4.7.5.4 Route Optimization Software Market Size & Forecast, By Industry Vertical, 2021 – 2032

   10.4.7.5.5 Route Optimization Software Market Size & Forecast, By Functionality, 2021 – 2032

  10.4.7.6 ASEAN Countries

   10.4.7.6.1 Route Optimization Software Market Size & Forecast, By Solution, 2021 – 2032

   10.4.7.6.2 Route Optimization Software Market Size & Forecast, By Deployment, 2021 – 2032

   10.4.7.6.3 Route Optimization Software Market Size & Forecast, By Enterprise Size, 2021 – 2032

   10.4.7.6.4 Route Optimization Software Market Size & Forecast, By Industry Vertical, 2021 – 2032

   10.4.7.6.5 Route Optimization Software Market Size & Forecast, By Functionality, 2021 – 2032

  10.4.7.7 Rest of Asia-Pacific

   10.4.7.7.1 Route Optimization Software Market Size & Forecast, By Solution, 2021 – 2032

   10.4.7.7.2 Route Optimization Software Market Size & Forecast, By Deployment, 2021 – 2032

   10.4.7.7.3 Route Optimization Software Market Size & Forecast, By Enterprise Size, 2021 – 2032

   10.4.7.7.4 Route Optimization Software Market Size & Forecast, By Industry Vertical, 2021 – 2032

   10.4.7.7.5 Route Optimization Software Market Size & Forecast, By Functionality, 2021 – 2032

10.5 Latin America

 10.5.1 Key Trends

 10.5.2 Route Optimization Software Market Size & Forecast, By Solution, 2021 – 2032

 10.5.3 Route Optimization Software Market Size & Forecast, By Deployment, 2021 – 2032

 10.5.4 Route Optimization Software Market Size & Forecast, By Enterprise Size, 2021 – 2032

 10.5.5 Route Optimization Software Market Size & Forecast, By Industry Vertical, 2021 – 2032

 10.5.6 Route Optimization Software Market Size & Forecast, By Functionality, 2021 – 2032

 10.5.7 Route Optimization Software Market Size & Forecast, By Country, 2021 – 2032

  10.5.7.1 Brazil

   10.5.7.1.1 Route Optimization Software Market Size & Forecast, By Solution, 2021 – 2032

   10.5.7.1.2 Route Optimization Software Market Size & Forecast, By Deployment, 2021 – 2032

   10.5.7.1.3 Route Optimization Software Market Size & Forecast, By Enterprise Size, 2021 – 2032

   10.5.7.1.4 Route Optimization Software Market Size & Forecast, By Industry Vertical, 2021 – 2032

   10.5.7.1.5 Route Optimization Software Market Size & Forecast, By Functionality, 2021 – 2032

  10.5.7.2 Argentina

   10.5.7.2.1 Route Optimization Software Market Size & Forecast, By Solution, 2021 – 2032

   10.5.7.2.2 Route Optimization Software Market Size & Forecast, By Deployment, 2021 – 2032

   10.5.7.2.3 Route Optimization Software Market Size & Forecast, By Enterprise Size, 2021 – 2032

   10.5.7.2.4 Route Optimization Software Market Size & Forecast, By Industry Vertical, 2021 – 2032

   10.5.7.2.5 Route Optimization Software Market Size & Forecast, By Functionality, 2021 – 2032

  10.5.7.3 Mexico

   10.5.7.3.1 Route Optimization Software Market Size & Forecast, By Solution, 2021 – 2032

   10.5.7.3.2 Route Optimization Software Market Size & Forecast, By Deployment, 2021 – 2032

   10.5.7.3.3 Route Optimization Software Market Size & Forecast, By Enterprise Size, 2021 – 2032

   10.5.7.3.4 Route Optimization Software Market Size & Forecast, By Industry Vertical, 2021 – 2032

   10.5.7.3.5 Route Optimization Software Market Size & Forecast, By Functionality, 2021 – 2032

  10.5.7.4 Colombia

   10.5.7.4.1 Route Optimization Software Market Size & Forecast, By Solution, 2021 – 2032

   10.5.7.4.2 Route Optimization Software Market Size & Forecast, By Deployment, 2021 – 2032

   10.5.7.4.3 Route Optimization Software Market Size & Forecast, By Enterprise Size, 2021 – 2032

   10.5.7.4.4 Route Optimization Software Market Size & Forecast, By Industry Vertical, 2021 – 2032

   10.5.7.4.5 Route Optimization Software Market Size & Forecast, By Functionality, 2021 – 2032

  10.5.7.5 Rest of Latin America

   10.5.7.5.1 Route Optimization Software Market Size & Forecast, By Solution, 2021 – 2032

   10.5.7.5.2 Route Optimization Software Market Size & Forecast, By Deployment, 2021 – 2032

   10.5.7.5.3 Route Optimization Software Market Size & Forecast, By Enterprise Size, 2021 – 2032

   10.5.7.5.4 Route Optimization Software Market Size & Forecast, By Industry Vertical, 2021 – 2032

   10.5.7.5.5 Route Optimization Software Market Size & Forecast, By Functionality, 2021 – 2032

10.6 Middle East & Africa

 10.6.1 Key Trends

 10.6.2 Route Optimization Software Market Size & Forecast, By Solution, 2021 – 2032

 10.6.3 Route Optimization Software Market Size & Forecast, By Deployment, 2021 – 2032

 10.6.4 Route Optimization Software Market Size & Forecast, By Enterprise Size, 2021 – 2032

 10.6.5 Route Optimization Software Market Size & Forecast, By Industry Vertical, 2021 – 2032

 10.6.6 Route Optimization Software Market Size & Forecast, By Functionality, 2021 – 2032

 10.6.7 Route Optimization Software Market Size & Forecast, By Country, 2021 – 2032

  10.6.7.1 UAE

   10.6.7.1.1 Route Optimization Software Market Size & Forecast, By Solution, 2021 – 2032

   10.6.7.1.2 Route Optimization Software Market Size & Forecast, By Deployment, 2021 – 2032

   10.6.7.1.3 Route Optimization Software Market Size & Forecast, By Enterprise Size, 2021 – 2032

   10.6.7.1.4 Route Optimization Software Market Size & Forecast, By Industry Vertical, 2021 – 2032

   10.6.7.1.5 Route Optimization Software Market Size & Forecast, By Functionality, 2021 – 2032

  10.6.7.2 Saudi Arabia

   10.6.7.2.1 Route Optimization Software Market Size & Forecast, By Solution, 2021 – 2032

   10.6.7.2.2 Route Optimization Software Market Size & Forecast, By Deployment, 2021 – 2032

   10.6.7.2.3 Route Optimization Software Market Size & Forecast, By Enterprise Size, 2021 – 2032

   10.6.7.2.4 Route Optimization Software Market Size & Forecast, By Industry Vertical, 2021 – 2032

   10.6.7.2.5 Route Optimization Software Market Size & Forecast, By Functionality, 2021 – 2032

  10.6.7.3 Qatar

   10.6.7.3.1 Route Optimization Software Market Size & Forecast, By Solution, 2021 – 2032

   10.6.7.3.2 Route Optimization Software Market Size & Forecast, By Deployment, 2021 – 2032

   10.6.7.3.3 Route Optimization Software Market Size & Forecast, By Enterprise Size, 2021 – 2032

   10.6.7.3.4 Route Optimization Software Market Size & Forecast, By Industry Vertical, 2021 – 2032

   10.6.7.3.5 Route Optimization Software Market Size & Forecast, By Functionality, 2021 – 2032

  10.6.7.4 Egypt

   10.6.7.4.1 Route Optimization Software Market Size & Forecast, By Solution, 2021 – 2032

   10.6.7.4.2 Route Optimization Software Market Size & Forecast, By Deployment, 2021 – 2032

   10.6.7.4.3 Route Optimization Software Market Size & Forecast, By Enterprise Size, 2021 – 2032

   10.6.7.4.4 Route Optimization Software Market Size & Forecast, By Industry Vertical, 2021 – 2032

   10.6.7.4.5 Route Optimization Software Market Size & Forecast, By Functionality, 2021 – 2032

  10.6.7.5 South Africa

   10.6.7.5.1 Route Optimization Software Market Size & Forecast, By Solution, 2021 – 2032

   10.6.7.5.2 Route Optimization Software Market Size & Forecast, By Deployment, 2021 – 2032

   10.6.7.5.3 Route Optimization Software Market Size & Forecast, By Enterprise Size, 2021 – 2032

   10.6.7.5.4 Route Optimization Software Market Size & Forecast, By Industry Vertical, 2021 – 2032

   10.6.7.5.5 Route Optimization Software Market Size & Forecast, By Functionality, 2021 – 2032

  10.6.7.6 Rest of Middle East & Africa

   10.6.7.6.1 Route Optimization Software Market Size & Forecast, By Solution, 2021 – 2032

   10.6.7.6.2 Route Optimization Software Market Size & Forecast, By Deployment, 2021 – 2032

   10.6.7.6.3 Route Optimization Software Market Size & Forecast, By Enterprise Size, 2021 – 2032

   10.6.7.6.4 Route Optimization Software Market Size & Forecast, By Industry Vertical, 2021 – 2032

   10.6.7.6.5 Route Optimization Software Market Size & Forecast, By Functionality, 2021 – 2032

11. Competitive Landscape

 11.1 Key Players' Positioning

 11.2 Competitive Developments

  11.2.1 Key Strategies Adopted (%), By Key Players, 2024

  11.2.2 Year-Wise Strategies & Development, 2021 – 2025

  11.2.3 Number Of Strategies Adopted By Key Players, 2024

 11.3 Market Share Analysis, 2024

 11.4 Product/Service & Application Benchmarking

  11.4.1 Product/Service Specifications & Features By Key Players

  11.4.2 Product/Service Heatmap By Key Players

  11.4.3 Application Heatmap By Key Players

 11.5 Industry Start-Up & Innovation Landscape

 11.6 Key Company Profiles

11.6 Key Company Profiles

 11.6.1 Verizon Connect.

  11.6.1.1 Company Overview & Snapshot

  11.6.1.2 Product/Service Portfolio

  11.6.1.3 Key Company Financials

  11.6.1.4 SWOT Analysis

 11.6.2 Omnitracs

  11.6.2.1 Company Overview & Snapshot

  11.6.2.2 Product/Service Portfolio

  11.6.2.3 Key Company Financials

  11.6.2.4 SWOT Analysis

 11.6.3 Trimble Inc.

  11.6.3.1 Company Overview & Snapshot

  11.6.3.2 Product/Service Portfolio

  11.6.3.3 Key Company Financials

  11.6.3.4 SWOT Analysis

 11.6.4 Paragon Software Systems

  11.6.4.1 Company Overview & Snapshot

  11.6.4.2 Product/Service Portfolio

  11.6.4.3 Key Company Financials

  11.6.4.4 SWOT Analysis

 11.6.5 ORTEC

  11.6.5.1 Company Overview & Snapshot

  11.6.5.2 Product/Service Portfolio

  11.6.5.3 Key Company Financials

  11.6.5.4 SWOT Analysis

 11.6.6 Descartes Systems Group

  11.6.6.1 Company Overview & Snapshot

  11.6.6.2 Product/Service Portfolio

  11.6.6.3 Key Company Financials

  11.6.6.4 SWOT Analysis

 11.6.7 MercuryGate.

  11.6.7.1 Company Overview & Snapshot

  11.6.7.2 Product/Service Portfolio

  11.6.7.3 Key Company Financials

  11.6.7.4 SWOT Analysis

 11.6.8 Samsara

  11.6.8.1 Company Overview & Snapshot

  11.6.8.2 Product/Service Portfolio

  11.6.8.3 Key Company Financials

  11.6.8.4 SWOT Analysis

 11.6.9 WorkWave.

  11.6.9.1 Company Overview & Snapshot

  11.6.9.2 Product/Service Portfolio

  11.6.9.3 Key Company Financials

  11.6.9.4 SWOT Analysis

 11.6.10 Route4Me

  11.6.10.1 Company Overview & Snapshot

  11.6.10.2 Product/Service Portfolio

  11.6.10.3 Key Company Financials

  11.6.10.4 SWOT Analysis

 11.6.11 PTV Group

  11.6.11.1 Company Overview & Snapshot

  11.6.11.2 Product/Service Portfolio

  11.6.11.3 Key Company Financials

  11.6.11.4 SWOT Analysis

 11.6.12 Geotab.

  11.6.12.1 Company Overview & Snapshot

  11.6.12.2 Product/Service Portfolio

  11.6.12.3 Key Company Financials

  11.6.12.4 SWOT Analysis

 11.6.13 Routific.

  11.6.13.1 Company Overview & Snapshot

  11.6.13.2 Product/Service Portfolio

  11.6.13.3 Key Company Financials

  11.6.13.4 SWOT Analysis

 11.6.14 Informatica

  11.6.14.1 Company Overview & Snapshot

  11.6.14.2 Product/Service Portfolio

  11.6.14.3 Key Company Financials

  11.6.14.4 SWOT Analysis

 11.6.15 Oracle Corporation.

  11.6.15.1 Company Overview & Snapshot

  11.6.15.2 Product/Service Portfolio

  11.6.15.3 Key Company Financials

  11.6.15.4 SWOT Analysis

 11.6.16 Manhattan Associates.

  11.6.16.1 Company Overview & Snapshot

  11.6.16.2 Product/Service Portfolio

  11.6.16.3 Key Company Financials

  11.6.16.4 SWOT Analysis

 11.6.17 SAP SE

  11.6.17.1 Company Overview & Snapshot

  11.6.17.2 Product/Service Portfolio

  11.6.17.3 Key Company Financials

  11.6.17.4 SWOT Analysis

 11.6.18 LogiNext.

  11.6.18.1 Company Overview & Snapshot

  11.6.18.2 Product/Service Portfolio

  11.6.18.3 Key Company Financials

  11.6.18.4 SWOT Analysis

 11.6.19 Llamasoft

  11.6.19.1 Company Overview & Snapshot

  11.6.19.2 Product/Service Portfolio

  11.6.19.3 Key Company Financials

  11.6.19.4 SWOT Analysis

 11.6.20 OptimoRoute.

  11.6.20.1 Company Overview & Snapshot

  11.6.20.2 Product/Service Portfolio

  11.6.20.3 Key Company Financials

  11.6.20.4 SWOT Analysis

12. Analyst Recommendations

 12.1 SNS Insider Opportunity Map

 12.2 Industry Low-Hanging Fruit Assessment

 12.3 Market Entry & Growth Strategy

 12.4 Analyst Viewpoint & Suggestions On Market Growth

13. Assumptions

14. Disclaimer

15. Appendix

 15.1 List Of Tables

 15.2 List Of Figures

MARKET SEGMENTATION

BY SOLUTION

  • Software

  • Services

    • Consulting

    • Map Integration & Software Deployment

    • Support & Maintenance

BY DEPLOYMENT

  • On premise

  • Cloud

BY ENTERPRISE SIZE

  • Large Enterprises

  • Small & Medium Size

BY INDUSTRY VERTICAL

  • Retail & FMCG

  • On-Demand Food & Grocery Delivery

  • Ride Hailing & Taxi Services

  • Homecare & Field Services

  • Logistics & Transportation

  • Others

BY FUNCTIONALITY

  • Out Bound

  • In Bound

Request for Segment Customization as per your Business Requirement: Segment Customization Request

REGIONAL COVERAGE:

North America

  • US

  • Canada

  • Mexico

Europe

  • Eastern Europe

    • Poland

    • Romania

    • Hungary

    • Turkey

    • Rest of Eastern Europe

  • Western Europe

    • Germany

    • France

    • UK

    • Italy

    • Spain

    • Netherlands

    • Switzerland

    • Austria

    • Rest of Western Europe

Asia Pacific

  • China

  • India

  • Japan

  • South Korea

  • Vietnam

  • Singapore

  • Australia

  • Rest of Asia Pacific

Middle East & Africa

  • Middle East

    • UAE

    • Egypt

    • Saudi Arabia

    • Qatar

    • Rest of the Middle East

  • Africa

    • Nigeria

    • South Africa

    • Rest of Africa

Latin America

  • Brazil

  • Argentina

  • Colombia

Request for Country Level Research Report: Country Level Customization Request

Available Customization

With the given market data, SNS Insider offers customization as per the company’s specific needs. The following customization options are available for the report:

  • Product Analysis

  • Criss-Cross segment analysis (e.g. Product X Application)

  • Product Matrix which gives a detailed comparison of product portfolio of each company

  • Geographic Analysis

  • Additional countries in any of the regions

  • Company Information

  • Detailed analysis and profiling of additional market players (Up to five)

An accurate research report requires proper strategizing as well as implementation. There are multiple factors involved in the completion of good and accurate research report and selecting the best methodology to compete the research is the toughest part. Since the research reports we provide play a crucial role in any company’s decision-making process, therefore we at SNS Insider always believe that we should choose the best method which gives us results closer to reality. This allows us to reach at a stage wherein we can provide our clients best and accurate investment to output ratio.

Each report that we prepare takes a timeframe of 350-400 business hours for production. Starting from the selection of titles through a couple of in-depth brain storming session to the final QC process before uploading our titles on our website we dedicate around 350 working hours. The titles are selected based on their current market cap and the foreseen CAGR and growth.


The 5 steps process:

Step 1: Secondary Research:

Secondary Research or Desk Research is as the name suggests is a research process wherein, we collect data through the readily available information. In this process we use various paid and unpaid databases which our team has access to and gather data through the same. This includes examining of listed companies’ annual reports, Journals, SEC filling etc. Apart from this our team has access to various associations across the globe across different industries. Lastly, we have exchange relationships with various university as well as individual libraries.

Secondary Research

Step 2: Primary Research

When we talk about primary research, it is a type of study in which the researchers collect relevant data samples directly, rather than relying on previously collected data.  This type of research is focused on gaining content specific facts that can be sued to solve specific problems. Since the collected data is fresh and first hand therefore it makes the study more accurate and genuine.

We at SNS Insider have divided Primary Research into 2 parts.

Part 1 wherein we interview the KOLs of major players as well as the upcoming ones across various geographic regions. This allows us to have their view over the market scenario and acts as an important tool to come closer to the accurate market numbers. As many as 45 paid and unpaid primary interviews are taken from both the demand and supply side of the industry to make sure we land at an accurate judgement and analysis of the market.

This step involves the triangulation of data wherein our team analyses the interview transcripts, online survey responses and observation of on filed participants. The below mentioned chart should give a better understanding of the part 1 of the primary interview.

Primary Research

Part 2: In this part of primary research the data collected via secondary research and the part 1 of the primary research is validated with the interviews from individual consultants and subject matter experts.

Consultants are those set of people who have at least 12 years of experience and expertise within the industry whereas Subject Matter Experts are those with at least 15 years of experience behind their back within the same space. The data with the help of two main processes i.e., FGDs (Focused Group Discussions) and IDs (Individual Discussions). This gives us a 3rd party nonbiased primary view of the market scenario making it a more dependable one while collation of the data pointers.

Step 3: Data Bank Validation

Once all the information is collected via primary and secondary sources, we run that information for data validation. At our intelligence centre our research heads track a lot of information related to the market which includes the quarterly reports, the daily stock prices, and other relevant information. Our data bank server gets updated every fortnight and that is how the information which we collected using our primary and secondary information is revalidated in real time.

Data Bank Validation

Step 4: QA/QC Process

After all the data collection and validation our team does a final level of quality check and quality assurance to get rid of any unwanted or undesired mistakes. This might include but not limited to getting rid of the any typos, duplication of numbers or missing of any important information. The people involved in this process include technical content writers, research heads and graphics people. Once this process is completed the title gets uploader on our platform for our clients to read it.

Step 5: Final QC/QA Process:

This is the last process and comes when the client has ordered the study. In this process a final QA/QC is done before the study is emailed to the client. Since we believe in giving our clients a good experience of our research studies, therefore, to make sure that we do not lack at our end in any way humanly possible we do a final round of quality check and then dispatch the study to the client.