Medical Devices Reimbursement Market Size & Overview
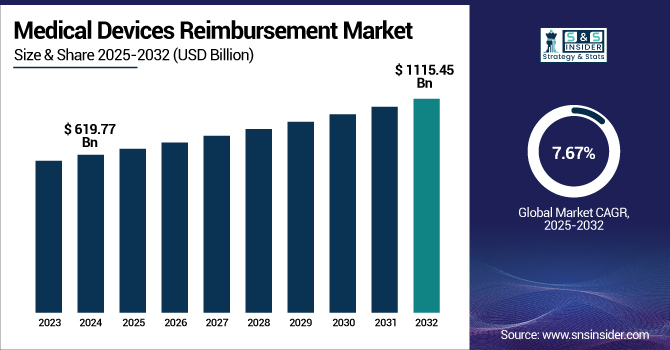
The Medical Devices Reimbursement Market size is projected to grow from USD 619.77 billion in 2024 to USD 1115.45 billion by 2032, at a CAGR of 7.67% during the forecast period 2025-2032.
The medical devices reimbursement market is facing significant growth based on increasing healthcare spending, improved adoption of superior medical technologies, and expanding instances of chronic illness. Supportive reimbursement policies across developed countries, especially, are motivating healthcare operators to incorporate superior medical devices as part of care pathways. Also, the paradigm shift toward value-based care, along with expanded access to medical services, continues to drive the demand. With governments and private insurers extending the coverage, the market has the potential to grow further during the forecast period.
To Get more information on Medical Devices Reimbursement Market - Request Free Sample Report
The U.S. medical devices reimbursement market size was valued at USD 264.53 billion in 2024 and is expected to reach USD 468.70 billion by 2032, growing at a CAGR of 7.46% over the forecast period of 2025-2032. In 2024, the U.S. dominates the North American medical devices reimbursement market. It is fueled by its established healthcare system, robust reimbursement policies, and high use of advanced medical technology in all settings of care.
For Instance, according to NCBI, Incentives and regulations in the U.S. healthcare system have created an unbalanced uptake of medical technologies, leading to both underutilization of effective, cost-saving innovations and overutilization of ineffective or not cost-effective ones. Reimbursement models, professional incentives, legal systems, and patient expectations all contribute to the medical devices reimbursement market analysis.
Medical Devices Reimbursement Market Dynamics
Drivers
-
Growing Adoption of Sophisticated Medical Technologies Driving the Market Growth
With swift advances in medical technology, e.g., smart implants, robotic surgery equipment, and wearable health monitors, physicians increasingly are using sophisticated devices to better diagnose, monitor, and treat patients. The technologies tend to be more expensive upfront, and therefore, reimbursement becomes necessary for hospitals and clinics to ensure affordability and access. Consequently, the growth of reimbursement systems to include these devices is a leading driver of growth in the medical devices reimbursement market.
For Instance, according to WHO, Recent developments in the provision of healthcare have made it possible to achieve more access to personalized care, and this has improved patient well-being immensely. The future development in the industry entails the unification of new technologies such as IoT-enabled wearable sensors, artificial intelligence (AI), and blockchain seamlessly. Particularly, the mass use of smart wearable devices is fast-tracking the shift from conventional, centralized healthcare systems to more individualized and technology-based healthcare management systems (HMS).
-
Favorable Government Policies and Initiatives Propelling the Market Growth
Governments around the world are enacting policies to improve access to healthcare, such as increased coverage for medical devices in public insurance programs. For example, U.S. programs Medicare and Medicaid offer reimbursement for most medical devices employed in older and low-income patients. For Instance, European countries tend to include reimbursement for devices under national health insurance plans. These policy initiatives lower patients' out-of-pocket expenses and challenge hospitals and providers to embrace more advanced technologies, which drive the medical devices reimbursement market trends ahead.
For Instance, according to NCBI, Recent efforts such as Make in India, the Ayushman Bharat scheme, Heal-in-India, and the Start-up Mission are creating an investor-friendly environment. These policies are encouraging private sector participation, stimulating venture capital funding, and enhancing Public-Private Partnerships (PPPs) to accelerate growth and innovation in the healthcare industry.
Restraint
-
Complex and Fragmented Reimbursement Frameworks are Restraining the Market Growth
One of the main constraints in the medical devices reimbursement market growth is the fragmentation and complexity of reimbursement systems by payers and geography. Medical device reimbursement is often highly variable depending on device category, care site, and payer policy (public and private payer coverage). Such variability leads to uncertainty for payers and manufacturers and results in time spent on delayed coverage decisions and further complicates market access plans. Additionally, ever-changing regulatory rules and coding mandates impose further layers of administrative complexity, slowing down reimbursement channels.
Medical Devices Reimbursement Market Segmentation Analysis
By Claim
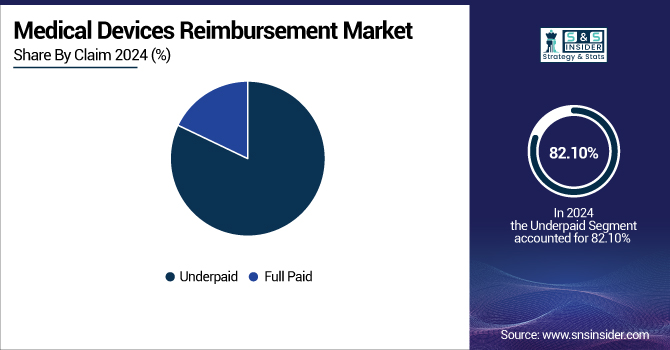
The underpaid segment dominated the medical devices reimbursement market in 2024 with 82.10% market share because of ongoing gaps in reimbursement systems and the intricacy of medical billing systems in most nations. Medical providers frequently get only partial reimbursements due to claim denials, coding mistakes, or coverage restrictions by insurers, particularly in markets with unstable or changing reimbursement policies. Moreover, the absence of standard pricing for medical devices and the delay between device approval and reimbursement policy revision helped to fuel underpayment problems, thus making this the leading segment in 2024.
The full paid segment will demonstrate significant growth over the forecast years as governments and private payers are increasingly focused on simplifying reimbursement processes, enhancing transparency, and minimizing administrative costs. The use of value-based care models, health IT system improvements, and increasing pressure to be financially sustainable are driving payers to enhance accuracy and timeliness in claim processing. As reimbursement models mature and regulatory scrutiny becomes more stringent, the percentage of fully reimbursed claims is expected to increase substantially.
By Payer
The public payers segment dominated the medical devices reimbursement market in 2024 at 68.09%, because of the universal access of government-sponsored healthcare plans as a means of access to medical devices required, especially in the developed world. Medicare and Medicaid in the US, and national health services in the EU and other parts of the globe, cover large proportions and generate high levels of reimbursement. Such programs are anticipated to offer centralized reimbursement policies, which offer wider device coverage and structured payment models, and hence are the primary source of medical device reimbursements in 2024.
The private payers segment is anticipated to see the fastest growth in the forecast period, with 7.82% CAGR, since private insurers would be broadening their portfolios of coverage due to increasing healthcare demand and the increasing cost of chronic diseases. As private health insurance penetration deepens in emerging markets and medical device innovation continues, private payers are evolving to provide more flexible and device-oriented reimbursement plans.
By Service Provider
The physician office segment dominated the medical devices reimbursement market share in 2024 with 48.04% because it plays a crucial role in the management of chronic diseases and outpatient care, both of which rely significantly on medical devices such as monitoring equipment, diagnostic tools, and small therapeutic devices. Physician offices are usually the initial point of contact for patients and handle a large number of consultations, making them use the devices frequently.
The hospitals segment is expected to exhibit the fastest growth during the projection years based on the growing complexity and cost of medical devices utilized in inpatient and acute care environments. With the increasing usage of advanced technology such as robotic surgery equipment, implantable devices, and intelligent monitoring equipment in hospitals, reimbursement demands also follow in its footsteps accordingly.
Medical Devices Reimbursement Market Regional Outlook
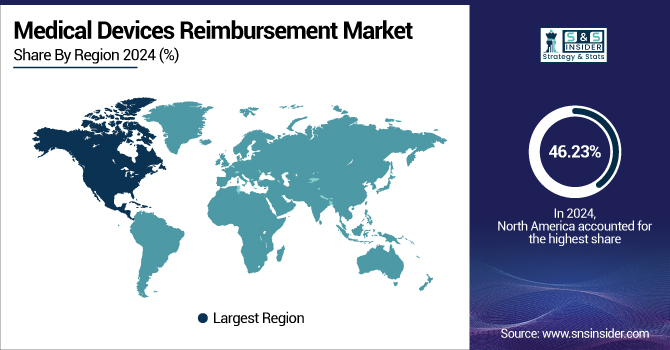
North America dominated the medical device reimbursement market with a market share of 46.23% in 2024, as it has an established healthcare system, medical device reimbursement companies, high penetration of insurance, and robust reimbursement policies. The U.S. has a highly developed third-party payer system, comprising public (Medicare, Medicaid) and private payers, which supports easy reimbursement for a vast range of medical devices. Moreover, regulatory clarity by institutions such as the Centers for Medicare & Medicaid Services (CMS) promotes innovation and quicker coverage decisions for new devices. High per capita healthcare spending and a large pool of aging patients who often need medical devices further propel market leadership.
Asia Pacific is the fastest-growing region in the medical devices reimbursement market with 8.66% CAGR over the forecast period due to expanding healthcare infrastructure, increasing government initiatives to increase insurance coverage, and increasing demand for advanced medical devices among an expanding middle class. China, India, and Japan are increasingly implementing organized reimbursement policies for managing out-of-pocket expenditures and improving access to health technologies. The growing prevalence of chronic conditions and the transition towards value-based care are also encouraging governments to make investments in reimbursement schemes that can promote long-term care and device affordability. All these trends collectively put Asia Pacific at the center of growth drivers for the global market.
Germany leads the European medical devices reimbursement market because of its strong statutory health insurance system that covers more than 90% of the population. The nation's centralised health system has adequately functioning channels for reimbursement of a broad variety of medical devices, predominantly via publicly funded sickness funds. The nation possesses an institutionalised appraisal system by the Federal Joint Committee (G-BA) that examines medical technologies based on clinical effectiveness and cost-effectiveness for coverage.
Latin America and the Middle East & Africa (MEA) are witnessing moderate growth in the medical devices reimbursement market over the forecast period, largely because of limited healthcare infrastructure, reduced insurance penetration, and fragmented reimbursement systems. Although certain countries within these regions are inching towards increasing healthcare coverage and integrating reimbursement systems, such growth is uneven across countries.
Get Customized Report as per Your Business Requirement - Enquiry Now
Key Players in the Medical Devices Reimbursement Market
UnitedHealth Group, Allianz SE, Nippon Life Insurance, Aviva plc, WellCare Health Plans, Aetna Inc., BNP Paribas, Cigna Healthcare, Humana Inc., CVS Health Corporation, Medtronic, and other players.
Recent Trends
-
March 2025 – In response to rising drug costs, Optum Rx announced a shift to a cost-based reimbursement model that aligns payments with actual pharmacy expenses. Effective immediately and fully implemented by January 2028, the model supports over 24,000 independent pharmacies and aims to improve affordability and care quality.
-
February 2025 – The Centers for Medicare & Medicaid Services (CMS) has made a National Coverage Decision (NCD) concerning coverage of implantable pulmonary artery pressure sensors (IPAPS) for the treatment of heart failure. With this ruling, the Cordella Pulmonary Artery (PA) Sensor System is now covered for Medicare beneficiaries diagnosed with NYHA Class III heart failure at risk for congestive events. This ruling is a milestone in the increase in access to sophisticated cardiac monitoring technologies for qualifying patients.
| Report Attributes | Details |
|---|---|
| Market Size in 2024 | USD 619.77 Billion |
| Market Size by 2032 | USD 1115.45 Billion |
| CAGR | CAGR of 7.67% From 2025 to 2032 |
| Base Year | 2024 |
| Forecast Period | 2025-2032 |
| Historical Data | 2021-2023 |
| Report Scope & Coverage | Market Size, Segments Analysis, Competitive Landscape, Regional Analysis, DROC & SWOT Analysis, Forecast Outlook |
| Key Segments | • By Claim (Underpaid, Full Paid) • By Payer (Public Payers, Private Payers) • By Service Provider (Physician Office, Hospitals, Diagnostic Laboratories, Others) |
| Regional Analysis/Coverage | North America (US, Canada, Mexico), Europe (Germany, France, UK, Italy, Spain, Poland, Turkey, Rest of Europe), Asia Pacific (China, India, Japan, South Korea, Singapore, Australia, Rest of Asia Pacific), Middle East & Africa (UAE, Saudi Arabia, Qatar, South Africa, Rest of Middle East & Africa), Latin America (Brazil, Argentina, Rest of Latin America) |
| Company Profiles | UnitedHealth Group, Allianz SE, Nippon Life Insurance, Aviva plc, WellCare Health Plans, Aetna Inc., BNP Paribas, Cigna Healthcare, Humana Inc., CVS Health Corporation, Medtronic, and other players. |
Frequently Asked Questions
Ans: North America dominated the Medical Devices Reimbursement Market in 2024.
Ans: The “Public payers” segment dominated the Medical Devices Reimbursement Market.
Ans: Growing Adoption of Sophisticated Medical Technologies Driving the Market Growth.
Ans: The Medical Devices Reimbursement Market was USD 619.77 billion in 2024 and is expected to reach USD 1115.45 billion by 2032.
Ans: The Medical Devices Reimbursement Market is expected to grow at a CAGR of 7.67% from 2025-2032.
Get in Touch
