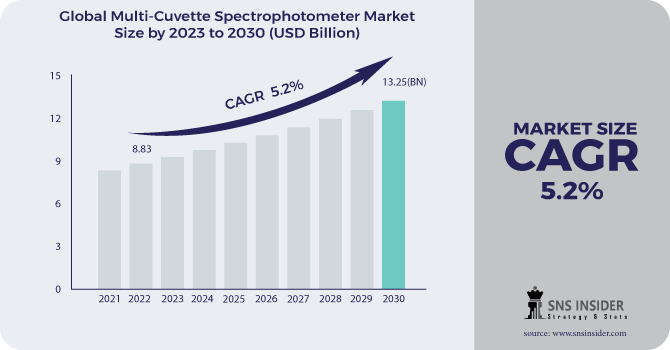
The Multi-Cuvette Spectrophotometer Market Size was valued at USD 9.61 Billion in 2023 and is expected to reach USD 15.10 Billion by 2031 and grow at a CAGR of 5.8% over the forecast period 2024-2031.
The Multi-Cuvette Spectrophotometer is widely used in a variety of industries. Microbiology, forensics, health, physics, and biochemistry are some of the applications. It is an important tool that aids bacterial growth. The instrument is more commonly used in the medical field. Furthermore, in many cases, a patient urine test is required. Any underlying condition can be determined by the chemicals in a patient's urine. During diagnosis, the Cuvette spectrophotometer can measure the acid rate. The life science industry is rapidly evolving. There is a lot of research going on in the industry. The demand for dependable and precise instruments is high. Because of advancements in life science, the Multi-Cuvette Spectrophotometer Market is gaining traction.
Get more information on the Multi-Cuvette Spectrophotometer Market - Request Sample Report
KEY DRIVERS:
Spectrophotometers are becoming more popular in the pharmaceutical industry.
The use of spectrophotometers in environmental screening is becoming more popular.
Spectrophotometry is a pivotal tool across various environmental applications, including water quality analysis, air pollution monitoring, soil analysis, biodiversity conservation, and remote sensing. By leveraging absorption spectra, scientists assess pollutants in water bodies and air, nutrient concentrations in soil, and impacts on biodiversity. Remote sensing further extends its utility for large-scale environmental monitoring. Technological advancements have produced portable spectrophotometers, enhancing field-based monitoring capabilities. The increasing reliance on spectrophotometric techniques underscores the urgency in addressing environmental challenges and underscores the indispensable role these methods play in fostering sustainability and resilience in ecosystems and human communities amidst intensifying environmental concerns and stringent regulations.
RESTRAINTS:
Cuvettes have low durability.
OPPORTUNITIES:
Huge demand for molecular analysis.
The expansion of the portable Multi-Cuvette Spectrophotometer will open up new possibilities in the future.
The development of the portable Multi-Cuvette Spectrophotometer marks a significant step forward in molecular analysis, addressing the growing need for effective and adaptable analytical tools. This advancement brings several benefits, including improved portability, enabling researchers to perform analyses in diverse environments, even where access to conventional laboratory equipment is limited. Moreover, the capability to analyze multiple samples simultaneously boosts efficiency, hastening the process of data collection and analysis. Additionally, the portability of these spectrophotometers facilitates on-site measurements, reducing the necessity for sample transportation and minimizing the risk of sample deterioration.
CHALLENGES:
Inadequate technical expertise.
The COVID outbreak is causing unexpected changes in global markets. In this period, the way businesses operate is changing. Physical stores and business operations are closing. Since 2020, there has been less business activity than ever before. Markets are unable to supply their products. Some of the major challenges include supply chain disruptions and a slowdown in production. Several challenges are confronting the multi-cuvette spectrophotometer market at this time. There are numerous factors limiting market growth. However, this is a time when the use of spectrophotometer cuvettes is increasing. The medical screening market is expanding rapidly. There are a lot of people who need to be screened because of the covid 19. Many countries are seeing an increase in demand for the instrument. In addition, demand for the instrument will rise in the coming years.
BY PRODUCT
UV-Vis Spectrophotometer
UV-Vis-NIR Spectrophotometer
The Multi-Cuvette Spectrophotometer Market is segmented into UV-Vis Spectrophotometer and UV-Vis-NIR Spectrophotometer. Due to the increasing application of UV-Vis spectrophotometers in pharmaceutical and biotechnology sectors, as well as rising R&D for technological advancements in spectroscopy systems, the UV-Vis spectrophotometer segment is expected to be the fastest-growing segment of the multi-cuvette spectrophotometer market during the forecast period. High throughput screening, micro-volume sampling, software integration with instruments, and the fact that a large number of data points can be gathered, recorded, and shared using these systems all contribute to the growth of the multi-cuvette spectrophotometer market.
BY TYPE
Portable
Benchtop
The Multi-Cuvette Spectrophotometer Market is segmented into Portable and Benchtop. Portable multi-cuvette spectrophotometers are a rapidly growing segment of the multi-cuvette spectrophotometer market because they are durable, ergonomic, and handheld devices that provide one-hand, one-touch sample measurements and are used in environmental testing and academic studies.
BY APPLICATION
Life Science
Environmental
Medical
Metallurgy
Food Beverage
Molecular Diagnostics
Chemical
Pharmaceutical
Geology
Others
.png)
Get Customized Report as per your Business Requirement - Request For Customized Report
The Asia Pacific region emerges as the foremost market with significant growth potential, commanding the highest market shares. Notably, investments in Multi-Cuvette Spectrophotometer instruments are particularly robust in this region. Key countries such as China, India, and Japan are fueled by numerous drivers, while Taiwan is experiencing noteworthy advancements in this market, propelling it towards the fastest growth rate. Moreover, North America follows as the subsequent major shareholder. The market benefits from strong spending power, providing an advantageous environment. Technological innovations and product introductions are prevalent in North America, contributing to its market dynamism.
REGIONAL COVERAGE:
North America
US
Canada
Mexico
Europe
Eastern Europe
Poland
Romania
Hungary
Turkey
Rest of Eastern Europe
Western Europe
Germany
France
UK
Italy
Spain
Netherlands
Switzerland
Austria
Rest of Western Europe
Asia Pacific
China
India
Japan
South Korea
Vietnam
Singapore
Australia
Rest of Asia Pacific
Middle East & Africa
Middle East
UAE
Egypt
Saudi Arabia
Qatar
Rest of Middle East
Africa
Nigeria
South Africa
Rest of Africa
Latin America
Brazil
Argentina
Colombia
Rest of Latin America
The key players in the Multi-Cuvette Spectrophotometer Market are Hach Company, Agilent Technologies, Mettler-Toledo International, Panomex, Konica Minolta, PCE Holdings, Hitachi High-Technologies, Wincom Company, Thermo Fisher Scientific, PerkinElmer, Cole Parmer & Other Players.
Hitachi High-Technologies-Company Financial Analysis
RECENT DEVELOPMENT
In October 2023: Agilent disclosed a partnership with the University of California, San Diego, aiming to pioneer novel multi-cuvette systems tailored for high-throughput drug discovery initiatives.
In February 2024: while no significant developments were reported exclusively concerning multi-cuvette spectrophotometers, Agilent sustained its position as a frontrunner in the analytical instrumentation sector, continuing research and development endeavors in this domain.
| Report Attributes | Details |
|---|---|
| Market Size in 2023 | US$ 9.61 Billion |
| Market Size by 2031 | US$ 15.10 Billion |
| CAGR | CAGR of 5.8% From 2024 to 2031 |
| Base Year | 2023 |
| Forecast Period | 2024-2031 |
| Historical Data | 2020-2022 |
| Report Scope & Coverage | Market Size, Segments Analysis, Competitive Landscape, Regional Analysis, DROC & SWOT Analysis, Forecast Outlook |
| Key Segments | • By Product (UV-Vis Spectrophotometer, UV-Vis-NIR Spectrophotometer) • By Type (Portable, Benchtop) • By Application (Life Science, Environmental, Medical, Metallurgy, Food Beverage, Molecular Diagnostics, Chemical, Pharmaceutical, Geology, Others) |
| Regional Analysis/Coverage | North America (US, Canada, Mexico), Europe (Eastern Europe [Poland, Romania, Hungary, Turkey, Rest of Eastern Europe] Western Europe] Germany, France, UK, Italy, Spain, Netherlands, Switzerland, Austria, Rest of Western Europe]), Asia Pacific (China, India, Japan, South Korea, Vietnam, Singapore, Australia, Rest of Asia Pacific), Middle East & Africa (Middle East [UAE, Egypt, Saudi Arabia, Qatar, Rest of Middle East], Africa [Nigeria, South Africa, Rest of Africa], Latin America (Brazil, Argentina, Colombia, Rest of Latin America) |
| Company Profiles | Hach Company, Agilent Technologies, Mettler-Toledo International, Panomex, Konica Minolta, PCE Holdings, Hitachi High-Technologies, Wincom Company, Thermo Fisher Scientific, PerkinElmer, and Cole Parmer. |
| Key Drivers | • Spectrophotometers are becoming more popular in the pharmaceutical industry. • The use of spectrophotometers in environmental screening is becoming more popular |
| RESTRAINTS | • Cuvettes have low durability |
The Multi-Cuvette Spectrophotometer Market was valued at USD 9.61 Billion in 2023.
The expected CAGR of the global Multi-Cuvette Spectrophotometer Market during the forecast period is 5.8%.
The portable variant of multi-cuvette spectrophotometer is expected to garner higher momentum in the market.
The rising demand for spectrophotometers in environmental screening sectors, along with pharmaceutical and related industries, stands out as crucial growth boosters in the global market.
The Asia-Pacific region with the Highest Revenue share in 2023.
TABLE OF CONTENTS
1. Introduction
1.1 Market Definition
1.2 Scope
1.3 Research Assumptions
2. Industry Flowchart
3. Research Methodology
4. Market Dynamics
4.1 Drivers
4.2 Restraints
4.3 Opportunities
4.4 Challenges
5. Impact Analysis
5.1 Impact of Russia-Ukraine Crisis
5.2 Impact of Economic Slowdown on Major Countries
5.2.1 Introduction
5.2.2 United States
5.2.3 Canada
5.2.4 Germany
5.2.5 France
5.2.6 UK
5.2.7 China
5.2.8 Japan
5.2.9 South Korea
5.2.10 India
6. Value Chain Analysis
7. Porter’s 5 Forces Model
8. Pest Analysis
9. Multi-Cuvette Spectrophotometer Market, By Product
9.1 Introduction
9.2 Trend Analysis
9.3 UV-Vis Spectrophotometer
9.4 UV-Vis-NIR Spectrophotometer
10. Multi-Cuvette Spectrophotometer Market, By Type
10.1 Introduction
10.2 Trend Analysis
10.3 Portable
10.4 Benchtop
11. Multi-Cuvette Spectrophotometer Market, By Application
11.1 Introduction
11.2 Trend Analysis
11.3 Life Science
11.4 Environmental
11.5 Medical
11.6 Metallurgy
11.7 Food Beverage
11.8 Molecular Diagnostics
11.9 Chemical
11.10 Pharmaceutical
11.11 Geology
11.12 Others
12. Regional Analysis
12.1 Introduction
12.2 North America
12.2.1 USA
12.2.2 Canada
12.2.3 Mexico
12.3 Europe
12.3.1 Eastern Europe
12.3.1.1 Poland
12.3.1.2 Romania
12.3.1.3 Hungary
12.3.1.4 Turkey
12.3.1.5 Rest of Eastern Europe
12.3.2 Western Europe
12.3.2.1 Germany
12.3.2.2 France
12.3.2.3 UK
12.3.2.4 Italy
12.3.2.5 Spain
12.3.2.6 Netherlands
12.3.2.7 Switzerland
12.3.2.8 Austria
12.3.2.9 Rest of Western Europe
12.4 Asia-Pacific
12.4.1 China
12.4.2 India
12.4.3 Japan
12.4.4 South Korea
12.4.5 Vietnam
12.4.6 Singapore
12.4.7 Australia
12.4.8 Rest of Asia Pacific
12.5 The Middle East & Africa
12.5.1 Middle East
12.5.1.1 UAE
12.5.1.2 Egypt
12.5.1.3 Saudi Arabia
12.5.1.4 Qatar
12.5.1.5 Rest of the Middle East
11.5.2 Africa
12.5.2.1 Nigeria
12.5.2.2 South Africa
12.5.2.3 Rest of Africa
12.6 Latin America
12.6.1 Brazil
12.6.2 Argentina
12.6.3 Colombia
12.6.4 Rest of Latin America
13. Company Profiles
13.1 Hach Company
13.1.1 Company Overview
13.1.2 Financial
13.1.3 Products/ Services Offered
13.1.4 SWOT Analysis
13.1.5 The SNS View
13.2 Agilent Technologies
13.2.1 Company Overview
13.2.2 Financial
13.2.3 Products/ Services Offered
13.2.4 SWOT Analysis
13.2.5 The SNS View
13.3 Mettler-Toledo International
13.3.1 Company Overview
13.3.2 Financial
13.3.3 Products/ Services Offered
13.3.4 SWOT Analysis
13.3.5 The SNS View
13.4 Panomex
13.4.1 Company Overview
13.4.2 Financial
13.4.3 Products/ Services Offered
13.4.4 SWOT Analysis
13.4.5 The SNS View
13.5 Konica Minolta
13.5.1 Company Overview
13.5.2 Financial
13.5.3 Products/ Services Offered
13.5.4 SWOT Analysis
13.5.5 The SNS View
13.6 PCE Holdings
13.6.1 Company Overview
13.6.2 Financial
13.6.3 Products/ Services Offered
13.6.4 SWOT Analysis
13.6.5 The SNS View
13.7 Hitachi High-Technologies
13.7.1 Company Overview
13.7.2 Financial
13.7.3 Products/ Services Offered
13.7.4 SWOT Analysis
13.7.5 The SNS View
13.8 Wincom Company
13.8.1 Company Overview
13.8.2 Financial
13.8.3 Products/ Services Offered
13.8.4 SWOT Analysis
13.8.5 The SNS View
13.9 Thermo Fisher Scientific
13.9.1 Company Overview
13.9.2 Financial
13.9.3 Products/ Services Offered
13.9.4 SWOT Analysis
13.9.5 The SNS View
13.10 PerkinElmer
13.10.1 Company Overview
13.10.2 Financial
13.10.3 Products/ Services Offered
13.10.4 SWOT Analysis
13.10.5 The SNS View
13.11 Cole Parmer
13.11.1 Company Overview
13.11.2 Financial
13.11.3 Products/ Services Offered
13.11.4 SWOT Analysis
13.11.5 The SNS View
14. Competitive Landscape
14.1 Competitive Benchmarking
14.2 Market Share Analysis
14.3 Recent Developments
14.3.1 Industry News
14.3.2 Company News
14.3.3 Mergers & Acquisitions
15. Use Case and Best Practices
16. Conclusion
An accurate research report requires proper strategizing as well as implementation. There are multiple factors involved in the completion of good and accurate research report and selecting the best methodology to compete the research is the toughest part. Since the research reports we provide play a crucial role in any company’s decision-making process, therefore we at SNS Insider always believe that we should choose the best method which gives us results closer to reality. This allows us to reach at a stage wherein we can provide our clients best and accurate investment to output ratio.
Each report that we prepare takes a timeframe of 350-400 business hours for production. Starting from the selection of titles through a couple of in-depth brain storming session to the final QC process before uploading our titles on our website we dedicate around 350 working hours. The titles are selected based on their current market cap and the foreseen CAGR and growth.
The 5 steps process:
Step 1: Secondary Research:
Secondary Research or Desk Research is as the name suggests is a research process wherein, we collect data through the readily available information. In this process we use various paid and unpaid databases which our team has access to and gather data through the same. This includes examining of listed companies’ annual reports, Journals, SEC filling etc. Apart from this our team has access to various associations across the globe across different industries. Lastly, we have exchange relationships with various university as well as individual libraries.

Step 2: Primary Research
When we talk about primary research, it is a type of study in which the researchers collect relevant data samples directly, rather than relying on previously collected data. This type of research is focused on gaining content specific facts that can be sued to solve specific problems. Since the collected data is fresh and first hand therefore it makes the study more accurate and genuine.
We at SNS Insider have divided Primary Research into 2 parts.
Part 1 wherein we interview the KOLs of major players as well as the upcoming ones across various geographic regions. This allows us to have their view over the market scenario and acts as an important tool to come closer to the accurate market numbers. As many as 45 paid and unpaid primary interviews are taken from both the demand and supply side of the industry to make sure we land at an accurate judgement and analysis of the market.
This step involves the triangulation of data wherein our team analyses the interview transcripts, online survey responses and observation of on filed participants. The below mentioned chart should give a better understanding of the part 1 of the primary interview.

Part 2: In this part of primary research the data collected via secondary research and the part 1 of the primary research is validated with the interviews from individual consultants and subject matter experts.
Consultants are those set of people who have at least 12 years of experience and expertise within the industry whereas Subject Matter Experts are those with at least 15 years of experience behind their back within the same space. The data with the help of two main processes i.e., FGDs (Focused Group Discussions) and IDs (Individual Discussions). This gives us a 3rd party nonbiased primary view of the market scenario making it a more dependable one while collation of the data pointers.
Step 3: Data Bank Validation
Once all the information is collected via primary and secondary sources, we run that information for data validation. At our intelligence centre our research heads track a lot of information related to the market which includes the quarterly reports, the daily stock prices, and other relevant information. Our data bank server gets updated every fortnight and that is how the information which we collected using our primary and secondary information is revalidated in real time.

Step 4: QA/QC Process
After all the data collection and validation our team does a final level of quality check and quality assurance to get rid of any unwanted or undesired mistakes. This might include but not limited to getting rid of the any typos, duplication of numbers or missing of any important information. The people involved in this process include technical content writers, research heads and graphics people. Once this process is completed the title gets uploader on our platform for our clients to read it.
Step 5: Final QC/QA Process:
This is the last process and comes when the client has ordered the study. In this process a final QA/QC is done before the study is emailed to the client. Since we believe in giving our clients a good experience of our research studies, therefore, to make sure that we do not lack at our end in any way humanly possible we do a final round of quality check and then dispatch the study to the client.
The RF Power Amplifier Market Size was valued at USD 21.55 billion in 2022 and is expected to reach USD 58.45 billion by 2030 and grow at a CAGR of 13.28% over the forecast period 2023-2030.
The Piezoelectric devices market size was valued at USD 33.1 billion in 2022 and is expected to grow to USD 57.29 billion by 2030 and grow at a CAGR Of 7.1 % over the forecast period of 2023-2030.
The Body Area Network Market size was valued at USD 13.2 billion in 2022 and is expected to grow to USD 31.98 billion by 2030 and grow at a CAGR of 11.7 % over the forecast period of 2023-2030.
Compound Semiconductor Market Size was valued at USD 42.9 billion in 2023 and is expected to reach USD 80.67 billion by 2031 and grow at a CAGR of 8.2% over the forecast period 2024-2031.
Neuromorphic Chip Market Size was valued at USD 44.77 Million in 2023 and is expected to reach USD 2734.8 Million by 2031 and grow at a CAGR of 67.2% over the forecast period 2024-2031.
The Structured Cabling Market Size will be valued at USD 24.16 billion in 2030, and it will be valued at USD 10.63 billion in 2022, and grow at a CAGR of 10.8% over the forecast period 2023-2030.

Hi! Click one of our member below to chat on Phone
© 2024 All Rights Reserved by SNS Insider Pvt Ltd