To Get More Information on Multi-Function Display Market - Request Sample Report
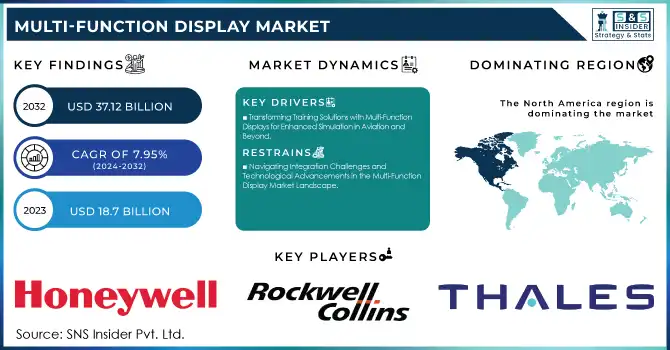
The Multi-Function Display Market Size was valued at USD 18.7 Billion in 2023 and is expected to reach USD 37.12 Billion by 2032 and grow at a CAGR of 7.95% over the forecast period 2024-2032.
The Multi-Function Display market is growing due to the increasing adoption of advanced technology, and increased demand for situational awareness through varied applications during flying operations is driving the growth of the MFD Market. MFDs combine different functionalities in a single display to give the user various types of information redundantly, and in turn, assist them with decision-making efforts by providing a reduced operational time frame. Advancements in display technology, including high-resolution screens, touch functionality, and enhanced user interfaces have greatly improved the ease of use and efficacy of MFDs in mission-critical situations. 90% of new commercial aircraft had MFDs installed, with 70% having 4K touchscreen MFD displays for improved resolution. Helmet-mounted displays saw an increase in military adoption as well with 60% of fighter jets flying with HMDs, while 40% of electric vehicles used MFDs to show important metrics like battery health and navigation. Besides, an increasing trend in digitalization of various sectors including aerospace & defense and automotive among others is also accelerating the demand for MFDs owing to this integrated functionality that holds the potential to improve operational efficiency.
Additionally, the growing focus on safety and efficiency in transportation systems is known to be boosting the uptake of MFDs. MFDs are also used to manage cockpit information and keep an eye on relevant flight data in aviation. In automotive, MFDs enhance driver safety by integrating navigation, communication, and vehicle diagnostics in a single interface.
In 2023, MFDs in commercial early aviation were able to reduce pilot workload by up to 20% for critical phases of flight. MFDs, the multi-function display was found in about 45% of vehicles where navigation, communication, and diagnostics were featured which integrated to improve safety while driving. Modern naval vessels employed MFDs for advanced navigation and system monitoring, with 75% of respondents expressing such familiarity with them, and more than 80% of industry professionals admiring the crucial role of MFDs in standards safe and efficient operation.
KEY DRIVERS:
The rising adoption of automation & advanced systems in different industries is one of the major driving factors for the growth of the Multi-Function Display market.
With organizations looking for ways to boost productivity, human error has been their enemy and as a result, automated solutions are on the rise to optimize operational processes. This transformation would not be possible without MFDs performing the important function of providing access to multiple workflows in a single window integrating information from many stores of data. It helps users access and understand important data and assists them in making faster decisions which leads to more efficient working. In 2023, about 85% of commercial planes have resorted to the use of Multi-Function Displays (MFD) for higher automation and lower pilot workload. About 50% of relatively new vehicles incorporated MFDs which provided a 30% enhancement in user perceptions about operational performance. About 70% of new military aircraft and vessels integrated MFD technology into automated systems to improve mission success. A survey also found that 75% of respondents working in the industry view MFDs as vital for minimizing the risk of human error and improving workflow management. Thereby increasing demand for these displays, MFDs are being utilized in industries such as aerospace, automotive, and military to improve workflows and functions of automated systems.
Transforming Training Solutions with Multi-Function Displays for Enhanced Simulation in Aviation and Beyond
The need for efficient training programs becomes even more important as industries start adopting advanced technologies. MFDs are being used as part of simulators for pilot training (both civil and military), and operator training on how to use these devices in the cockpit and during operations. These trainers simulate a replica of the operational environments and not only enable representation but also interaction with simulated systems under supervision. This is not only good for having a better experience while learning but also for making sure operators know how to react in the outside world perfectly. Organizations invest in training and development for their workforce to be skilled with advanced technologies.
In 2023, approximately 80% of civil and military aviation flight training programs included Multi-Function Displays in their simulators to better train pilots similar to how they would operate within an actual aircraft. With a particular emphasis on MFD, the aviation sector spent an estimated USD 3 billion on training solutions. In aerospace and defense sectors where effective training was among top priorities, approximately 65% of operators using MFDs showed a 40% increase in knowledge retention while maximizing their operational readiness. The demand for MFDs utilized in training & simulation along with civilian purposes will witness a steady rise, driving the market over the forecasting period.
RESTRAIN:
Navigating Integration Challenges and Technological Advancements in the Multi-Function Display Market Landscape
The complexity with which Multi-Function Display has to be integrated into existing platforms is one of the major restraints in this market. Given that MFDs merge many functions within one interface, it can be difficult to make them compatible across various technologies and systems. The complexity involved can result in prolonged deployment cycles which may require specialist skills thereby discouraging adoption of MFD solutions. The rapidity of technological progress poses another challenge that requires constant revisions and improvements to MFDs. This will take continued investment to remain competitive in developing technologies like AI and AR. So, manufacturers should transform their products to align with emerging user needs to stay ahead in an ever-evolving market. Losing market share and customers to competitors providing more sophisticated or user-friendly solutions due to repeating the same product without upgrading.
BY SYSTEM
In 2023, the Electronic Flight Display dominated the market share at 42% in terms of revenue due to its significant impact on situational awareness and operational efficiency in aviation. EFDs integrate important flying data like altitude, magnitude, navigational information, and system alarms into one interface for pilots to review and decode data expedited. These features help mitigate pilot workload and minimize the probability of human error, becoming a necessary instrument on modern aircraft. Furthermore, the need for digital cockpits and stringent regulations demanding better safety and performance are also retaining EFDs' presence strong in the market.
Heads-up displays are projected to have the fastest growth in CAGRs during 2024–2032 owing to their unique advantages that can enhance pilot visibility and safety. Heads-up displays (HUDs) shine important flight information onto the windshield so that pilots can not only see what they need to know but also what is outside of their cockpit. This is especially useful during the more important parts of a flight like takeoff and landing. Increasing demand for modern-day avionics coupled with an increased focus on improving pilot situational awareness is driving the investments in HUD technology. In addition, HUD systems are expected to be a major growth area in the MFD market due to features like augmented reality integration, and improvements like enhanced display clarity, which will attract more customers over time as they become more active users of HUDs.
BY PLATFORM
The Land segment led the Multi-Function Display market with a share of 52% in 2023. These displays have been highly adopted in land applications as they help in integrating navigation, vehicle diagnostics, as well as, communication systems on a single interface. As a result, operators can make rapid and informed decisions to boost operational efficiency. In addition, the adoption of smart vehicle technologies has accelerated the use of these displays in land applications. Moreover, the increased push for vehicle automation in the land transportation sector has also propelled the demand for MFDs, hence, contributing to the large market share of this segment.
The Airborne segment is expected to register the fastest growth rate between 2024 and 2032 as there have been several advancements in the aviation sector. Currently, the focus is on enhancing the situational awareness and safety of the pilots. The industry is progressively integrating advanced avionics into all its airframes, leading to a high demand for MFDs that are compatible with a broad array of avionics systems. The adoption of unmanned aerial vehicles in the civil and defense platforms is also rapid. Additionally, manufacturers are incorporating advanced systems in new models of aircraft which is a trend that will complement the growth of this segment as there will be a high demand for innovative MFDs that can be installed in such aircraft. Further, safe and efficient navigation, more advanced communication as well as monitoring, and control systems are required in airborne applications.
BY TECHNOLOGY
LED held the largest market share of 38% in terms of revenue for the Multi-Function Display segment due to high demand from various end-use industries such as automotive, aviation, and consumer electronics during the forecast period. LEDs are chosen primarily for their high brightness energy efficiency, and long life that are used in such applications where they need to be visible like the aircraft cockpit or vehicle dashboard. The fact that they can generate bright, clear images irrespective of lighting facilitates a better user experience which in turn is contributing to increased demand. Finally, the maturity of LED technology has resulted in these cost-effective solutions becoming embedded into an increasing variety of devices.
The OLED segment is projected to grow at the fastest CAGR between 2024 and 2032 owing to continuous technological advancements in display technology coupled with a rise in demand for high-quality images. Compared to traditional LED displays, OLEDs have better contrast ratios, better viewing angles, and faster response times which make them attractive for high-quality imaging applications like avionics as well as automotive displays in premium vehicles. With manufacturers focusing more on the user experience while optimizing the visible performance of RGB LEDs, demand for OLED technology will be high. In addition, continuous advancements in the manufacturing process of OLED and declining fabrication costs should continue to attract investors leading to greater accessibility which will drive the growth of the MFD market region segment of OLED.
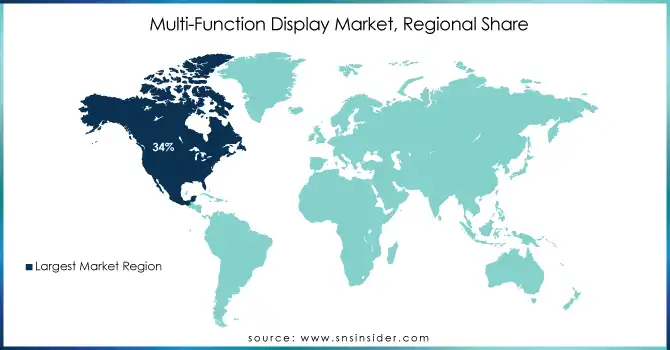
North America accounted for the largest share of 34% in the year 2023, primarily due to the highly developed aerospace and defense sectors of surrounding countries such as The United States. Boeing, one of the largest aerospace manufacturers in the world, is an excellent case in point - MFD technology appears throughout its commercial and military aircraft. An example of such modern technology is the multiple-function display systems (MFDs) installed on Boeing's 787 Dreamliner, giving pilots essential flight information to improve situational awareness and operational efficiency. In addition, stringent regulatory standards along with aviation focus on safety and performance are elevating the demand for advanced display technologies.
Asia Pacific region to grow at the fastest CAGR through 2024–2032 owing to rising industrialization and infrastructure development investments. The expansion of MFD technology in certain industries, especially the automobile industry in countries like China and Japan, is one example. Several companies even combined such advanced MFDs in their vehicles, which has resulted in better user interface and driving experience for the end users themselves (Toyota integration for business times). Among regions, the growth in the adoption of smart vehicles and focus on connectivity and automation are expected to be key drivers for the MFD market in the Asia Pacific. Moreover, when governments are spending on upgrading transport systems along with new technologies, the need for novel display solutions will also increase resulting in Asia Pacific being one of the largest growing areas in forecasted years.
Do You Need any Customization Research on Multi-Function Display Market - Inquire Now
Some of the major players in the Multi-Function Display Market are:
Honeywell International Inc. (Primus Epic, Honeywell 3D Display)
Rockwell Collins, Inc. (Pro Line Fusion, PAVES 3)
Thales Group (TopFlight, AVANT)
Garmin Ltd. (G3000, G5000)
Northrop Grumman Corporation (Integrated Avionics System, LYNX)
General Dynamics Mission Systems (Advanced Displays, Multi-Function Tactical Display)
L3 Technologies, Inc. (Ruggedized Multi-Function Display, L3Harris MFD)
Boeing (737 MAX MFD, 787 Dreamliner Display)
Elbit Systems (SkyLens, Digital Cockpit)
Mitsubishi Electric Corporation (Airborne Multi-Function Display, Avionics System)
Panasonic Corporation (Toughpad MFD, Avionics Display System)
Fujitsu Limited (Multi-Function Display Unit, MFD for Military Applications)
Saab AB (Gripen Multi-Function Display, MFD for Fighter Aircraft)
CMC Electronics Inc. (MFD-200, MFD-800)
Meggitt PLC (Meggitt MFD, Flight Data Display)
Avidyne Corporation (EX600, IFD550)
Indra Sistemas, S.A. (MFD for Military Aircraft, AVANT MFD)
Aerosonic Corporation (Multi-Function Flight Display, Cockpit Display Systems)
Hawker Beechcraft Corporation (MFD for Beechcraft Bonanza, King Air MFD)
Sagem (Safran) (MFD for Military Applications, Cockpit Display)
3M Company
DuPont de Nemours, Inc.
Honeywell Specialty Materials
BASF SE
Corning Inc.
Schott AG
Samsung Display Co., Ltd.
LG Display Co., Ltd.
Nitto Denko Corporation
Yazaki Corporation.
In October 2024, Collins Aerospace received FAA TSO approval for its multi-core Multifunction Display, enhancing cockpit processing power by 75%. This advancement significantly improves data handling for military and civil aviation operations.
In April 2024, Researchers at Linköping University, Sweden, created a touch-responsive LED display that senses touch, light, fingerprints, and even the user's pulse, this innovation could lead to a new era of interactive screens for devices like phones and tablets.
In July 2024, Aspen Avionics and Electronics International are collaborating to add engine monitoring to Aspen's Evolution displays for single-engine aircraft. The upgrade will support four- and six-cylinder engines.
Report Attributes | Details |
---|---|
Market Size in 2023 | USD 18.7 Billion |
Market Size by 2032 | USD 37.12 Billion |
CAGR | CAGR of 7.95% From 2024 to 2032 |
Base Year | 2023 |
Forecast Period | 2024-2032 |
Historical Data | 2020-2022 |
Report Scope & Coverage | Market Size, Segments Analysis, Competitive Landscape, Regional Analysis, DROC & SWOT Analysis, Forecast Outlook |
Key Segments | • By System (Electronic Flight Display (EFD), Heads-Up Display (HUD), Helmet-Mounted Display (HMD), Portable and Flexible Multi-Function Display) • By Platform (Land, Airborne, Naval) • By Technology (LED, LCD, OLED, Active-Matrix Liquid Crystal Display) |
Regional Analysis/Coverage | North America (US, Canada, Mexico), Europe (Eastern Europe [Poland, Romania, Hungary, Turkey, Rest of Eastern Europe] Western Europe] Germany, France, UK, Italy, Spain, Netherlands, Switzerland, Austria, Rest of Western Europe]), Asia Pacific (China, India, Japan, South Korea, Vietnam, Singapore, Australia, Rest of Asia Pacific), Middle East & Africa (Middle East [UAE, Egypt, Saudi Arabia, Qatar, Rest of Middle East], Africa [Nigeria, South Africa, Rest of Africa], Latin America (Brazil, Argentina, Colombia, Rest of Latin America) |
Company Profiles | Honeywell International Inc., Rockwell Collins, Inc., Thales Group, Garmin Ltd., Northrop Grumman Corporation, General Dynamics Mission Systems, L3 Technologies, Inc., Boeing, Elbit Systems, Mitsubishi Electric Corporation, Panasonic Corporation, Fujitsu Limited, Saab AB, CMC Electronics Inc., Meggitt PLC, Avidyne Corporation, Indra Sistemas, S.A., Aerosonic Corporation, Hawker Beechcraft Corporation, Sagem (Safran) |
Key Drivers | • Enhancing Automation Efficiency Through Multi-Function Displays in Aerospace Automotive and Military Industries • Transforming Training Solutions with Multi-Function Displays for Enhanced Simulation in Aviation and Beyond |
Restraints | • Navigating Integration Challenges and Technological Advancements in the Multi-Function Display Market Landscape |
Ans: The Multi-Function Display Market is expected to grow at a CAGR of 7.95% during 2024-2032.
Ans: Multi-Function Display Market size was USD 18.7 billion in 2023 and is expected to Reach USD 37.12 billion by 2032.
Ans: The major growth factor of the Multi-Function Display market is the rising demand for advanced cockpit displays that enhance situational awareness and improve operational efficiency in both commercial and military aviation.
Ans: The Electronic Flight Display (EFD) segment dominated the Multi-Function Display Market in 2023.
Ans: North America dominated the Multi-Function Display Market in 2023.
Table of Contents
1. Introduction
1.1 Market Definition
1.2 Scope (Inclusion and Exclusions)
1.3 Research Assumptions
2. Executive Summary
2.1 Market Overview
2.2 Regional Synopsis
2.3 Competitive Summary
3. Research Methodology
3.1 Top-Down Approach
3.2 Bottom-up Approach
3.3. Data Validation
3.4 Primary Interviews
4. Market Dynamics Impact Analysis
4.1 Market Driving Factors Analysis
4.1.1 Drivers
4.1.2 Restraints
4.1.3 Opportunities
4.1.4 Challenges
4.2 PESTLE Analysis
4.3 Porter’s Five Forces Model
5. Statistical Insights and Trends Reporting
5.1 Multi-Function Display Technology Adoption Rates, by Region, (2020-2023)
5.2 Multi-Function Display Energy Consumption, by Region, (2020- 2023)
5.3 Multi-Function Display User Satisfaction and Ease of Use, by Region
6. Competitive Landscape
6.1 List of Major Companies, By Region
6.2 Market Share Analysis, By Region
6.3 Product Benchmarking
6.3.1 Product specifications and features
6.3.2 Pricing
6.4 Strategic Initiatives
6.4.1 Marketing and promotional activities
6.4.2 Distribution and Supply Chain Strategies
6.4.3 Expansion plans and new product launches
6.4.4 Strategic partnerships and collaborations
6.5 Technological Advancements
6.6 Market Positioning and Branding
7. Multi-Function Display Market Segmentation, by System
7.1 Chapter Overview
7.2 Electronic Flight Display (EFD)
7.2.1 Electronic Flight Display (EFD) Market Trends Analysis (2020-2032)
7.2.2 Electronic Flight Display (EFD) Market Size Estimates and Forecasts to 2032 (USD Billion)
7.3 Heads-Up Display (HUD)
7.3.1 Heads-Up Display (HUD) Market Trends Analysis (2020-2032)
7.3.2 Heads-Up Display (HUD) Market Size Estimates and Forecasts to 2032 (USD Billion)
7.4 Helmet-Mounted Display (HMD)
7.4.1 Helmet-Mounted Display (HMD) Market Trends Analysis (2020-2032)
7.4.2 Helmet-Mounted Display (HMD) Market Size Estimates and Forecasts to 2032 (USD Billion)
7.5 Portable and Flexible Multi-Function Display
7.5.1 Portable and Flexible Multi-Function Display Market Trends Analysis (2020-2032)
7.5.2 Portable and Flexible Multi-Function Display Market Size Estimates and Forecasts to 2032 (USD Billion)
8. Multi-Function Display Market Segmentation, by Platform
8.1 Chapter Overview
8.2 Land
8.2.1 Land Market Trends Analysis (2020-2032)
8.2.2 Land Market Size Estimates and Forecasts to 2032 (USD Billion)
8.3 Airborne
8.3.1 Airborne Market Trends Analysis (2020-2032)
8.3.2 Airborne Market Size Estimates and Forecasts to 2032 (USD Billion)
8.4 Naval
8.4.1 Naval Market Trends Analysis (2020-2032)
8.4.2 Naval Market Size Estimates and Forecasts to 2032 (USD Billion)
9. Multi-Function Display Market Segmentation, by Technology
9.1 Chapter Overview
9.2 LED
9.2.1 LED Market Trends Analysis (2020-2032)
9.2.2 LED Market Size Estimates and Forecasts to 2032 (USD Billion)
9.3 LCD
9.3.1 LCD Market Trends Analysis (2020-2032)
9.3.2 LCD Market Size Estimates and Forecasts to 2032 (USD Billion)
9.4 OLED
9.4.1 OLED Market Trends Analysis (2020-2032)
9.4.2 OLED Market Size Estimates and Forecasts to 2032 (USD Billion)
9.5 Active-Matrix Liquid Crystal Display
9.5.1 Active-Matrix Liquid Crystal Display Market Trends Analysis (2020-2032)
9.5.2 Active-Matrix Liquid Crystal Display Market Size Estimates and Forecasts to 2032 (USD Billion)
10. Regional Analysis
10.1 Chapter Overview
10.2 North America
10.2.1 Trends Analysis
10.2.2 North America Multi-Function Display Market Estimates and Forecasts, by Country (2020-2032) (USD Billion)
10.2.3 North America Multi-Function Display Market Estimates and Forecasts, by System (2020-2032) (USD Billion)
10.2.4 North America Multi-Function Display Market Estimates and Forecasts, by Platform (2020-2032) (USD Billion)
10.2.5 North America Multi-Function Display Market Estimates and Forecasts, by Technology (2020-2032) (USD Billion)
10.2.6 USA
10.2.6.1 USA Multi-Function Display Market Estimates and Forecasts, by System (2020-2032) (USD Billion)
10.2.6.2 USA Multi-Function Display Market Estimates and Forecasts, by Platform (2020-2032) (USD Billion)
10.2.6.3 USA Multi-Function Display Market Estimates and Forecasts, by Technology (2020-2032) (USD Billion)
10.2.7 Canada
10.2.7.1 Canada Multi-Function Display Market Estimates and Forecasts, by System (2020-2032) (USD Billion)
10.2.7.2 Canada Multi-Function Display Market Estimates and Forecasts, by Platform (2020-2032) (USD Billion)
10.2.7.3 Canada Multi-Function Display Market Estimates and Forecasts, by Technology (2020-2032) (USD Billion)
10.2.8 Mexico
10.2.8.1 Mexico Multi-Function Display Market Estimates and Forecasts, by System (2020-2032) (USD Billion)
10.2.8.2 Mexico Multi-Function Display Market Estimates and Forecasts, by Platform (2020-2032) (USD Billion)
10.2.8.3 Mexico Multi-Function Display Market Estimates and Forecasts, by Technology (2020-2032) (USD Billion)
10.3 Europe
10.3.1 Eastern Europe
10.3.1.1 Trends Analysis
10.3.1.2 Eastern Europe Multi-Function Display Market Estimates and Forecasts, by Country (2020-2032) (USD Billion)
10.3.1.3 Eastern Europe Multi-Function Display Market Estimates and Forecasts, by System (2020-2032) (USD Billion)
10.3.1.4 Eastern Europe Multi-Function Display Market Estimates and Forecasts, by Platform (2020-2032) (USD Billion)
10.3.1.5 Eastern Europe Multi-Function Display Market Estimates and Forecasts, by Technology (2020-2032) (USD Billion)
10.3.1.6 Poland
10.3.1.6.1 Poland Multi-Function Display Market Estimates and Forecasts, by System (2020-2032) (USD Billion)
10.3.1.6.2 Poland Multi-Function Display Market Estimates and Forecasts, by Platform (2020-2032) (USD Billion)
10.3.1.6.3 Poland Multi-Function Display Market Estimates and Forecasts, by Technology (2020-2032) (USD Billion)
10.3.1.7 Romania
10.3.1.7.1 Romania Multi-Function Display Market Estimates and Forecasts, by System (2020-2032) (USD Billion)
10.3.1.7.2 Romania Multi-Function Display Market Estimates and Forecasts, by Platform (2020-2032) (USD Billion)
10.3.1.7.3 Romania Multi-Function Display Market Estimates and Forecasts, by Technology (2020-2032) (USD Billion)
10.3.1.8 Hungary
10.3.1.8.1 Hungary Multi-Function Display Market Estimates and Forecasts, by System (2020-2032) (USD Billion)
10.3.1.8.2 Hungary Multi-Function Display Market Estimates and Forecasts, by Platform (2020-2032) (USD Billion)
10.3.1.8.3 Hungary Multi-Function Display Market Market Estimates and Forecasts, by Technology (2020-2032) (USD Billion)
10.3.1.9 Turkey
10.3.1.9.1 Turkey Multi-Function Display Market Estimates and Forecasts, by System (2020-2032) (USD Billion)
10.3.1.9.2 Turkey Multi-Function Display Market Estimates and Forecasts, by Platform (2020-2032) (USD Billion)
10.3.1.9.3 Turkey Multi-Function Display Market Estimates and Forecasts, by Technology (2020-2032) (USD Billion)
10.3.1.10 Rest of Eastern Europe
10.3.1.10.1 Rest of Eastern Europe Multi-Function Display Market Estimates and Forecasts, by System (2020-2032) (USD Billion)
10.3.1.10.2 Rest of Eastern Europe Multi-Function Display Market Estimates and Forecasts, by Platform (2020-2032) (USD Billion)
10.3.1.10.3 Rest of Eastern Europe Multi-Function Display Market Estimates and Forecasts, by Technology (2020-2032) (USD Billion)
10.3.2 Western Europe
10.3.2.1 Trends Analysis
10.3.2.2 Western Europe Multi-Function Display Market Estimates and Forecasts, by Country (2020-2032) (USD Billion)
10.3.2.3 Western Europe Multi-Function Display Market Estimates and Forecasts, by System (2020-2032) (USD Billion)
10.3.2.4 Western Europe Multi-Function Display Market Estimates and Forecasts, by Platform (2020-2032) (USD Billion)
10.3.2.5 Western Europe Multi-Function Display Market Estimates and Forecasts, by Technology (2020-2032) (USD Billion)
10.3.2.6 Germany
10.3.2.6.1 Germany Multi-Function Display Market Estimates and Forecasts, by System (2020-2032) (USD Billion)
10.3.2.6.2 Germany Multi-Function Display Market Estimates and Forecasts, by Platform (2020-2032) (USD Billion)
10.3.2.6.3 Germany Multi-Function Display Market Estimates and Forecasts, by Technology (2020-2032) (USD Billion)
10.3.2.7 France
10.3.2.7.1 France Multi-Function Display Market Estimates and Forecasts, by System (2020-2032) (USD Billion)
10.3.2.7.2 France Multi-Function Display Market Estimates and Forecasts, by Platform (2020-2032) (USD Billion)
10.3.2.7.3 France Multi-Function Display Market Estimates and Forecasts, by Technology (2020-2032) (USD Billion)
10.3.2.8 UK
10.3.2.8.1 UK Multi-Function Display Market Estimates and Forecasts, by System (2020-2032) (USD Billion)
10.3.2.8.2 UK Multi-Function Display Market Estimates and Forecasts, by Platform (2020-2032) (USD Billion)
10.3.2.8.3 UK Multi-Function Display Market Estimates and Forecasts, by Technology (2020-2032) (USD Billion)
10.3.2.9 Italy
10.3.2.9.1 Italy Multi-Function Display Market Estimates and Forecasts, by System (2020-2032) (USD Billion)
10.3.2.9.2 Italy Multi-Function Display Market Estimates and Forecasts, by Platform (2020-2032) (USD Billion)
10.3.2.9.3 Italy Multi-Function Display Market Estimates and Forecasts, by Technology (2020-2032) (USD Billion)
10.3.2.10 Spain
10.3.2.10.1 Spain Multi-Function Display Market Estimates and Forecasts, by System (2020-2032) (USD Billion)
10.3.2.10.2 Spain Multi-Function Display Market Estimates and Forecasts, by Platform (2020-2032) (USD Billion)
10.3.2.10.3 Spain Multi-Function Display Market Estimates and Forecasts, by Technology (2020-2032) (USD Billion)
10.3.2.11 Netherlands
10.3.2.11.1 Netherlands Multi-Function Display Market Estimates and Forecasts, by System (2020-2032) (USD Billion)
10.3.2.11.2 Netherlands Multi-Function Display Market Estimates and Forecasts, by Platform (2020-2032) (USD Billion)
10.3.2.11.3 Netherlands Multi-Function Display Market Estimates and Forecasts, by Technology (2020-2032) (USD Billion)
10.3.2.12 Switzerland
10.3.2.12.1 Switzerland Multi-Function Display Market Estimates and Forecasts, by System (2020-2032) (USD Billion)
10.3.2.12.2 Switzerland Multi-Function Display Market Estimates and Forecasts, by Platform (2020-2032) (USD Billion)
10.3.2.12.3 Switzerland Multi-Function Display Market Estimates and Forecasts, by Technology (2020-2032) (USD Billion)
10.3.2.13 Austria
10.3.2.13.1 Austria Multi-Function Display Market Estimates and Forecasts, by System (2020-2032) (USD Billion)
10.3.2.13.2 Austria Multi-Function Display Market Estimates and Forecasts, by Platform (2020-2032) (USD Billion)
10.3.2.13.3 Austria Multi-Function Display Market Estimates and Forecasts, by Technology (2020-2032) (USD Billion)
10.3.2.14 Rest of Western Europe
10.3.2.14.1 Rest of Western Europe Multi-Function Display Market Estimates and Forecasts, by System (2020-2032) (USD Billion)
10.3.2.14.2 Rest of Western Europe Power Management Market Estimates and Forecasts, by Platform (2020-2032) (USD Billion)
10.3.2.14.3 Rest of Western Europe Multi-Function Display Market Estimates and Forecasts, by Technology (2020-2032) (USD Billion)
10.4 Asia Pacific
10.4.1 Trends Analysis
10.4.2 Asia Pacific Multi-Function Display Market Estimates and Forecasts, by Country (2020-2032) (USD Billion)
10.4.3 Asia Pacific Multi-Function Display Market Estimates and Forecasts, by System (2020-2032) (USD Billion)
10.4.4 Asia Pacific Multi-Function Display Market Estimates and Forecasts, by Platform (2020-2032) (USD Billion)
10.4.5 Asia Pacific Multi-Function Display Market Estimates and Forecasts, by Technology (2020-2032) (USD Billion)
10.4.6 China
10.4.6.1 China Multi-Function Display Market Estimates and Forecasts, by System (2020-2032) (USD Billion)
10.4.6.2 China Multi-Function Display Market Estimates and Forecasts, by Platform (2020-2032) (USD Billion)
10.4.6.3 China Multi-Function Display Market Estimates and Forecasts, by Technology (2020-2032) (USD Billion)
10.4.7 India
10.4.7.1 India Multi-Function Display Market Estimates and Forecasts, by System (2020-2032) (USD Billion)
10.4.7.2 India Multi-Function Display Market Estimates and Forecasts, by Platform (2020-2032) (USD Billion)
10.4.7.3 India Multi-Function Display Market Estimates and Forecasts, by Technology (2020-2032) (USD Billion)
10.4.8 Japan
10.4.8.1 Japan Multi-Function Display Market Estimates and Forecasts, by System (2020-2032) (USD Billion)
10.4.8.2 Japan Multi-Function Display Market Estimates and Forecasts, by Platform (2020-2032) (USD Billion)
10.4.8.3 Japan Multi-Function Display Market Estimates and Forecasts, by Technology (2020-2032) (USD Billion)
10.4.9 South Korea
10.4.9.1 South Korea Multi-Function Display Market Estimates and Forecasts, by System (2020-2032) (USD Billion)
10.4.9.2 South Korea Multi-Function Display Market Estimates and Forecasts, by Platform (2020-2032) (USD Billion)
10.4.9.3 South Korea Multi-Function Display Market Estimates and Forecasts, by Technology (2020-2032) (USD Billion)
10.4.10 Vietnam
10.4.10.1 Vietnam Multi-Function Display Market Estimates and Forecasts, by System (2020-2032) (USD Billion)
10.4.10.2 Vietnam Multi-Function Display Market Estimates and Forecasts, by Platform (2020-2032) (USD Billion)
10.4.10.3 Vietnam Multi-Function Display Market Estimates and Forecasts, by Technology (2020-2032) (USD Billion)
10.4.11 Singapore
10.4.11.1 Singapore Multi-Function Display Market Estimates and Forecasts, by System (2020-2032) (USD Billion)
10.4.11.2 Singapore Multi-Function Display Market Estimates and Forecasts, by Platform (2020-2032) (USD Billion)
10.4.11.3 Singapore Multi-Function Display Market Estimates and Forecasts, by Technology (2020-2032) (USD Billion)
10.4.12 Australia
10.4.12.1 Australia Multi-Function Display Market Estimates and Forecasts, by System (2020-2032) (USD Billion)
10.4.12.2 Australia Multi-Function Display Market Estimates and Forecasts, by Platform (2020-2032) (USD Billion)
10.4.12.3 Australia Multi-Function Display Market Estimates and Forecasts, by Technology (2020-2032) (USD Billion)
10.4.13 Rest of Asia Pacific
10.4.13.1 Rest of Asia Pacific Multi-Function Display Market Estimates and Forecasts, by System (2020-2032) (USD Billion)
10.4.13.2 Rest of Asia Pacific Multi-Function Display Market Estimates and Forecasts, by Platform (2020-2032) (USD Billion)
10.4.13.3 Rest of Asia Pacific Multi-Function Display Market Estimates and Forecasts, by Technology (2020-2032) (USD Billion)
10.5 Middle East and Africa
10.5.1 Middle East
10.5.1.1 Trends Analysis
10.5.1.2 Middle East Multi-Function Display Market Estimates and Forecasts, by Country (2020-2032) (USD Billion)
10.5.1.3 Middle East Multi-Function Display Market Estimates and Forecasts, by System (2020-2032) (USD Billion)
10.5.1.4 Middle East Multi-Function Display Market Estimates and Forecasts, by Platform (2020-2032) (USD Billion)
10.5.1.5 Middle East Multi-Function Display Market Estimates and Forecasts, by Technology (2020-2032) (USD Billion)
10.5.1.6 UAE
10.5.1.6.1 UAE Multi-Function Display Market Estimates and Forecasts, by System (2020-2032) (USD Billion)
10.5.1.6.2 UAE Multi-Function Display Market Estimates and Forecasts, by Platform (2020-2032) (USD Billion)
10.5.1.6.3 UAE Multi-Function Display Market Estimates and Forecasts, by Technology (2020-2032) (USD Billion)
10.5.1.7 Egypt
10.5.1.7.1 Egypt Multi-Function Display Market Estimates and Forecasts, by System (2020-2032) (USD Billion)
10.5.1.7.2 Egypt Multi-Function Display Market Estimates and Forecasts, by Platform (2020-2032) (USD Billion)
10.5.1.7.3 Egypt Multi-Function Display Market Estimates and Forecasts, by Technology (2020-2032) (USD Billion)
10.5.1.8 Saudi Arabia
10.5.1.8.1 Saudi Arabia Multi-Function Display Market Estimates and Forecasts, by System (2020-2032) (USD Billion)
10.5.1.8.2 Saudi Arabia Multi-Function Display Market Estimates and Forecasts, by Platform (2020-2032) (USD Billion)
10.5.1.8.3 Saudi Arabia Multi-Function Display Market Estimates and Forecasts, by Technology (2020-2032) (USD Billion)
10.5.1.9 Qatar
10.5.1.9.1 Qatar Multi-Function Display Market Estimates and Forecasts, by System (2020-2032) (USD Billion)
10.5.1.9.2 Qatar Multi-Function Display Market Estimates and Forecasts, by Platform (2020-2032) (USD Billion)
10.5.1.9.3 Qatar Multi-Function Display Market Estimates and Forecasts, by Technology (2020-2032) (USD Billion)
10.5.1.10 Rest of Middle East
10.5.1.10.1 Rest of Middle East Multi-Function Display Market Estimates and Forecasts, by System (2020-2032) (USD Billion)
10.5.1.10.2 Rest of Middle East Multi-Function Display Market Estimates and Forecasts, by Platform (2020-2032) (USD Billion)
10.5.1.10.3 Rest of Middle East Multi-Function Display Market Estimates and Forecasts, by Technology (2020-2032) (USD Billion)
10.5.2 Africa
10.5.2.1 Trends Analysis
10.5.2.2 Africa Multi-Function Display Market Estimates and Forecasts, by Country (2020-2032) (USD Billion)
10.5.2.3 Africa Multi-Function Display Market Estimates and Forecasts, by System (2020-2032) (USD Billion)
10.5.2.4 Africa Multi-Function Display Market Estimates and Forecasts, by Platform (2020-2032) (USD Billion)
10.5.2.5 Africa Multi-Function Display Market Estimates and Forecasts, by Technology (2020-2032) (USD Billion)
10.5.2.6 South Africa
10.5.2.6.1 South Africa Multi-Function Display Market Estimates and Forecasts, by System (2020-2032) (USD Billion)
10.5.2.6.2 South Africa Multi-Function Display Market Estimates and Forecasts, by Platform (2020-2032) (USD Billion)
10.5.2.6.3 South Africa Multi-Function Display Market Estimates and Forecasts, by Technology (2020-2032) (USD Billion)
10.5.2.7 Nigeria
10.5.2.7.1 Nigeria Multi-Function Display Market Estimates and Forecasts, by System (2020-2032) (USD Billion)
10.5.2.7.2 Nigeria Multi-Function Display Market Estimates and Forecasts, by Platform (2020-2032) (USD Billion)
10.5.2.7.3 Nigeria Multi-Function Display Market Estimates and Forecasts, by Technology (2020-2032) (USD Billion)
10.5.2.8 Rest of Africa
10.5.2.8.1 Rest of Africa Multi-Function Display Market Estimates and Forecasts, by System (2020-2032) (USD Billion)
10.5.2.8.2 Rest of Africa Multi-Function Display Market Estimates and Forecasts, by Platform (2020-2032) (USD Billion)
10.5.2.8.3 Rest of Africa Multi-Function Display Market Estimates and Forecasts, by Technology (2020-2032) (USD Billion)
10.6 Latin America
10.6.1 Trends Analysis
10.6.2 Latin America Multi-Function Display Market Estimates and Forecasts, by Country (2020-2032) (USD Billion)
10.6.3 Latin America Multi-Function Display Market Estimates and Forecasts, by System (2020-2032) (USD Billion)
10.6.4 Latin America Multi-Function Display Market Estimates and Forecasts, by Platform (2020-2032) (USD Billion)
10.6.5 Latin America Multi-Function Display Market Estimates and Forecasts, by Technology (2020-2032) (USD Billion)
10.6.6 Brazil
10.6.6.1 Brazil Multi-Function Display Market Estimates and Forecasts, by System (2020-2032) (USD Billion)
10.6.6.2 Brazil Multi-Function Display Market Estimates and Forecasts, by Platform (2020-2032) (USD Billion)
10.6.6.3 Brazil Multi-Function Display Market Estimates and Forecasts, by Technology (2020-2032) (USD Billion)
10.6.7 Argentina
10.6.7.1 Argentina Multi-Function Display Market Estimates and Forecasts, by System (2020-2032) (USD Billion)
10.6.7.2 Argentina Multi-Function Display Market Estimates and Forecasts, by Platform (2020-2032) (USD Billion)
10.6.7.3 Argentina Multi-Function Display Market Estimates and Forecasts, by Technology (2020-2032) (USD Billion)
10.6.8 Colombia
10.6.8.1 Colombia Multi-Function Display Market Estimates and Forecasts, by System (2020-2032) (USD Billion)
10.6.8.2 Colombia Multi-Function Display Market Estimates and Forecasts, by Platform (2020-2032) (USD Billion)
10.6.8.3 Colombia Multi-Function Display Market Estimates and Forecasts, by Technology (2020-2032) (USD Billion)
10.6.9 Rest of Latin America
10.6.9.1 Rest of Latin America Multi-Function Display Market Estimates and Forecasts, by System (2020-2032) (USD Billion)
10.6.9.2 Rest of Latin America Multi-Function Display Market Estimates and Forecasts, by Platform (2020-2032) (USD Billion)
10.6.9.3 Rest of Latin America Multi-Function Display Market Estimates and Forecasts, by Technology (2020-2032) (USD Billion)
11. Company Profiles
11.1 Honeywell International Inc
10.1.1 Company Overview
10.1.2 Financial
10.1.3 Products/ Services Offered
110.1.4 SWOT Analysis
11.2 Rockwell Collins, Inc
10.2.1 Company Overview
10.2.2 Financial
10.2.3 Products/ Services Offered
10.2.4 SWOT Analysis
11.3 Thales Group
10.3.1 Company Overview
10.3.2 Financial
10.3.3 Products/ Services Offered
10.3.4 SWOT Analysis
11.4 Garmin Ltd.
10.4.1 Company Overview
10.4.2 Financial
10.4.3 Products/ Services Offered
10.4.4 SWOT Analysis
11.5 Northrop Grumman Corporation
10.5.1 Company Overview
10.5.2 Financial
10.5.3 Products/ Services Offered
10.5.4 SWOT Analysis
11.6 General Dynamics Mission Systems
10.6.1 Company Overview
10.6.2 Financial
10.6.3 Products/ Services Offered
10.6.4 SWOT Analysis
11.7 L3 Technologies, Inc.
10.7.1 Company Overview
10.7.2 Financial
10.7.3 Products/ Services Offered
10.7.4 SWOT Analysis
11.8 Boeing
10.8.1 Company Overview
10.8.2 Financial
10.8.3 Products/ Services Offered
10.8.4 SWOT Analysis
11.9 Elbit Systems
10.9.1 Company Overview
10.9.2 Financial
10.9.3 Products/ Services Offered
10.9.4 SWOT Analysis
11.10 Mitsubishi Electric Corporation
10.9.1 Company Overview
10.9.2 Financial
10.9.3 Products/ Services Offered
10.9.4 SWOT Analysis
12. Use Cases and Best Practices
13. Conclusion
An accurate research report requires proper strategizing as well as implementation. There are multiple factors involved in the completion of good and accurate research report and selecting the best methodology to compete the research is the toughest part. Since the research reports we provide play a crucial role in any company’s decision-making process, therefore we at SNS Insider always believe that we should choose the best method which gives us results closer to reality. This allows us to reach at a stage wherein we can provide our clients best and accurate investment to output ratio.
Each report that we prepare takes a timeframe of 350-400 business hours for production. Starting from the selection of titles through a couple of in-depth brain storming session to the final QC process before uploading our titles on our website we dedicate around 350 working hours. The titles are selected based on their current market cap and the foreseen CAGR and growth.
The 5 steps process:
Step 1: Secondary Research:
Secondary Research or Desk Research is as the name suggests is a research process wherein, we collect data through the readily available information. In this process we use various paid and unpaid databases which our team has access to and gather data through the same. This includes examining of listed companies’ annual reports, Journals, SEC filling etc. Apart from this our team has access to various associations across the globe across different industries. Lastly, we have exchange relationships with various university as well as individual libraries.
Step 2: Primary Research
When we talk about primary research, it is a type of study in which the researchers collect relevant data samples directly, rather than relying on previously collected data. This type of research is focused on gaining content specific facts that can be sued to solve specific problems. Since the collected data is fresh and first hand therefore it makes the study more accurate and genuine.
We at SNS Insider have divided Primary Research into 2 parts.
Part 1 wherein we interview the KOLs of major players as well as the upcoming ones across various geographic regions. This allows us to have their view over the market scenario and acts as an important tool to come closer to the accurate market numbers. As many as 45 paid and unpaid primary interviews are taken from both the demand and supply side of the industry to make sure we land at an accurate judgement and analysis of the market.
This step involves the triangulation of data wherein our team analyses the interview transcripts, online survey responses and observation of on filed participants. The below mentioned chart should give a better understanding of the part 1 of the primary interview.
Part 2: In this part of primary research the data collected via secondary research and the part 1 of the primary research is validated with the interviews from individual consultants and subject matter experts.
Consultants are those set of people who have at least 12 years of experience and expertise within the industry whereas Subject Matter Experts are those with at least 15 years of experience behind their back within the same space. The data with the help of two main processes i.e., FGDs (Focused Group Discussions) and IDs (Individual Discussions). This gives us a 3rd party nonbiased primary view of the market scenario making it a more dependable one while collation of the data pointers.
Step 3: Data Bank Validation
Once all the information is collected via primary and secondary sources, we run that information for data validation. At our intelligence centre our research heads track a lot of information related to the market which includes the quarterly reports, the daily stock prices, and other relevant information. Our data bank server gets updated every fortnight and that is how the information which we collected using our primary and secondary information is revalidated in real time.
Step 4: QA/QC Process
After all the data collection and validation our team does a final level of quality check and quality assurance to get rid of any unwanted or undesired mistakes. This might include but not limited to getting rid of the any typos, duplication of numbers or missing of any important information. The people involved in this process include technical content writers, research heads and graphics people. Once this process is completed the title gets uploader on our platform for our clients to read it.
Step 5: Final QC/QA Process:
This is the last process and comes when the client has ordered the study. In this process a final QA/QC is done before the study is emailed to the client. Since we believe in giving our clients a good experience of our research studies, therefore, to make sure that we do not lack at our end in any way humanly possible we do a final round of quality check and then dispatch the study to the client.
Key Segmentation
By System
Electronic Flight Display (EFD)
Heads-Up Display (HUD)
Helmet-Mounted Display (HMD)
Portable and Flexible Multi-Function Display
By Platform
Land
Airborne
Naval
By Technology
LED
LCD
OLED
Active-Matrix Liquid Crystal Display
Request for Segment Customization as per your Business Requirement: Segment Customization Request
REGIONAL COVERAGE:
North America
US
Canada
Mexico
Europe
Eastern Europe
Poland
Romania
Hungary
Turkey
Rest of Eastern Europe
Western Europe
Germany
France
UK
Italy
Spain
Netherlands
Switzerland
Austria
Rest of Western Europe
Asia Pacific
China
India
Japan
South Korea
Vietnam
Singapore
Australia
Rest of Asia Pacific
Middle East & Africa
Middle East
UAE
Egypt
Saudi Arabia
Qatar
Rest of the Middle East
Africa
Nigeria
South Africa
Rest of Africa
Latin America
Brazil
Argentina
Colombia
Rest of Latin America
Request for Country Level Research Report: Country Level Customization Request
Available Customization
With the given market data, SNS Insider offers customization as per the company’s specific needs. The following customization options are available for the report:
Product Analysis
Criss-Cross segment analysis (e.g. Product X Application)
Product Matrix which gives a detailed comparison of the product portfolio of each company
Geographic Analysis
Additional countries in any of the regions
Company Information
Detailed analysis and profiling of additional market players (Up to five)
The Contraband Detectors Market Size was valued at USD 4.55 Billion in 2023 and is expected to grow at a CAGR of 7.22% to reach USD 8.51 Billion by 2032.
The Sports Technology Market Size was valued at USD 15.51 Billion in 2023 and is expected to grow at a CAGR of 20.45% to reach USD 82.70 Billion by 2032.
The Circuit Protection Market Size was valued at USD 49.28 Billion in 2023 and is expected to reach USD 81.52 Billion by 2032 and grow at a CAGR of 5.79% over the forecast period 2024-2032.
The Consumer Electronics Market size was valued at USD 956.12 Billion in 2023 & will reach USD 1775.27 Billion by 2032, with a CAGR of 7.14% by 2024-2032.
The Operational Technology Market Size was valued at $168.95 billion in 2023 and is expected to reach $310.61 billion at 7.0% CAGR by forecasts 2024-2032
The Lithium-Ion Battery Recycling Market Size was valued at USD 7.14 Billion in 2023 and is expected to reach USD 33.03 Billion by 2032 and grow at a CAGR of 19.61% over the forecast period 2024-2032.
Hi! Click one of our member below to chat on Phone