Screenless Display Market Size & Growth:
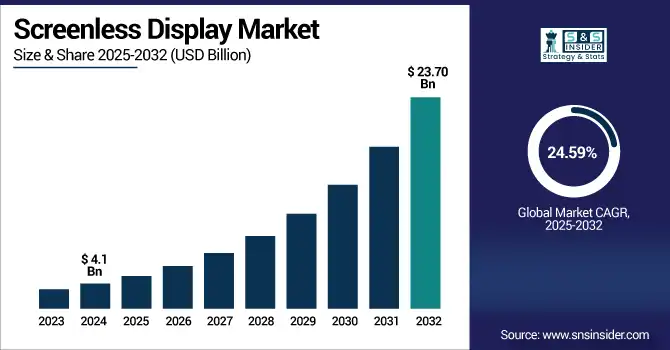
The Screenless Display Market size was valued at USD 4.1 Billion in 2024 and is projected to reach USD 23.70 Billion by 2032, growing at a CAGR of 24.59% during 2025-2032. The screenless display market is rapidly gaining momentum, due to the rising trend of augmented reality (AR), holographic projection and the growing wearable market. These devices offer visual interfaces that are weightless, immersive, spatial, and do not require a physical screen. Sectors, such as consumer electronics, automotive HUD, and healthcare visualization tools are some of the crucial sectors that drive market growth. The growing demand for portable and power-efficient solutions, combined with advancements in retinal projection and AR wearables, is changing the way users engage with digital content. In addition, screenless technologies are also bringing more multitasking capabilities, less bulkiness in devices, and a more ergonomic design. Next-generation interfaces drive productivity and user experience across industries, resulting in strong growth in the enterprise and consumer application market over the next few years.
To Get more information on Screenless Display Market- Request Free Sample Report
Sightful revealed the USD 1900 Spacetop G1 on May 30, 2024, a screenless laptop where AR glasses project a virtual 100-inch screen. Yuga comes bundled with the XREAL Air 2 Pro glasses, which feature high-resolution OLED visuals and will enable one of the most immersive computing experiences in one of the most compact packages possible.
The U.S screenless display market size was valued at USD 1.23 Billion in 2024 and is projected to reach USD 5.86 Billion by 2032, growing at a CAGR of 21.58% during 2025-2032. This growth is driven by rising need for immersive AR/VR interfaces, low-slung wearables, and state-of-the-art automotive heads-up display (HUD) systems in various sectors.
Screenless display market trends include growing adoption of retinal projection, holographic interfaces and AR glasses in healthcare, consumer electronics, and industrial automation. This set of vectors is changing models of user interaction through the transition to portable, energy-efficient and spatial computing devices. Integration with AI and IoT platforms is further enhancing user experience, reinforcing the momentum of screenless display innovation and commercialization.
Screenless Display Market Dynamics:
Drivers:
-
Localization of Supply Chain Boosts Screenless and OLED Display Market Expansion
The growing emphasis on localizing supply chains is a key driver for the expansion of the screenless and OLED display market. As a cause, increased geopolitical tensions, trade restrictions, and compliance requirements are leading many manufacturers to relocate closer to major end markets. This results in more investment in regional display manufacturing capacity, which should help drive competition, shorten lead times and strengthen supply chain resilience. Such a transition further fuels technology innovations and market adoption of high-performing, low-power display technologies, including screenless interfaces, across consumer, automotive and health verticals. It also enables manufacturers to comply with local content guidelines, strengthening their domestic foothold and being less exposed to global operational risks.
Apple approved its first BOE-made iPhone 17 Pro display panels for China on July 11, 2025, a significant milestone for BOE as it ramps up into higher-end OLED manufacturing and Apple tries to localize supply in the face of mounting regional geopolitical pressures.
Restraints:
-
High Costs and Technical Challenges Limit Mass Adoption of Screenless Display Technology
The screenless display market, while promising, is restrained by several critical factors. High production costs due to their high production cost elements including micro projectors, optical waveguide, AR interfaces, which results in less affordable in the mass market. Performance is limited by technical challenges including narrow field of view, brightness restrictions in outdoor settings, and high processing requirements. User discomfort, such as eyestrain, motion sickness, and other health and regulatory issues. The process of deploying AI is complicated by the need to integrate with existing hardware and the absence of standardized platforms across sectors. In addition, screen less displays often need proprietary content formats and end-user training, both of which reduce consumer momentum. Collectively, these restraints inhibit scalability, slow the commercialization process, and create entry barriers for new players in a technology ecosystem that is rapidly evolving.
Opportunities:
-
Growing Preference for Distraction-Free Devices Drives Opportunity in Screenless Display Market
The screenless display market is witnessing a strong opportunity driven by shifting consumer preferences toward distraction-free, health-focused devices. As users move away from traditional smartwatches with constant notifications and large screens, minimalist wearables are gaining popularity for their simplicity, comfort, and long battery life. Devices that can seamlessly track metrics, such as sleep, activity, and heart rate without requiring subscriptions or visual interfaces are increasingly appealing. This market trend is fostering innovation in compact form factors, energy-efficient sensor technology, and AI-powered health insights. Screenless wrist-worn devices and smart rings are emerging as ideal solutions for consumers seeking wellness support without digital noise, opening the door for brands to expand into a rapidly evolving segment of wearable technology.
Garmin Rival Polar to introduce screenless fitness wearable on September 3, 2025, Screenless health and activity tracking on wrist with no subscription, Fitness-focused wearables go minimalist.
Challenges:
-
Complex Integration and User Adaptation Challenges Slow Screenless Display Market Advancement
The screenless display market faces key challenges that hinder its broader adoption. The high processing power and multiple system compatibility required for integrated advanced technologies, such as AR glasses and holographic projections has driven up the sphere market cost. Similarly to the shortcomings present in hardware and sponsor tech, many users have increased adaptation challenges from the uncharacteristic interfaces of the platforms, lack of reactive controls, and eye strain/discomfort if using present day headset in an extended manner.
Furthermore, absence of unified platforms and interoperability of content hinders ecosystem development. It makes it more prohibitive barring its high production cost and its low battery accessibility, especially in the case of wearables. In healthcare, automotive, and defense, even regulatory concerns become a roadblock as safety and compliance standards are very high. The confluence of these limited factors leads to friction in the commercialization of the technology, where innovation, product affordability, and user education are three key areas in which family businesses will need work and collaboration to ensure the future sustainability of the market.
Screenless Display Market Segmentation Outlook:
By Technology
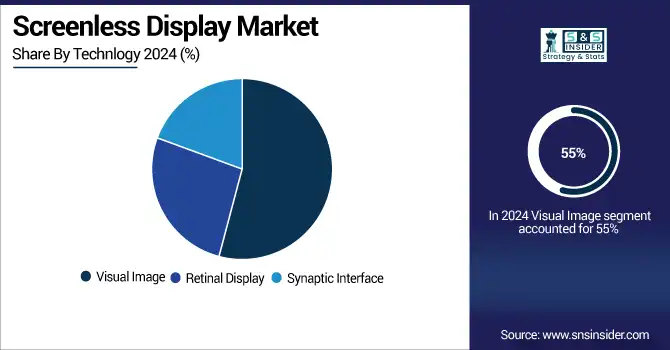
In 2024, the Visual Image segment accounted for approximately 55% of the screenless display market share, which is expected to be driven by the combination of screenless displays with AR/VR devices, head-up displays, and holographic projections. The dominance comes from its ease of building, cheap, and consumer electronics friendly. With the increasing need for immersive, interactive visual experiences across industries, this segment remains dominant.
The Retinal Display segment is expected to experience the fastest growth in screenless display market over 2025-2032 with a CAGR of 31.47% This growth is driven by the rising need for ultra-immersive eye-projected displays for healthcare, military and next-gen wearable device applications. The continual improvements in micro-projection and eye-tracking technologies are increasing the accuracy, reducing the form-factors and complexity of retinal displays, and facilitating the widespread adoption of retinal displays in specific and emerging applications.
By Application
In 2024, the Augmented Reality segment accounted for approximately 49% of the screenless display market share, driven by its widespread adoption in automotive HUDs, smart wearables, and industrial applications. The segment’s dominance reflects growing demand for real-time, interactive visual overlays in both consumer and enterprise settings. AR’s integration with AI and IoT further enhances its value, solidifying its lead in the screenless technology space.
The Virtual Reality segment is expected to experience the fastest growth in screenless display market over 2025-2032 with a CAGR of 34.00% increasing adoption of VR in gaming, simulation training, education, and remote collaboration are driving its application at a global level. Continuous tech-shift toward making immersive content delivery, motion tracking and spatial computing more affordable, accessible and realistic is propelling consumer and enterprise demand in VR systems.
By Display Type
In 2024, the Head-Up Display (HUD) segment accounted for approximately 43% of the screenless display market share, driven by its strong adoption in the automotive and aviation sectors. HUDs enhance safety and user experience by projecting critical information directly within the user’s line of sight. Increasing demand for connected vehicles and advanced driver assistance systems (ADAS) continues to support the segment’s market dominance and integration into next-gen mobility platforms.
The Implantable and Wearable Micro-Projectors segment is expected to experience the fastest growth in the screenless display market over 2025-2032 with a CAGR of 40.15% This growth is driven the rising demand for ultra–portable immersive display solutions in healthcare, defense and consumer electronics. Miniaturization, power-efficient processing, and AR integration are making them ready for more users, particularly those who want to interact with the web without touchscreen or screen interaction, with hands free, for a more integrated digital experience
By End-Use
In 2024, the Automotive segment accounted for approximately 39% of the screenless display market share, primarily due to the rising adoption of Head-Up Displays (HUDs) and augmented reality systems in vehicles. Automakers are increasingly integrating screenless technologies to enhance driver safety, navigation, and user experience. The demand is further fueled by advancements in autonomous driving, connected vehicles, and premium in-car infotainment systems that prioritize distraction-free, immersive displays.
The Consumer Electronics segment is expected to experience the fastest growth in screenless display market over 2025-2032 with a CAGR of 36.59%, due to rapidly increasing demand for immersive technology in AR/VR devices supports, smart wearables, and smartphones. Growth of consumer demand for distraction-free, technologically-advanced, and lightweight visual solutions is driving adoption with a heightened uptake among tech-savvy users. The segment growth is further propelled by miniaturization and wireless connectivity advancements.
Screenless Display Market Regional Analysis:
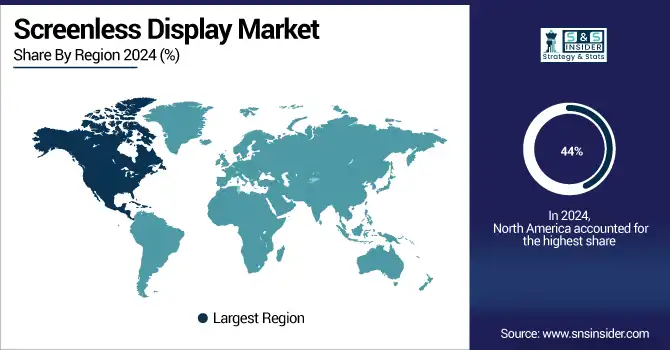
In 2024 North America dominated the Screenless Display market and accounted for 44% of revenue share. Robust investment in AR/VR technologies, clustering of tech giants, and early adoption of AR/VR in the automotive, defense, and consumer electronics industries have contributed to this leadership. The region also remained on the top due to strong R&D activities, increasing presence for immersive user experience and strong government support for advance display technology innovations.
Asia-Pacific is expected to witness the fastest growth in the Screenless Display market over 2025-2032, with a projected CAGR of 26.53% This growth is fueled by rapid technological advancements, rising investments in consumer electronics and automotive sectors, and increasing demand for immersive and compact display technologies. Expanding manufacturing capabilities and strong government support for innovation also position the region as a key growth hub in the forecast period.
In 2024, Europe emerged as a promising region in the Screenless Display market, due to growing adoption of advanced technologies in sectors, such as automotive, healthcare, and aerospace. Increased R&D investments, supportive regulatory frameworks, and rising demand for innovative user interfaces are contributing to market expansion. Countries including Germany, France, and the U.K. are at the forefront, fostering innovation and accelerating regional growth in screenless display applications.
LATAM and MEA are experiencing steady growth in the Screenless Display market, due to increasing digital adoption across various domains, investments in consumer electronics, and expanding Automotive and Healthcare infrastructure. Though still at the emerging markets portion of their life cycle, rising awareness of advanced display technologies along with national innovation initiatives are supporting slowly increasing adoption. There is significant momentum coming from Brazil, UAE, and South Africa which is driving regional demand for screenless solutions.
Get Customized Report as per Your Business Requirement - Enquiry Now
Screenless Display Companies are:
The Key Players in Screenless Display market are Avegant, RealView Imaging Ltd., Microsoft Corporation, Magic Leap Inc., Synaptics Incorporated, Holoxica Ltd., EON Reality Inc., Leia Inc., Sony Corporation, Sightful, Alphabet Inc., Vuzix Corporation, MicroVision Inc., Meta Platforms Inc., Dispelix, Mojo Vision, Himax Technologies Inc., Samsung Electronics Co. Ltd., Seiko Epson Corporation, Qualcomm Technologies Inc., and Others.
Recent Developments:
-
In June 3, 2024, Sightful unveiled the Spacetop G1, a laptop that ditches traditional screens in favor of AR glasses projecting a 100-inch virtual display. Priced at USD 1,700 for pre-order, the device is designed for productivity, especially in space-constrained environments including airplanes, offering users an immersive, portable, and private computing experience.
| Report Attributes | Details |
|---|---|
| Market Size in 2024 | USD 4.1 Billion |
| Market Size by 2032 | USD 23.70 Billion |
| CAGR | CAGR of 24.59% From 2025 to 2032 |
| Base Year | 2024 |
| Forecast Period | 2025-2032 |
| Historical Data | 2021-2023 |
| Report Scope & Coverage | Market Size, Segments Analysis, Competitive Landscape, Regional Analysis, DROC & SWOT Analysis, Forecast Outlook |
| Key Segments | • By Technology(Visual Image, Retinal Display, Synaptic Interface) • By Application(Augmented Reality, Virtual Reality, Consumer Electronics, Others) • By Display Type(Head-Up Display (HUD), Head-Mounted Display (HMD), Holographic Projection Kiosks, Implantable and Wearable Micro-Projectors) • By End Use(Consumer Electronics, Aerospace & Defense, Healthcare, Automotive and Others) |
| Regional Analysis/Coverage | North America (US, Canada), Europe (Germany, UK, France, Italy, Spain, Russia, Poland, Rest of Europe), Asia Pacific (China, India, Japan, South Korea, Australia, ASEAN Countries, Rest of Asia Pacific), Middle East & Africa (UAE, Saudi Arabia, Qatar, South Africa, Rest of Middle East & Africa), Latin America (Brazil, Argentina, Mexico, Colombia, Rest of Latin America). |
| Company Profiles | The Screenless Display market companies are Avegant, RealView Imaging Ltd., Microsoft Corporation, Magic Leap Inc., Synaptics Incorporated, Holoxica Ltd., EON Reality Inc., Leia Inc., Sony Corporation, Sightful, Alphabet Inc., Vuzix Corporation, MicroVision Inc., Meta Platforms Inc., Dispelix, Mojo Vision, Himax Technologies Inc., Samsung Electronics Co. Ltd., Seiko Epson Corporation, Qualcomm Technologies Inc. and Others. |
Frequently Asked Questions
Asia-Pacific dominated the Screenless Display Market in 2024.
The “Visual Image” segment dominated the Screenless Display Market
Rising demand for immersive and portable display technologies across automotive, healthcare, and consumer electronics is driving the screenless display market.
The Screenless Display Market size was valued at USD 4.1 Billion in 2024 and is projected to reach USD 23.70 Billion by 2032
The Screenless Display Market is expected to grow at a CAGR of 24.59% during 2025-2032.
Get in Touch
