Processor Intellectual Property (IP) Market Size & Growth:
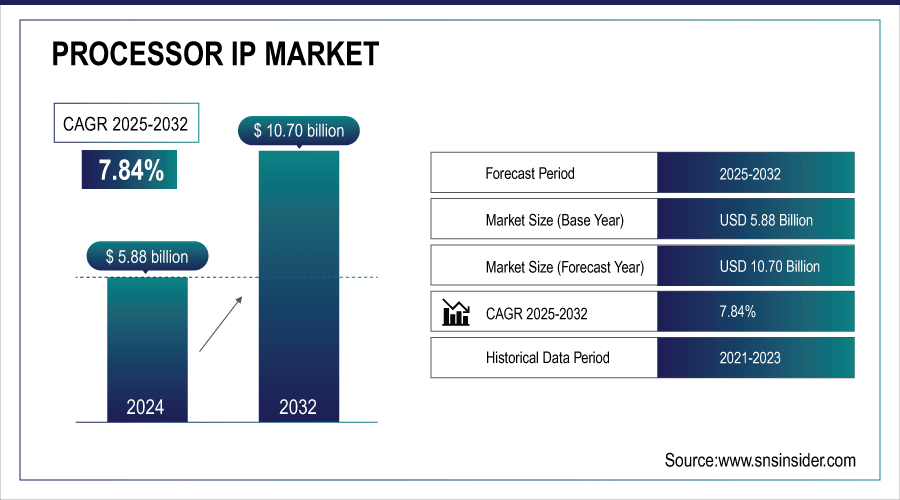
The Processor IP Market size was valued at USD 5.88 billion in 2024 and is expected to reach USD 10.70 billion by 2032 and grow at a CAGR of 7.84% over the forecast period of 2025-2032.
The global Processor Intellectual Property (IP) Market is analyzed through complete segmentation by type, application, processor type, and end-user, and regions along with competitive landscape and tech advancements included on the side. Its growth is driven by increasing demand for high performance computing, AI process integration, and SoCs, backed by steady innovations in processor architectures. Moreover, the heightened demand for tailored, application-specific IP cores from various industries is further fueling adoption, providing a growth trajectory for the processor IP market for the rest of the forecast period. This comprehensive processor IP market analysis highlights emerging opportunities and competitive positioning globally.
For instance, adoption of advanced processor IP security modules has risen by 38%, strengthening protection against cyber threats in embedded systems.
To Get More Information On Processor IP Market - Request Free Sample Report
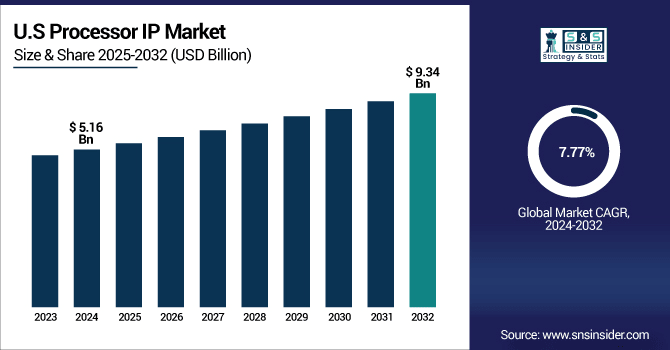
The U.S. processor IP market size was USD 5.16 billion in 2024 and is expected to reach USD 9.34 billion by 2032, growing at a CAGR of 7.77% over the forecast period of 2025–2032.
The U.S. market is fueled by global semiconductor leaders, extensive R&D expenditures, and high demand in automotive, consumer electronics, and industrial markets. The country also reaps the rewards from the early adoption of the new processor architectures, many of the government support systems designed with the intent of creating semiconductor manufacturing at home, and leadership in applications for AI and IoT. Strong innovation pipelines continue driving sustained processor IP market growth across diverse technology sectors. These elements, among others, work together to establish the U.S. as a global leader in processor IP innovation, commercialization, and global competitiveness.
For instance, the U.S.-developed processor IP achieves up to 30% higher computational efficiency, enhancing performance in AI, automotive, and industrial applications.
Processor Intellectual Property Market Dynamics:
Key Drivers:
-
Increasing Demand for High-Performance and Energy-Efficient Processing Solutions Across Multiple Industries Boost Market Growth
Automotive, AI, IoT, and consumer electronics are driving increasing need for high-performance low-power processor IPs, which is shifting demand to higher performance portfolio segments. These sectors depend on IP cores that provide tailored performance while consuming less power ensuring devices have more battery life, and meeting environmental requirements for many countries. With continuous innovations in semiconductor technologies and architecture design, IP vendors are now capable of delivering application-specific processors that offer improved efficiency and faster time-to-market. The trend toward application-based efficient processors is driving up adoption in various verticals boosting steady growth in global process IP market.
For instance, next-gen low-power processor IP designs reduce energy consumption by up to 35%, extending battery life in IoT and consumer electronics devices.
Restraints:
-
High Complexity and Development Cost of Advanced Processor IP Designs May Impede Market Growth
There is a huge amount of complexity involved in designing modern processor IP cores that it takes a lot of time and money in terms of R&D, specific design tools and vastly talented engineers. And, moving to smaller process nodes, that is, 5nm and below, adds more design complexity, resulting in higher cost and longer time to market. Such a high barrier keeps smaller companies away from the game and slows time-to-market for new IP solutions. Furthermore, the integration of high-performance processor IPs inside complex SoCs typically has development and validation costs that slow down innovation cycles for cost-sensitive market segments.
Opportunities:
-
Expanding Adoption of RISC-V and Open-Source Processor Architectures Can Boost Growth Opportunities
The rise of RISC-V and other open-source processor architectures signifies a tremendous opportunity for IP vendors to innovate and offer new features. The benefits of flexibility, cost savings, customizability, and market segmentation have appealed to startups, academic institutions, and leading semiconductor concerns, which have adopted these architectures. Processing IP at open-source may not only accelerate innovation but also allow rapid prototyping and building reliable collaborative development ecosystems. Emerging processor IP market trends reflect growing adoption of open-source architectures. By providing value-added services, proprietary extensions, and supported integration, vendors are able to create new revenue streams and expand into higher growth emerging markets where price and flexibility are key competitive advantages.
For instance, open-source processor IP can reduce prototyping time by up to 35% compared to proprietary solutions.
Challenges:
-
Rapid Technological Changes Increasing the Risk of Product Obsolescence Can Challenge Market Expansion
Semiconductor technology is evolving quickly, and the architecture of processor IP designs may become obsolete in short cycles and continuous innovation is essential. It is difficult for vendors as they must pour significant resources into R&D to match advancements, such as smaller process nodes, new instruction sets and specialized acceleration capabilities. The need for constant change not only drives up operational costs, but also places high demands for engineering talent. Companies that are unable to pivot quickly enough risk ceding their competitive advantage to others, especially at a time when customers are demanding next generation IP solutions which provide higher performance, energy efficiency and integration flexibility.
Processor IP Market Segmentation Overview:
By Type
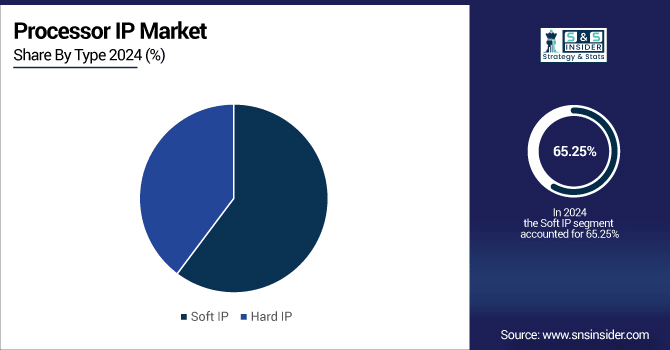
In 2024, Soft IP accounted for the largest share of about 65.25%, which reflects strong market demand for this category of IP. The growth is stimulated by the flexibility, ease of integration, and lower development costs. Thus, this segment is highly preferable in SoC design as it allows rapid customization and adaptation for a wide range of applications in the consumer electronics, automotive, and industrial automation, among others. Features for licensing, modifying, and optimizing designs without intrinsic constraints make Soft IP a prevalent choice for many enterprises intending to keep the development cycles high with high performance and efficiency in various markets.
Hard IP is expected to register the fastest CAGR of 8.12% during 2024-2032 as it offers superior performance, lower risk, and optimized power efficiency. Nowadays, this segment is mainly used in high-speed applications with notable reliability requirements, which include automotive safety systems, AI accelerators, data center processing, and many others. With such predesigned and silicon-proven IP, firms can decrease time-to-market for essential products and always ensure stability and top-level performance consistency associated with top operational requirements. Thus, the Hard IP type will embrace the performance over the tenure investigated across an increasing number of industries demanding unparalleled operational stability.
By Application
In 2024, Consumer Electronics held the largest share of about 35.20%, and the market’s prospects are positive. The growth is encouraged by strong demand for advanced processors in smartphones, tablets, gaming consoles, smart homes, and others. Strong demand for efficient and customized processor IP is motivated by the fact that products are gaining in AI capabilities, acquiring more immersive media options, and equip higher resolution displays. It is also important to note that the segmentation will be boosted by continuous innovations in the realm of portable and wearable electronics as firms will strive to ensure consistent performance, longer battery life, and other advantages in increasingly smaller proportions.
Automotive is expected to grow at the highest CAGR of 9.30% during 2024–2032 due to the need for rapid adoption of ADAS, autonomous driving technology, and in-vehicle infotainment. Electric and connected vehicles need high-performance and low-power processors for real-time data processing. Key building blocks for driving safety solutions, intelligent decision-making, and connected capabilities, processor IP are integral components of next-gen automotive architectures for future mobility solutions in markets globally.
By Processor Type
CPU captured 35.20% of the market in 2024 due to its role as a general-purpose computing workhorse and ability to perform broad workloads. This widespread usage is not without reason, as it has been thoroughly adopted in consumer electronics, automotive control systems, industrial automation and communication devices. The combination of performance, versatility and cost makes CPU an essential processing element in millions of products. Their market leadership is sustained through continuous architectural enhancements and compatibility with a wide array of software ecosystems.
GPU would exhibit the fastest CAGR of 9.30% during 2024-2032, due to the rising demand for parallel processing capabilities for the efficient operation of AI, machine learning, gaming, and data visualization. GPU stands for graphic processing unit, which is a crucial accelerator that aids in the efficient processing of complex workloads, such as image processing, 3D rendering and neural network training. With these AI applications growing within industries such as healthcare, automotive and robotics, performance acceleration with a continued focus on energy efficiency is creating a demand for processor IP in GPUs.
By End-User
The OEMs segment accounted for largest processor IP market share of 50.24% in 2024 owing to the company's involvement in directly tying processor IP to the end product. OEMs rely on processor IP to build differentiated and high-performance solutions that respond to consumer needs in automotive, electronics, industrial, and telecom markets. OEMs keep the competitive advantage by ensuring that processor IP technologies are adopted to supply innovative, ready-to-market solutions globally by controlling product design and product manufacturing to optimize performance and development cycles.
The semiconductor companies are expected to grow at 8.68% CAGR over 2024–2032, owing to rising need for advanced system on chip processor in terms of its designing, developing, and licensing of processor IP related to applications. Moreover, these companies are leveraging high demand for energy-efficient, application-specific and AI-optimised processors. As semiconductor firms continue to advance their custom processor fabrications technologies, combined with OEM and software developers rapid partnering initiatives, they are enabled to offer tailor made processor IP supporting the latest requirements for emerging markets and next-generation product ecosystems.
Processor Intellectual Property (IP) Market Regional Analysis:
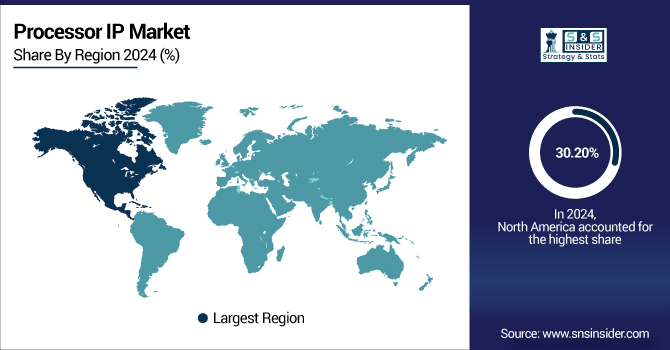
In 2024, North America led the market with a 30.20% share owing to the presence of global leading IP providers, advanced R&D capabilities, and early adoption of latest processor architectures. This is driven by a solid semiconductor manufacturing ecosystem, public funding of technological progress, and strong industrial demand in consumer electronics, automotive, and aerospace sectors. All of these factors combined put North America in a stronger position for providing next-generation and high-performance processor IP solutions into global markets.
Get Customized Report as per Your Business Requirement - Enquiry Now
-
The U.S. dominates the North American processor IP market due to its strong semiconductor ecosystem, leading global IP providers, advanced R&D capabilities, and rapid adoption of emerging technologies across automotive, consumer electronics, AI, and high-performance computing applications.
The Asia Pacific region is expected to be the fastest-growing regional market with a CAGR of 9.23% during 2024–2032, owing to the high speed of industrialization, growing consumer electronics, and various government-led schemes to support domestic semiconductor manufacturers. With its flourishing automotive and telecom industries, and a larger role for the region in AI and IoT adoption, the demand for advanced processor IP is strong. Asia Pacific is one of the most important regions for the global processor intellectual property (IP) market, benefitting from competitive manufacturing costs and the development of emerging technology hubs.
-
China leads the Asia Pacific processor IP market driven by massive semiconductor manufacturing capacity, government-backed innovation programs, expanding consumer electronics production, and strong demand for AI, IoT, and 5G-enabled devices across domestic and export-oriented technology industries.
Europe has a solid IP industry base and vertically-integrated automotive manufacturing and higher penetration of AI and IoT technologies than most other regions. Innovation in the region is spurred through joint R&D in countries including Germany, the U.K., and France, while growing semiconductor design activities and government programs to accelerate digital transformation further strengthen the position of the region in high-performance and application-specific processor IP solutions.
-
Germany leads the European Processor IP market due to its robust semiconductor industry, advanced automotive sector, and strong R&D focus. Collaboration between tech firms and research institutions fuels innovation, ensuring its dominance in high-performance and application-specific IP solutions.
The UAE leads in the Middle East & Africa with high volume semiconductor investments along with strategic tech partnerships with Japan and the U.S. and well-developed smart city infrastructures also provides a clear growth trajectory for UAE semiconductor market. Brazil holds leading position in the processor IP industry in Latin America due to strong electronics manufacturing base, government policies in favor of electronics manufacturing, and growing use of embedded systems with AI capabilities.
Processor Intellectual Property (IP) Companies are:
Major Key Players in Processor IP Market are Arm Holdings, Synopsys Inc., Cadence Design Systems Inc., Imagination Technologies, CEVA Inc., MIPS Tech LLC, Andes Technology Corporation, SiFive Inc., Open-Silicon Inc., Verisilicon Holdings Co., Ltd., Wave Computing Inc., Xilinx Inc. (AMD), Intel Corporation, Samsung Electronics Co., Ltd., MediaTek Inc., Rambus Inc., NXP Semiconductors N.V., QuickLogic Corporation, Broadcom Inc., and Alphawave IP Group and others.
Recent Developments:
-
In July 2025, GlobalFoundries announced plans to acquire MIPS, incorporating its RISC-V and AI-focused processor IP into its portfolio, positioning itself as a compute solutions provider.
-
In June 2024, Synopsys launched the PCIe 7.0 IP solution (controller + PHY), offering ultra-fast interconnects for AI and HPC systems.
| Report Attributes | Details |
|---|---|
| Market Size in 2024 | USD 5.88 Billion |
| Market Size by 2032 | USD 10.70 Billion |
| CAGR | CAGR of 7.84% From 2025 to 2032 |
| Base Year | 2024 |
| Forecast Period | 2025-2032 |
| Historical Data | 2021-2023 |
| Report Scope & Coverage | Market Size, Segments Analysis, Competitive Landscape, Regional Analysis, DROC & SWOT Analysis, Forecast Outlook |
| Key Segments | • By Type (Soft IP and Hard IP) • By Application (Consumer Electronics, Automotive, Industrial, Telecommunications and Others) • By Processor Type (CPU, GPU, DSP and Others) • By End-User (OEMs, Semiconductor Companies and Others) |
| Regional Analysis/Coverage | North America (US, Canada, Mexico), Europe (Germany, France, UK, Italy, Spain, Poland, Turkey, Rest of Europe), Asia Pacific (China, India, Japan, South Korea, Singapore, Australia,Taiwan, Rest of Asia Pacific), Middle East & Africa (UAE, Saudi Arabia, Qatar, South Africa, Rest of Middle East & Africa), Latin America (Brazil, Argentina, Rest of Latin America) |
| Company Profiles | Arm Holdings, Synopsys Inc., Cadence Design Systems Inc., Imagination Technologies, CEVA Inc., MIPS Tech LLC, Andes Technology Corporation, SiFive Inc., Open-Silicon Inc., Verisilicon Holdings Co., Ltd., Wave Computing Inc., Xilinx Inc. (AMD), Intel Corporation, Samsung Electronics Co., Ltd., MediaTek Inc., Rambus Inc., NXP Semiconductors N.V., QuickLogic Corporation, Broadcom Inc. and Alphawave IP Group. |
Frequently Asked Questions
North America dominated the Processor IP Market in 2024.
The CPU segment dominated the Processor IP Market in 2024.
The major growth factor is rising demand for advanced processors in AI, automotive, and consumer electronics, driving semiconductor design innovation.
The Processor IP Market size was USD 5.88 Billion in 2024 and is expected to reach USD 10.70 Billion by 2032.
The Processor IP Market is expected to grow at a CAGR of 7.84% from 2025-2032.
Get in Touch
