Organic Coagulant Market Report Scope & Overview:
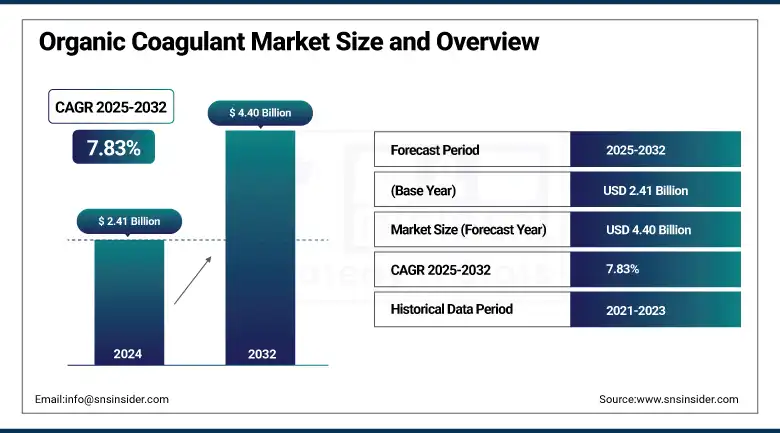
The Organic Coagulant Market size was valued at USD 2.41 billion in 2024 and is expected to reach USD 4.40 billion by 2032, growing at a CAGR of 7.83% over the forecast period of 2025-2032.
The increase in environmental concerns, stringent regulations for water & wastewater treatment, and the need for an inexpensive & sustainable solution to water treatment drive the organic coagulant market growth. Organic coagulants such as PolyDADMAC and polyamine are widely used for water treatment in municipal as well as industrial applications. Plant-based coagulants represent a key trend, with companies like Ecolab and Kemira Oyj driving innovation in this area. Such coagulants are being preferred due to their environmental benefits and toxicity free nature.
To Get more information On Organic Coagulant Market - Request Free Sample Report
This trend can be seen with the introduction of newer organic coagulants which are more effective such as recent innovations from USALCO and SNF Group. The changing demand in North America as well as stricter regulations in Europe are supporting the transition towards organic coagulants instead of traditional chemicals over the past few years thereby driving the market growth. As a result, the organic coagulants are going to find new opportunity and lucrative growth in the markets particularly in Asia pacific.
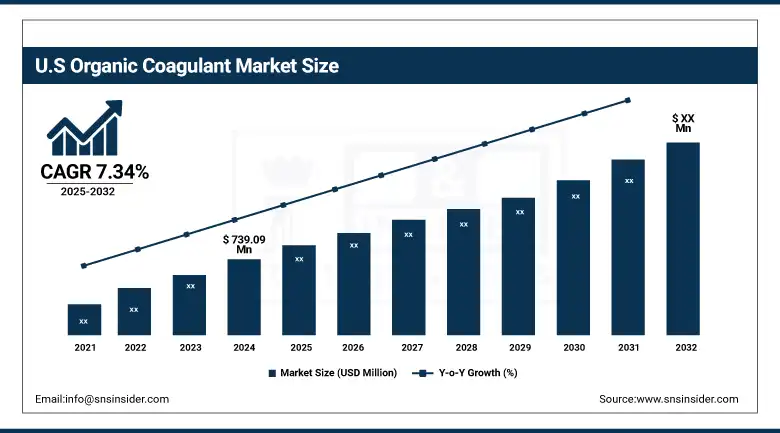
The U.S. organic coagulant market was led with a market size of USD 739.09 million, with a CAGR of 7.34% in 2024. With a growing number of water treatment firms with various sustainable technical solutions, companies such as Ecolab and Kemira are undertaking leadership positions and boosting the regional growth, and the U.S. Environmental Protection Agency (EPA) is acting as a supportive catalyst to the growth in the region. Urbanizing Canada over the same timeframe also demonstrates more growth for increasing demand in this market in the emerging water treatment space.
Organic Coagulant Market Dynamics
Drivers
-
Advancements in Biodegradable Polymer Research Boost the Efficiency of Organic Coagulants
The innovation of biodegradable polymers, particularly for water treatment application, has substantially improved the performance of organic coagulants. Recent research performed in 2023, on different types of rich natural biodegradable coagulants, showed that these coagulants can be effectively used to eliminate the micropollutants, in comparison to traditionally used methods as the coagulants originated from rich natural sources first performed coagulant on the water then removed the water. This has continued to trigger interest amongst sustainable water treatment solutions and boost heavy investments focused on its research and development. For instance, cosmetic biggies like Ecolab and Solenis have made advances in the development of superior biodegradable coagulants. Innovations not only enhance performance but also environment sustainability which makes organic coagulants a potential growth driver hence, driving the demand in the respective markets seeking green alternative.
-
Government Research Funding Accelerates the Growth and Innovation of Organic Coagulant Technologies.
Advancements in the organic coagulant technology has been majorly formulated through grants and funding provided by U.S. government. In the US, since 2021 it has been financed through different projects by agencies such as the USDA, new formulations of biodegradable coagulants have already been developed. This funding will aid in partnerships between our science and industry experts to advance more efficient, sustainable technologies. This has resulted in increased efficiency and commercial viability of organic coagulants, driving their market. This has already allowed these solutions to be ramped on a much larger scale than previously possible with federal support and become more competitive across a large set of industrial applications.
Restraints
-
The Persistence of Conventional Coagulants Hampers the Adoption of Organic Alternatives
Aluminum and iron salts are widely used inorganic coagulants, and still hold a dominating position despite the emergence of organic coagulants as their layer on an established infrastructure and lower cost efficiency has made it hard for others to penetrate. According to the U.S. Environmental Protection Agency (EPA) data from 2023, more than 60% of community water systems are still using outdated inorganic coagulants. This longstanding presence makes it extremely difficult for organic options to emerge. Despite the environmentally friendly nature of organic coagulants, which is driving their increasing popularity, the ability of organic coagulants to capture a larger market share has been restrained by the initial costs required to shift to these alternatives, along with the performance of traditional coagulants.
-
Unstable Agricultural Yields Threaten Consistency in Organic Coagulant Production
Plant based organic coagulants production are more linked with agricultural productions such as soy beans. Climate change has also driven up measures such as droughts in 2024 which impacted soybean yields and plugged up soybean supply chains. While the U.S. Department of Agriculture (USDA) indicated minor yield advancements, variations based on region lead to fluctuations. Since organic coagulant production generally depends on different raw materials by agriculture crops, any instability will be affecting cost and availability on organic coagulant. As a result, it limits the organic coagulant market growth, and they face uncertainty with the pricing & supply which directs manufacturers to modify their strategy to counter the disruption.
Organic Coagulant Market Segmentation Analysis
By Type
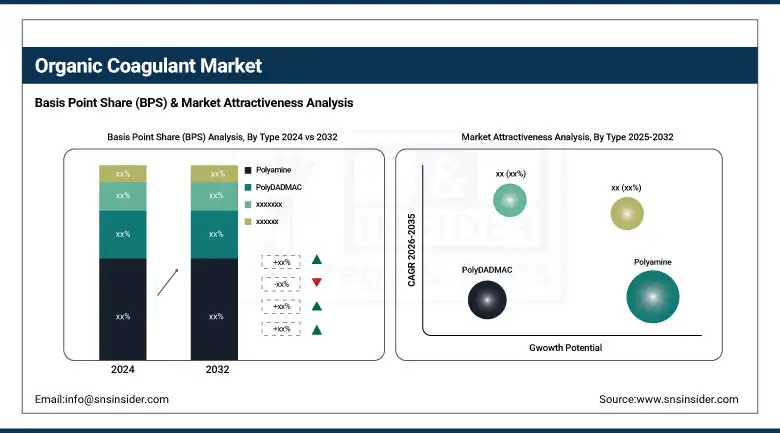
The organic coagulant market share was led by polyamine based organic coagulants, which captured 45% in 2024. This ascendancy is due to their use in most water treatment processes, to effectively remove suspended material and impurities. Polyamine coagulant is effective in treating industrial and municipal wastewater and are preferred for their cost-effective and reputable nature. Top line companies like Kemira Oyj and BASF SE have also introduced new advanced polyamine variants against the changing demand for water treatment chemicals in a sustainable and efficient way. In addition, rigid government rules on water quality have played an important role in the expansion of polyamine-based coagulants.
Among them, PolyDADMAC is expected to be witnessed the fastest growing segment during the forecasted period from 2025 to 2032 with a market share of over 34% in 2024. This growth derives from rising preference of more powerful, environment friendly coagulants especially for municipal water treatment. PolyDADMAC coagulants are well-suited for potable water treatment due to their high efficiency in reducing turbidity and organic impurities. Solenis, Ecolab, etc. are some companies focusing on developing specialized formulations of PolyDADMAC to cater to the increasing demand for quality water treatment on a global level.
By Application
The industrial water treatment held the largest organic coagulants market share of more than 62% in 2024. This factor is anticipated to fuel the growth of the industrial segment as their demand for wastewater treatment is increasing in chemical, mining and power generation industries. The subsegment where this aspect can be brought forward is the chemical industry where efficient treatment of water is required for production processes and for wastewater management. Some notable companies including Ecolab and Kemira are leading the way with innovations in coagulant solutions. In addition, government regulations on wastewater discharge are also the major factor driving the growth of industrial water treatment solution as with the help of these regulations standards for wastewater discharge are becoming stricter (which is required for environmental protection).
In contrast, municipal water treatment is expected to become the fastest-growing segment in the organic coagulant, collectively accounting for 38% of the market share in 2024 over the forecast period, 2025 to 2032. As governments have been allocating more and more funds to ensure better water quality and sanitation services, this segment is growing significantly. Additionally, drivers of urbanization and population increase are contributing to a growing demand for more sustainable water management approaches. More municipalities now using these organic coagulants for a greener, more effective and cheaper way of treating water. The increasing demand for pure drinking water backed by U.S. Environmental Protection Agency (EPA) regulations and regulations from other regulatory agencies around the world propels the demand and subsequently increases the organic coagulants demand from this segment.
Organic Coagulant Market Regional Outlook
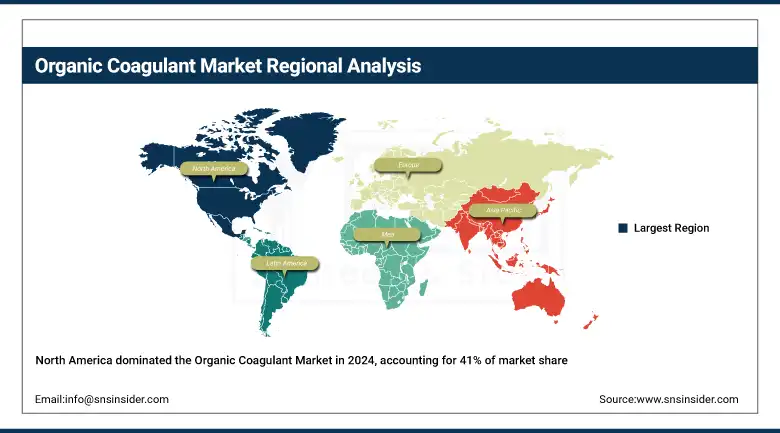
In 2024, North America accounted for the largest organic coagulant market share of about 41%. Such prevalence can be associated with the matured industrial structure and more stringent environmental regulations, which are spurring the demand for organic coagulants, particularly in industrial water treatment processes. High demand from chemical, pharmaceutical, and power generation industries for efficient wastewater treatment and the need to maintain compliance with stringent environmental regulations are factors contributing to the U.S upstaging the market.
Get Customized Report as per Your Business Requirement - Enquiry Now
Europe remains in second place, accounting for 30% of the market in 2024. Furthermore, increased focus on sustainability and environmental protection enhances the uptake of organic coagulants in municipal water treatment, especially in Europe. This growth is spearheaded by Germany and France, where strict EU regulations, including the Water Framework Directive, have set high requirements for wastewater treatment and water quality management. A perceived increase in demand for more environmentally friendly alternatives has fueled greater adoption of plant-based coagulants, which are being capitalized on by leading companies such as BASF with innovative solutions.
Asia Pacific, with a market share of 16%, emerged as the fastest-growing region in the organic coagulant market in 2024. The growth is attributed to the speedy industrialization and urbanization, and advancement in water infrastructure from increased government investment. In terms of volume growth, the major contributors to development are propelled by active large-scale municipal and industrial water treatment projects in China and India, which are leading the market for organic coagulants. Hence, the increased demand for wastewater treatment in textile, food & beverage, and chemical industries is particularly benefiting this region. China's National Environmental Protection Agency (NEPA) has introduced strict water discharge policies, adding to the demand for organic coagulants as part of a regional drive toward more sustainable water treatment practices.
Key Players
The major competitors of organic coagulant market include Kemira Oyj, SNF Group, BASF SE, Ecolab, Veolia, Kurita Water Industries Ltd., Baker Hughes Company, Solenis, USALCO, and Buckman
Recent Developments
-
In September 2024, the first industrial water treatment product of its kind to receive a Safer Choice certification from the U.S. EPA, Tidal Clear's TideForce coagulants meet the rigorous health and environmental criteria necessary to be certified as a Safer Choice product, rendering these products eco-friendly and biodegradable.
| Report Attributes | Details |
|---|---|
| Market Size in 2024 | USD 2.41 billion |
| Market Size by 2032 | USD 4.40 billion |
| CAGR | CAGR of 7.83% From 2025 to 2032 |
| Base Year | 2024 |
| Forecast Period | 2025-2032 |
| Historical Data | 2021-2023 |
| Report Scope & Coverage | Market Size, Segments Analysis, Competitive Landscape, Regional Analysis, DROC & SWOT Analysis, Forecast Outlook |
| Key Segments | •By Type (Polyamine, PolyDADMAC, Others) •By Application (Municipal water treatment, Industrial water treatment [Textile, Food & beverage, Pulp & paper, Chemicals & fertilizers, Oil & gas, Mining & mineral processing, Others] |
| Regional Analysis/Coverage | North America (US, Canada, Mexico), Europe (Germany, France, UK, Italy, Spain, Poland, Turkey, Rest of Europe), Asia Pacific (China, India, Japan, South Korea, Singapore, Australia, Rest of Asia Pacific), Middle East & Africa (UAE, Saudi Arabia, Qatar, South Africa, Rest of Middle East & Africa), Latin America (Brazil, Argentina, Rest of Latin America) |
| Company Profiles | Kemira Oyj, SNF Group, BASF SE, Ecolab, Veolia, Kurita Water Industries Ltd., Baker Hughes Company, Solenis, USALCO, Buckman |
Frequently Asked Questions
North America led the Organic Coagulant Market in 2024 with 41% share, owing to strict EPA rules and strong industrial water treatment demand.
The Organic Coagulant Market sees growing municipal use due to increased funding, urbanization, and EPA-backed sustainability regulations for clean drinking water.
Polyamine coagulants led the Organic Coagulant Market in 2024 with a 45% share due to their cost-effectiveness and broad municipal and industrial applications.
The Organic Coagulant Market is expected to grow at a CAGR of 7.83% from 2025 to 2032, driven by rising environmental concerns and stricter regulations.
The Organic Coagulant Market was valued at USD 2.41 billion in 2024, showing strong global demand for sustainable water treatment alternatives.
Get in Touch
