Parametric Insurance Market Report Scope and Overview:
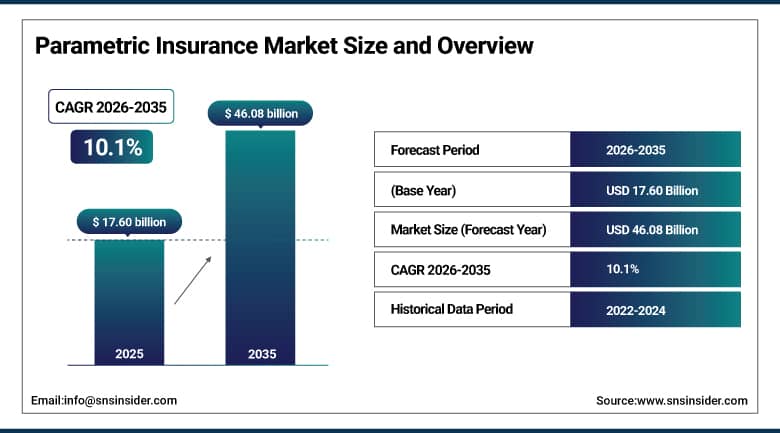
The Parametric Insurance Market Size was valued at USD 17.60 Billion in 2025 and is expected to reach USD 46.08 Billion by 2035 and grow at a CAGR of 10.1% over the forecast period 2026-2035.
Parametric insurance markets are thriving, providing fast data-triggered payouts on measurable peril episodes (like weather or disasters). It does not require a proof of loss, as does conventional insurance, so it is also lighter on the paperwork. Growing climate risk insurance and recovery urgency are driving adoption by agriculture, energy, and property. The cloud-based, hybrid, and on-premises deployment models, enhanced accessibility, with industry giants AXA, AIG, and Allianz providing tailored solutions.
For example, AXA’s heatwave parametric insurance product automatically pays out if temperatures hit a certain level, benefiting those working outside. Similarly, Allianz’s parametric insurance cover for cyclone risks in vulnerable regions, also underpinned by satellite data, results in quick completion of financial payments and demonstrates how insurance innovation delivers value.
Parametric Insurance Market Size and Forecast:
-
Market Size in 2025: USD 17.60 Billion
-
Market Size by 2035: USD 46.08 Billion
-
CAGR (2026–2035): 10.1%
-
Base Year: 2025
-
Forecast Period: 2026–2035
-
Historical Data: 2022–2024
To Get More Information On Parametric Insurance Market - Request Free Sample Report
Parametric Insurance Market Highlights:
-
Climate Related Demand Increasing frequency and intensity of natural disasters including hurricanes, floods, and droughts boost demand for fast, trigger-based claims
-
Faster Claims Settlement Parametric insurance allows immediate payouts based on predefined triggers such as wind speed, rainfall, or temperature without traditional damage inspections
-
Market Restraints Limited awareness and understanding of parametric insurance among policyholders slows adoption and requires customer education initiatives
-
Technological Opportunities Integration of satellite data, IoT sensors, and big data analytics enables accurate trigger identification and claim processing across diverse scenarios
-
Expanded Applications Parametric insurance is extending beyond traditional sectors to renewable energy, infrastructure, and underdeveloped markets exemplified by Allianz's satellite enabled flood insurance pilot in Ghana
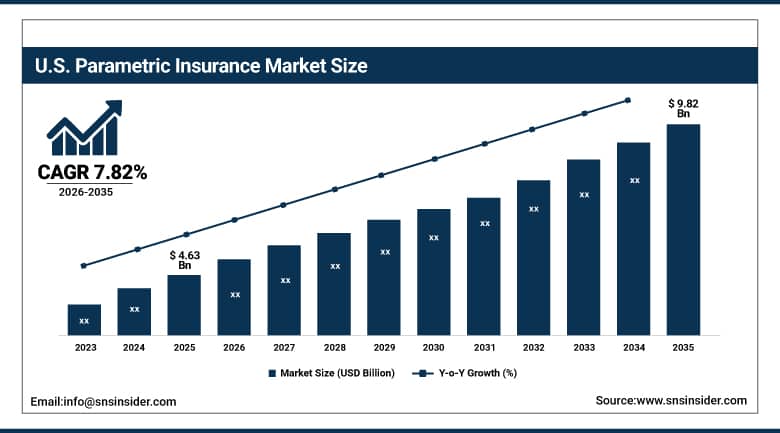
The U.S. Parametric Insurance Market size was USD 4.63 billion in 2025 and is expected to reach USD 9.82 billion by 2035, growing at a CAGR of 7.82%. The U.S. has the largest share in the parametric insurance market due to advanced tech infrastructure, high insurance penetration, and high risks from climatic conditions. Frequent occurrences of natural calamities increase the need for quick settlement of claims through parametric models. Advanced partnerships between tech and insurance companies, coupled with the use of timely data and regulations, have made the U.S. a global leader in expanding parametric insurance in all sectors.
Parametric Insurance Market Drivers:
-
Rising Climate Disasters and Weather Volatility Drive Global Demand for Parametric Insurance
In the parametric insurance market growth increasingly frequent and intense climate-related events, including hurricanes, floods, and droughts, have spurred demand for faster and more robust insurance payouts. Parametric insurance provides an answer using predefined triggers wind speeds or rainfall levels, for immediate claims settlement, with no inspections of traditional damage. The impact is particularly important for disaster-prone areas, in which traditional insurance can take weeks, months, or even longer to pay out claims.
For instance, when the temperature rises above certain levels, AXA’s heatwave parametric solution in Hong Kong automatically triggers, providing compensation to outdoor workers, demonstrating again how products like this are not theoretical, but very practical.
Parametric Insurance Market Restraints:
-
Limited Awareness and Understanding of Parametric Insurance Concepts Among Policyholders Hinder Market Expansion Efforts
The benefits of parametric insurance are clear, its penetration is held back by low awareness and understanding among potential customers. Several policyholders do not understand the principle of trigger-based losses and how these are different from traditional indemnity cover. This missing information can result in skepticism, lower acceptance, or misunderstandings about the veracity or fairness of such systems. Carriers and brokers will need to spend time educating customers to understand how parametric covers operate, especially in areas/industries that are less comfortable with progressive risk transfer options.
Parametric Insurance Market Opportunities:
-
Integration of Satellite, IoT, and Big Data Analytics Offers Lucrative Expansion Opportunities for Parametric Insurance Providers
It’s the rapid confluence and evolution of these technologies alongside satellites, IOT sensors and big data analytics which is creating enormous potential within the parametric insurance landscape. These technologies permit insurers to collect real-time data, set accurate triggers, and settle claims in many situations that range between failed crops and seismic activity. A capacity to go beyond standard parametric insurance to include new fields, like renewable energy and infrastructure development.
For example, Allianz’s satellite-enabled flood insurance pilot in Ghana relies on geospatial information to trigger automatic payouts, illustrating the transformative nature of tech-enabled parametric models in underdeveloped markets.
Parametric Insurance Market Segments:
-
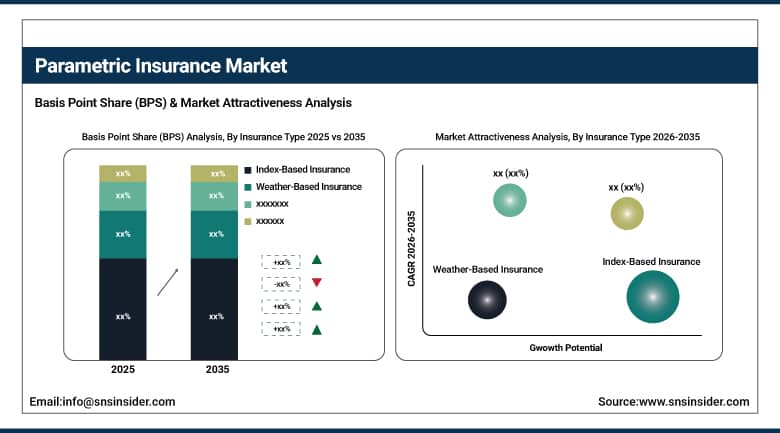
By Insurance Type: In 2025, Index-Based Insurance dominated with 35% share; Weather-Based Insurance fastest growing segment during 2026-2035
-
By Application: In 2025, Agriculture dominated with 32% share; Energy fastest growing segment during 2026-2035
-
By Deployment Model: In 2025, Cloud-Based dominated with 46% share; On-Premise fastest growing segment during 2026-2035
-
By Use Case: In 2025, Risk Mitigation dominated with 42% share; Catastrophe Response fastest growing segment during 2026-2035
Parametric Insurance Market Segment Analysis:
By Insurance Type: Index-Based Insurance Dominates, Weather-based Insurance Fastest-Growing
The Index-Based Insurance segment accounted for the largest share of revenue in 2025 (35%) since it is easier to implement and scale, and provide cover to larger at-risk populations. The concept of the index is such that companies like Swiss Re and AXA have introduced innovative index-linked policies in areas especially like agriculture and catastrophe prone regions. For example, AXA Climate's parametric agriculture policy provides index-based payouts based on satellite-monitored drought and rainfall data.
The segment for Weather-based Insurance is growing at a CAGR of 12.3% throughout the forecast as volatility in weather conditions and need for instant financial risk protection rises. Chubb and Munich Re have launched tailored weather-based policies that use historical and predictive data to shield businesses from the effects of climate variation.
By Application: Agriculture Dominates, Energy Fastest-Growing
Agriculture segment was the dominant revenue contributor with a 32% share in 2025, as parametric insurance delivers fast financial assistance to farmers suffering from drought, floods or severe climate related events. Index-based agricultural insurance has been developed in Africa and Asia by companies like Swiss Re or the World Bank, based on triggers of rainfall or NDVI (vegetation index). These tools enable timely payouts without having to make field inspections.
The Energy segment is projected to register the highest CAGR (11.9%) over the forecast period due to increasing climate risk to renewable energy projects. Munich Re and Lloyd’s have created parametric wind and solar insurance to guard against low generation days or too much
By Deployment Mode: Cloud-Based Dominates, On-Premise Fastest-Growing
Based on product type, the Cloud-Based segment contributed to the major share of the parametric insurance market in 2025, with a 46% share, owing to increase in demand for scalable real-time insurance systems. Entities such as AXA Climate and Aon are using cloud for worldwide parametric insurance programs with instant data analytics and trigger claims automation. This market segment helps to facilitate the parametric insurance market by increasing operational efficiency and allowing insurers to offer broader coverage options in these climate-sensitive areas with limited infrastructure.
The On-Premise segment is leading the highest CAGR of 12.31% during (2026 – 2035) followed by the Heightened security and compliance requirements such as defense, utilities, finance etc. Companies such as Berkshire Hathaway Specialty Insurance are spending on bespoke, on-premises parametric platforms for sensitive data environments.
By Use Case: Risk Mitigation Dominates, Catastrophe Response Fastest-Growing
According to the use case, the Risk Mitigation segment has contributed to the significant share of the parametric insurance market in 2025, with an estimated 42% share, due to the increased need for businesses and governments to mitigate risks from climate-related and operational risks. Organizations in agriculture, infrastructure, and energy sectors are increasingly adopting parametric insurance policies to mitigate financial risks from occurrences like drought, hurricanes, and floods. Insurance companies like Swiss Re and Munich Re are providing advanced risk mitigation products with satellite data and predictive analytics.
The Catastrophe Response segment is expected to register the highest CAGR of 11.8% during the forecast period of 2026-2035. This is due to the increase in the number of extreme weather events and the need for prompt recovery funding. There is an increase in the use of parametric triggers by governments and insurance companies to ensure prompt payments. There are projects being initiated by the World Bank and the African Risk Capacity that show the adoption of parametric catastrophe responses.
Parametric Insurance Market Regional Analysis:
North America Parametric Insurance Market Trends:
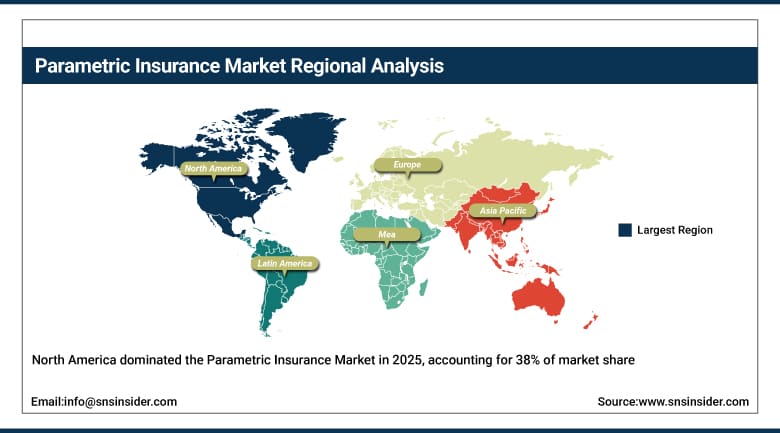
North America is projected to account for the largest parametric insurance market share of 38% in the Parametric Insurance Market during the forecast period, with the U.S. being the leading country. The region is dominated by a very developed technology infrastructure, a high level of adoption of new insurance solutions, and increasing risk from severe weather events, including hurricanes and wildfires. U.S. insurers, including Axa and Aon, are turning to parametric products instead of traditional insurance as they cut claims-processing time and limit risk exposure, meaning that Asia is the market that's turning heads.
Get Customized Report as Per Your Business Requirement - Enquiry Now
Asia-Pacific Parametric Insurance Market Trends:
The Asia Pacific is expected to grow at the highest CAGR is 14.8% in the market in 2025. India, China, Japan, among other nations, have increasingly been more and more open to disruptive innovation as they find themselves more susceptible to the effects of climate change, including floods, droughts, and typhoons. India is a dominating country in the Asia Pacific Parametric Insurance Market due to its high exposure to climate-related disasters like floods and droughts. To protect rural livelihoods, the government and insurers are adopting index-based solutions for faster payouts. Initiatives such as RARM use weather and satellite data to deliver quick, data-driven compensation to affected farmers.
Europe Parametric Insurance Market Trends:
Europe is predicted to continue with substantial growth in the Market in 2025, along with added focus on offering more effective risk management solutions across agricultural, energy, and infrastructure. Germany dominates the Parametric Insurance Market due to its strong insurance ecosystem, advanced technological infrastructure, and proactive climate risk management strategies.
In march 2024, Munich Re has developed parametric products that utilize weather stations and satellite data to provide immediate payouts for events like floods or hailstorms, reducing claims processing time.
Latin America and Middle East & Africa Parametric Insurance Market Trends:
The Latin America and Middle East & Africa regions are some of those that are showing substantial growth in the Parametric Insurance Market in 2025, due to the rise in climate risks, including droughts, floods, and weather conditions. Countries such as South Africa, UAE, Brazil, and Mexico are implementing parametric insurance, and insurers such as Swiss Re, Munich Re, Aon, and Zurich are providing data-driven, rapid payout solutions for improving disaster recovery and resilience.
Parametric Insurance Market Competitive Landscape:
AXA Hong Kong and Macau unveiled the first-to-market heatwave parametric insurance product, which protects outdoor workers against extreme heat. The policy provides payouts or heatwave kits for when temperatures reach more than 36°C for three straight days, and the process is designed to be claims automatically with triggers, and no proof of loss is necessary.
AIG has been at the lead in shaping the parametric insurance market, delivering cutting-edge options to protect against climate-related risks. The importance of parametric products in deploying rapid financial aid to disaster-hit areas and preparing for future disasters in the affected communities has been highlighted by the company.
Parametric Insurance Market Key Players:
-
AXA
-
AIG
-
Aon
-
Berkshire Hathaway Specialty Insurance
-
Chubb
-
Marsh & McLennan
-
Munich Re
-
Swiss Re
-
Zurich Insurance Group
-
QBE Insurance Group
-
Blink Parametrics
-
Parametrix
-
Sprout AI
-
IBISA
-
Raincoat
-
Arbol
-
Kovrr
-
Weathercheck
-
Trov
-
Concirrus
| Report Attributes | Details |
|---|---|
| Market Size in 2025 | USD 17.60 Billion |
| Market Size by 2035 | USD 46.08 Billion |
| CAGR | CAGR of 10.1% From 2026 to 2035 |
| Base Year | 2025 |
| Forecast Period | 2026-2035 |
| Historical Data | 2022-2024 |
| Report Scope & Coverage | Market Size, Segments Analysis, Competitive Landscape, Regional Analysis, DROC & SWOT Analysis, Forecast Outlook |
| Key Segments | • By Insurance Type (Index-Based Insurance, Weather-Based Insurance, Catastrophe Bonds, Other Parametric Insurance Types) • By Application (Agriculture, Property and Casualty, Energy, Other Applications) • By Deployment Model (Cloud-Based, On-Premise, Hybrid) • By Use Case (Risk Mitigation, Index Tracking, Catastrophe Response, Other Use Cases) |
| Regional Analysis/Coverage | North America (US, Canada, Mexico), Europe (Germany, France, UK, Italy, Spain, Poland, Turkey, Rest of Europe), Asia Pacific (China, India, Japan, South Korea, Singapore, Australia, Rest of Asia Pacific), Middle East & Africa (UAE, Saudi Arabia, Qatar, South Africa, Rest of Middle East & Africa), Latin America (Brazil, Argentina, Rest of Latin America) |
| Company Profiles | AXA, Munich Re, AIG, Allianz, Berkshire Hathaway Specialty Insurance, Chubb, Lloyd's of London, Swiss Re, Zurich Insurance Group, QBE Insurance Group, Blink Parametrics, Parametrix, Sprout AI, IBISA, Raincoat, Arbol, Kovrr, Weathercheck, Trov, Concirrus |
Frequently Asked Questions
North America dominated the Parametric Insurance Market in 2025.
The Index-Based Insurance segment dominated the Parametric Insurance Market.
The major growth factor of the Parametric Insurance Market is the increasing frequency of climate-related events, driving demand for faster, data-driven risk management solutions.
The Parametric Insurance Market size was USD 17.60 billion in 2025 and is expected to reach USD 46.08 billion by 2035.
The Parametric Insurance Market is expected to grow at a CAGR of 10.1% during 2026-2035.
Get in Touch
