Permanent Magnet Market Report Scope & Overview:

Get More Information on Permanent Magnet Market - Request Sample Report
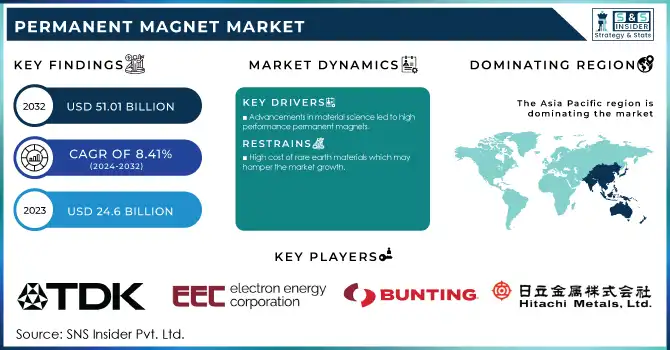
The Permanent Magnet Market Size was USD 24.6 billion in 2023 and is expected to reach USD 51.01 billion by 2032 and grow at a CAGR of 8.41% over the forecast period of 2024-2032.
The use of Electric Vehicles is gaining in popularity and driving demand for permanent magnets. EVs rely on NdFeB (neodymium-iron-boron) permanent magnets as one of the main components of their motors due to the high energy density, lightness, and efficiency magnets. These magnets help electric motors develop more power and energy efficiency a key requirement for getting the most range and performance out of EVs. As governments around the world introduce tougher emission norms, provide incentives, and promote sustainable modes of transportation, the demand for EVs is soaring. The transition to hybrid and plug-in hybrid vehicles also drives an increasing need for next-generation permanent magnet capabilities. The automotive industry as a whole is still investing in electric powertrain technologies, and the use of high-performance permanent magnets in such applications becomes increasingly critical to advancing the efficiency and reliability of EV motors, powering further growth of the market.
The United States also witnessed a surge, with EV sales surpassing 800,000 units in 2022, fueled by initiatives under the Inflation Reduction Act, which offers tax credits of up to USD 7,500 for EV buyers. These policies and incentives are directly boosting the demand for NdFeB permanent magnets used in EV motors, positioning them as a cornerstone of the transition to sustainable transportation.
The rising investments in research and development (R&D) are in key role in increasing the permanent magnet market. Researchers, industry leaders, and governments across the globe are conducting extensive research and development into new, advanced magnet technologies to improve performance while minimizing dependence on rare earth materials. For example, research involves developing high-performance magnets that exhibit better thermal stability and corrosion resistance to fulfill the requirements of modern applications, including electric vehicles (EVs), renewable energy systems, and advanced electronics. Moreover, there are emerging efforts to develop sustainable magnet manufacturing processes, such as recycling rare earth elements and exploring alternative materials, to help alleviate environmental concerns and supply chain issues. In addition to that, these R&D initiatives also drive technological upgradation and extend the horizons for different industries to utilize permanent magnets and aid market growth in the long run.
The U.S. Department of Energy (DOE) allocated USD 30 million in 2023 to its Critical Materials Institute for projects focused on improving the supply chain and recycling of rare earth elements, which are essential for permanent magnets.
Permanent Magnet Market Dynamics
Drivers
-
Advancements in material science led to high-performance permanent magnets.
-
Increasing demand for energy-efficient technologies across industries.
One of the major factors fuelling the market growth of permanent magnets is the rising demand for energy-efficient technologies in various industries. Permanent magnets, especially those based on neodymium-iron-boron (NdFeB), are essential in improving the performance of various devices and systems. Energy-efficient technologies are being adopted by sectors such as renewable energy, manufacturing, and consumer electronics to minimize operational costs and adhere to strict environmental rules. Design of wind turbine generators, in which permanent magnets play a vital role; they enhance energy conversion efficiency and decrease mechanical losses. Permanent magnet-based, energy-efficient motors are the new standard for electrical/electronic design and application to reduce electricity consumption and meet sustainability goals in industrial applications. And compact, energy-efficient magnet technologies enable performance optimization for the latest in consumer electronics phones, headphones, home appliances, and more. A burgeoning focus on energy efficiency across sectors, as a result of regulatory mechanisms and cost-saving measures, further bolsters the market for high-performance permanent magnets.
The U.S. Department of Energy (DOE) reported that energy-efficient motors, a key application of permanent magnets, could reduce industrial energy consumption by up to 30%. In China, energy efficiency initiatives under the 14th Five-Year Plan (2021-2025) are expected to accelerate the adoption of advanced technologies in manufacturing and renewable energy sectors.
Restraint
-
High cost of rare earth materials which may hamper the market growth.
High cost of rare earth material is one of the major restraining factors which may hinder the growth of the permanent magnet market. NdFeB magnets even need rare earths—neodymium and dysprosium are examples of rare earth elements in order to function, and these can be costly and capricious in price. Due to limited supply, geopolitical considerations, and complex and energy-intensive extraction processes, the key materials are going to be expensive. For example, China holds a large share of the global supply of rare earth elements and changes in its supply or trade policies can lead to steep price increases that raise the overall cost of manufacturing permanent magnets. This cost can be all too high limiting manufacturers from using permanent magnets in cost sensitive applications and thereby curtailing mass application across automotive, electronics, and renewable energy sectors. This high cost of rare earth materials can hinder market growth, especially in regions where alternative, cost effective technologies exist.
Opportunities
-
Integration of permanent magnets in emerging sectors such as robotics and energy storage systems.
-
Expanding application scope in medical devices, aerospace, and consumer electronics.
-
Government initiatives promoting clean energy and stringent regulations on emissions.
Permanent Magnet Market Segmentation
By Type
The ferrite magnet segment held the largest revenue share of about 40% in 2023. Due to its cost-effective, easily accessible, and multiform application, owing to which the ferrite magnet segment dominates the permanent magnet market. Ferrite magnets, derived from a combination of iron oxide and barium or strontium carbonate, are prepared at a much lower cost than rare-earth magnets such as neodymium-iron-boron (NdFeB). This cost-effectiveness makes them a well-matched choice for industries where the cost is important, for example, low-chance customer gadgets, toys, vehicle applications, and family unit machines. Furthermore, ferrite magnets have excellent magnetic properties, corrosion resistance, and durability that make them suitable for a range of applications including motors, loudspeakers, and magnetic separators.
By Application
Consumer electronics held the largest revenue share of more than 27% in 2023 in the permanent magnet market. Permanent magnets also play an important role as they are used in crucial components such as motors, speakers, microphones, hard drives and multiple sensors in such products as smartphones, laptops, televisions, audio systems and home appliances, where neodymium magnets are specifically used. With consumer demand for smaller, lighter, and more energy-efficient devices expanding, the demand for high-performance magnets has increased accordingly. These magnets enable that critical level of miniaturization and power efficiency for the design and operation of modern electronic devices. In addition, the permanent magnets sector benefits from the growth of consumer electronics at a global scale, driven by growing disposable income, technological developments and more smart devices. This extensive application and rising consumer electronics market demand have established it as the largest permanent magnet market segment.
Permanent Magnet Market Regional Overview
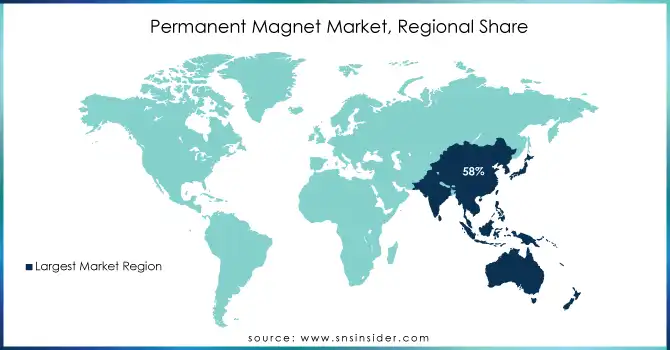
Asia Pacific dominated the permanent magnet market with the highest revenue share of about 58% in 2023 due to the region's robust manufacturing base, particularly in industries like automotive, electronics, and renewable energy, which drives significant demand for permanent magnets. Growing adoption of electric vehicles and government initiatives promoting clean energy contribute to the high demand for permanent magnets which drives the growth of the permanent magnets market in this region.
North America held a significant market share of the permanent magnet market in 2023. The region's strong demand for permanent magnets stemmed from their vital role in applications such as electric vehicle propulsion systems, renewable energy generation, and advanced electronics. Additionally, North America's focus on sustainability and clean energy initiatives further propelled the adoption of permanent magnets, contributing to its notable market share.

Get Customized Report as per Your Business Requirement - Request For Customized Report
Key Players
-
TDK Corporation (Ferrite Magnets, NdFeB Magnets)
-
Electron Energy Corporation (NdFeB Magnets, Samarium Cobalt Magnets)
-
Bunting Magnetics Co. (Magnetic Assemblies, Ferrite Magnets)
-
Tengam Engineering, Inc. (Alnico Magnets, Samarium Cobalt Magnets)
-
Ningbo Yunsheng Co. Ltd. (NdFeB Magnets, Permanent Magnet Motors)
-
Chengdu Galaxy Magnets Co. Ltd. (NdFeB Magnets, Ferrite Magnets)
-
Eclipse Magnetics (Permanent Magnets, Magnetic Filters)
-
Arnold Magnetic Technologies (Samarium Cobalt Magnets, NdFeB Magnets)
-
Hitachi Metals, Ltd. (NdFeB Magnets, Samarium Cobalt Magnets)
-
Shin-Etsu Chemical Co. Ltd. (NdFeB Magnets, Ferrite Magnets)
-
Adams Magnetic Products Co Inc. (Flexible Magnets, Magnetic Assemblies)
-
Yantai Shougang Magnetic Materials Inc. (NdFeB Magnets, Ferrite Magnets)
-
Goudsmit Magnetics (Permanent Magnets, Magnetic Separation Systems)
-
Magnetic Applications Inc. (Alnico Magnets, Ferrite Magnets)
-
Daido Steel Co. Ltd. (NdFeB Magnets, Samarium Cobalt Magnets)
-
Zhong Ke San Huan Hi-Tech Co., Ltd. (NdFeB Magnets, Ferrite Magnets)
-
China Northern Rare Earth Group High-Tech Co. Ltd. (NdFeB Magnets, SmCo Magnets)
-
SanHuan Magnetic Materials Co. Ltd. (NdFeB Magnets, Ferrite Magnets)
-
VACUUMSCHMELZE GmbH & Co. KG (Fe-based Alloys, NdFeB Magnets)
-
Ta Tong Magnet Co., Ltd. (NdFeB Magnets, Ferrite Magnets)
Recent Development:
-
In 2024, TDK launched a new series of high-performance, environmentally friendly ferrite magnets designed to meet the growing demand in automotive and consumer electronics applications. The new series aims to reduce the environmental footprint by using sustainable production methods.
-
In 2023, Eclipse Magnetics is thrilled to introduce Ultralift E, a cutting-edge option in high-performance lifting and handling. Ultralift E incorporates the latest magnetic technology and advanced manufacturing techniques to deliver secure, efficient, precise, and cost-effective steel lifting solutions.
-
In 2023, Electron Energy Corporation developed a new generation of high-performance NdFeB magnets for use in electric vehicle motors, significantly enhancing the power density and efficiency of electric drive systems.
| Report Attributes | Details |
|---|---|
| Market Size in 2023 | US$ 24.6 Billion |
| Market Size by 2032 | US$ 51.01 Billion |
| CAGR | CAGR of 8.41% From 2023 to 2032 |
| Base Year | 2023 |
| Forecast Period | 2024-2032 |
| Historical Data | 2020-2022 |
| Report Scope & Coverage | Market Size, Segments Analysis, Competitive Landscape, Regional Analysis, DROC & SWOT Analysis, Forecast Outlook |
| Key Segments |
• By Type (Ferrite Magnets, Neodymium Iron Boron Magnets, Samarium Cobalt Magnets, Alnico Magnets, Others) • By Application (Automotive, Consumer Electronics, General Industrial, Medical, Aerospace & Defense, Environment & Energy, Others) |
| Regional Analysis/Coverage |
North America (US, Canada, Mexico), Europe (Eastern Europe [Poland, Romania, Hungary, Turkey, Rest of Eastern Europe] Western Europe] Germany, France, UK, Italy, Spain, Netherlands, Switzerland, Austria, Rest of Western Europe]), Asia Pacific (China, India, Japan, South Korea, Vietnam, Singapore, Australia, Rest of Asia Pacific), Middle East & Africa (Middle East [UAE, Egypt, Saudi Arabia, Qatar, Rest of Middle East], Africa [Nigeria, South Africa, Rest of Africa], Latin America (Brazil, Argentina, Colombia, Rest of Latin America) |
| Company Profiles | TDK Corporation, Electron Energy Corporation, Bunting Magnetics Co., Tengam Engineering, Inc., Ningbo Yunsheng Co. Ltd., Chengdu Galaxy Magnets Co Ltd., Eclipse Magnetics, Arnold Magnetic Technologies, Hitachi Metals, Ltd., Shin-Etsu Chemical Co Ltd., Adams Magnetic Products Co Inc., Yantai Shougang Magnetic Materials Inc., Goudsmit Magnetics, and other players. |
| Drivers |
• Advancements in material science led to high-performance permanent magnets. • Increasing demand for energy-efficient technologies across industries. |
| Restraints | • High cost of rare earth materials which may hamper the market growth. |

