Get More Information on Pharmaceutical Contract Manufacturing Market - Request Sample Report
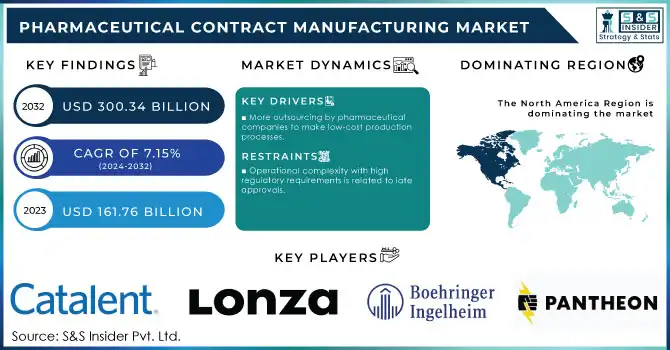
The Pharmaceutical Contract Manufacturing Market Size was valued at USD 161.76 bn in 2023 and will reach $300.34 bn by 2032 & grow at a CAGR of 7.15% over the forecast period of 2024-2032.
The Pharmaceutical Contract Manufacturing Market is evolving rapidly, driven by regulatory changes, technological advancements, and growing demand for innovative drug formulations. Governments worldwide are tightening policies to enhance transparency and compliance. In the U.S., the FDA's 2023 Good Manufacturing Practices (GMP) guidelines emphasize stringent manufacturing standards, while Germany’s AMNOG Act and France’s CEPS focus on price structuring and therapeutic value. Similarly, China’s NMPA reforms and Japan’s data exclusivity policies encourage innovation and improved production standards.
Technological advancements play a critical role in boosting efficiency and transparency. Artificial Intelligence is streamlining production cycles and optimizing supply chains, while blockchain technology enhances security and combats counterfeit drugs. Major players like Lonza, Catalent, and Boehringer Ingelheim are adopting advanced solutions, including continuous manufacturing and biologics production, to meet the growing demand for personalized medicines and complex formulations.
The market’s shift toward outsourcing is driven by cost optimization and increased efficiency. Rising interest in biologics, injectable treatments, and cell and gene therapy highlights the focus on personalized and advanced therapeutic solutions. As pharmaceutical companies increasingly collaborate with contract manufacturers, the market is poised for sustained growth, offering immense potential for innovation and expansion.
KEY DRIVERS:
More outsourcing by pharmaceutical companies to make low-cost production processes.
Outsourcing by pharmaceutical companies has been on an upsurge, as these companies are shifting focus to low-cost production, and this factor is primarily driving demand in the Pharmaceutical Contract Manufacturing Market. Most small and mid-sized pharma companies are thus looking towards contract manufacturers for low-cost and scalable production options. The operations of contract manufacturers are lean, and thus pharmaceutical companies make fewer capital investments and operational costs for production facilities. Government reports at the FDA indicate that in 2023, activities concerning outsourcing in the United States increased by 15% because more firms were focusing on quicker drug development and scalability in handling manufacturing. China's National Medical Products Administration, for instance, has seen consistent growth in outsourcing, with more than 20% of new drug manufacturing outsourced, an indication of cost pressures companies are experiencing around the globe.
Global demand for biologics and advanced therapeutic treatments is on the rise.
Among the primary factors driving the Pharmaceutical Contract Manufacturing Market is the demand for biologics. Biologics manufacturing processes that include monoclonal antibodies, cell therapies, and gene therapies are also extremely complex and unique in nature, thereby complicating the manufacturing process inside the pharmaceutical firms. The rising demand for biologics has also resulted in rising compliance issues for most contract manufacturers, who require high-quality manufacturing of such complicated pharmaceutical products. According to European Medicines Agency (EMA) reports, biologics accounted for approximately 30% of new drugs approved in Europe in 2023. For Japan, according to the Ministry of Health, Labor, and Welfare, a quarter plus one in ten parts biologics penetrated more than 25% of the total pharmaceutical market in 2023.
RESTRAIN:
Operational complexity with high regulatory requirements is related to late approvals.
One of the major constraints of the Pharmaceutical Contract Manufacturing Market is a strict regulatory landscape that amplifies complexity and cost in operations. For instance, bodies like the FDA in the United States, EMA in Europe, and NMPA in China lay down the present standards for the production of drugs, quality control, validation procedures, among many others. Such demands often push the product approval times and elevates operational costs for contract manufacturers. For example, GMP on supply chain clarity enforced by FDA, manufacturers have to invest heavily in quality assurance systems that include comprehensive testing protocols and quality control measurements with ongoing compliance audits-tasks that are not only time-consuming but also costly.
In Europe, the EMA has very strict rules for producing biologics and biosimilars, in some instances requiring additional clinical evidence of comparability, when compared to original drugs. This could at times lead to bottle-neck situations for the contract manufacturer, mainly when dealing with complex biologics. NMPA, China strengthens the regulation and the standards of manufacturing practices for international standards, which makes approval take a little longer. It means that to understand and implement such complicated regulatory mechanisms, the cost associated with maintaining compliance is significantly increased even with time-consuming delays in product launches.
BY SERVICE:
In 2023, Pharmaceutical Manufacturing Services accounted for the largest market share in the industry, capturing 32%. This dominance stems from the rising demand for advanced manufacturing solutions in the pharmaceutical sector. Companies have increasingly focused on their core business activities, such as research and development, while outsourcing non-core operations. Notably, Pharmaceutical API Manufacturing Services have gained significance, as organizations rely on specialized expertise for the production of active pharmaceutical ingredients.
The Drug Development Services segment is projected to witness the fastest growth, with a CAGR of 9.72% during the forecast period from 2024 to 2032. The surge in novel therapies, including biological agents and personalized medicines, has prompted contract manufacturers to expand their offerings to encompass drug discovery, development, and preclinical testing. This growth is driven by the increasing demand for drug development pipeline products, where contract manufacturers go beyond production to provide end-to-end support for the entire drug development process.
BY END USER
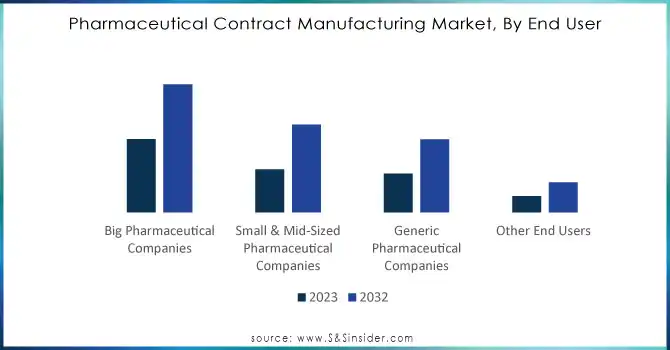
In 2023, large pharmaceutical companies dominated the market, holding approximately 30% of the share. These companies increasingly leverage contract manufacturing to enhance production efficiency while concentrating on core competencies such as drug discovery and commercialization. With rising R&D expenses, big pharma firms are outsourcing manufacturing to streamline supply chains, scale up production, and maintain stringent quality standards.
Meanwhile, small and mid-sized pharmaceutical companies are projected to experience the fastest growth rate, with a CAGR of 8.21% during the forecast period from 2024 to 2032. This growth is attributed to their limited in-house manufacturing capabilities, driving the need to outsource product development and market introduction efficiently and swiftly. Additionally, as many of these smaller firms focus on niche therapeutic areas like orphan drugs and biologics, the demand for highly specialized contract manufacturing services continues to rise.
Need Any Customization Research On Pharmaceutical Contract Manufacturing Market - Inquiry Now
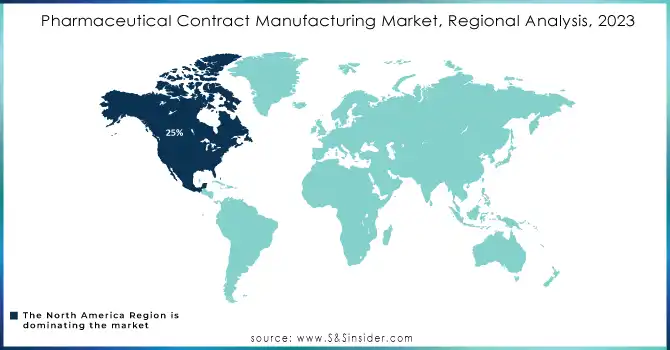
In 2023, North America led the market with a 25% share, largely driven by the presence of major pharmaceutical companies, advanced healthcare infrastructure, and strong government support. The United States, in particular, remains a key player, shaped by regulatory agencies like the FDA, which have established standards that define the market. Additionally, investments in biologics and personalized medicine have further boosted the region's position in contract manufacturing.
However, the Asia Pacific region is expected to experience the fastest growth during the forecast period from 2024 to 2032, with a CAGR of 8.42%. Countries like China, India, and Japan are emerging as major manufacturing hubs. Government policies and cost advantages have contributed to the growth of manufacturing activities in these nations. For instance, China’s NMPA has streamlined its approval processes to encourage innovation and attract global pharmaceutical players, while Japan’s Ministry of Health is focusing on the development of biologics and biosimilars.
Some of the major players in the Pharmaceutical Contract Manufacturing Market are
Catalent (Sterile Manufacturing, Oral Solid Dose Manufacturing)
Lonza (Biologic Drug Substance Manufacturing, Cell Therapy Manufacturing)
Boehringer Ingelheim (Biopharmaceuticals, Contract Development)
Samsung Biologics (Biologics Manufacturing, Fill/Finish Services)
WuXi AppTec (Small Molecule Manufacturing, Biologics Manufacturing)
Patheon (Pharmaceutical Development, API Manufacturing)
AMRI (API Development, Drug Product Manufacturing)
Recipharm (Inhalation Product Manufacturing, Drug Development Services)
Siegfried (Drug Substance Manufacturing, Drug Product Manufacturing)
Jubilant Life Sciences (Sterile Injectable Manufacturing, Solid Oral Dosage Manufacturing)
Famar (Sterile Manufacturing, Packaging Services)
Thermo Fisher Scientific (Pharmaceutical Development, Biologics Manufacturing)
Piramal Pharma Solutions (API Manufacturing, Drug Product Manufacturing)
Almac Group (Drug Development Services, Clinical Trial Manufacturing)
Cambrex (API Manufacturing, Drug Substance Manufacturing)
BioDuro-Sundia (Biologics Manufacturing, Drug Discovery)
Vetter Pharma (Fill & Finish Services, Packaging Services)
AbbVie Contract Manufacturing (API Development, Solid Oral Dose Manufacturing)
Baxter BioPharma Solutions (Injectable Manufacturing, Biologics Manufacturing)
Pfizer CentreOne (API Manufacturing, Biologics Manufacturing)
BASF
DSM
Thermo Fisher
Evonik
Lonza Raw Material Supply
Eastman Chemical Company
Solvay
Honeywell
Sigma-Aldrich
Merck KGaA
Johnson & Johnson
Novartis
Merck & Co.
Roche
GlaxoSmithKline
Sanofi
Eli Lilly
AstraZeneca
Pfizer
Amgen
October 2024: South Korea-based global Contract Development and Manufacturing Organization (CDMO) Samsung Biologics has revealed that it has entered into a contract manufacturing deal with an Asia-based pharmaceutical company. This is the biggest contract signed by a single client, standing at USD 1.24 billion. The production will be done in its biomanufacturing site in Songdo, South Korea, and it will operate through December 2037. From the latest deal, accumulated contract for 2024 stands over at USD 3.3 billion for the company.
In 2024, Eli Lilly and Company and Nexus Pharmaceuticals, LLC announced a definitive agreement under which Lilly will acquire a manufacturing facility from Nexus, a prominent sterile manufacturer in the pharmaceutical sector.
Report Attributes | Details |
---|---|
Market Size in 2023 | US$ 161.76 Billion |
Market Size by 2032 | US$ 300.34 Billion |
CAGR | CAGR of 7.15 % From 2024 to 2032 |
Base Year | 2023 |
Forecast Period | 2024-2032 |
Historical Data | 2020-2022 |
Report Scope & Coverage | Market Size, Segments Analysis, Competitive Landscape, Regional Analysis, DROC & SWOT Analysis, Forecast Outlook |
Key Segments | • By Service (Pharmaceutical Manufacturing Services, Pharmaceutical API Manufacturing Services, Pharmaceutical FDF Manufacturing Services, Drug Development Services, Biologic Manufacturing Services, Biologic API Manufacturing Services, Biologic FDF Manufacturing Services) • By End User (Big Pharmaceutical Companies, Small & Mid-Sized Pharmaceutical Companies, Generic Pharmaceutical Companies, Other) |
Regional Analysis/Coverage | North America (US, Canada, Mexico), Europe (Eastern Europe [Poland, Romania, Hungary, Turkey, Rest of Eastern Europe] Western Europe] Germany, France, UK, Italy, Spain, Netherlands, Switzerland, Austria, Rest of Western Europe]), Asia Pacific (China, India, Japan, South Korea, Vietnam, Singapore, Australia, Rest of Asia Pacific), Middle East & Africa (Middle East [UAE, Egypt, Saudi Arabia, Qatar, Rest of Middle East], Africa [Nigeria, South Africa, Rest of Africa], Latin America (Brazil, Argentina, Colombia, Rest of Latin America) |
Company Profiles | Catalent, Lonza, Boehringer Ingelheim, Samsung Biologics, WuXi AppTec, Patheon, AMRI, Recipharm, Siegfried, Jubilant Life Sciences, Famar, Thermo Fisher Scientific, Piramal Pharma Solutions, Almac Group, Cambrex, BioDuro-Sundia, Vetter Pharma, AbbVie Contract Manufacturing, Baxter BioPharma Solutions, Pfizer CentreOne. |
Key Drivers | • More outsourcing by pharmaceutical companies to make low-cost production processes. • Global demand for biologics and advanced therapeutic treatments is on the rise. |
Restraints | • Operational complexity with high regulatory requirements is related to late approvals. |
Ans: The Pharmaceutical Contract Manufacturing Market is expected to grow at a CAGR of 7.15% during 2024-2032.
Ans: Pharmaceutical Contract Manufacturing Market size was USD 161.76 Billion in 2023 and is expected to Reach USD 300.34 Billion by 2032.
Ans: The major growth factors of the Pharmaceutical Contract Manufacturing Market are Outsourcing by Pharmaceutical Companies and Demand for Biologics and Advanced Therapeutic Treatments.
Ans: The Pharmaceutical Manufacturing Services segment dominated the Pharmaceutical Contract Manufacturing Market.
Ans: North America dominated the Pharmaceutical Contract Manufacturing Market in 2023.
TABLE OF CONTENTS
1. Introduction
1.1 Market Definition
1.2 Scope (Inclusion and Exclusions)
1.3 Research Assumptions
2. Executive Summary
2.1 Market Overview
2.2 Regional Synopsis
2.3 Competitive Summary
3. Research Methodology
3.1 Top-Down Approach
3.2 Bottom-up Approach
3.3. Data Validation
3.4 Primary Interviews
4. Market Dynamics Impact Analysis
4.1 Market Driving Factors Analysis
4.1.2 Drivers
4.1.2 Restraints
4.1.3 Opportunities
4.1.4 Challenges
4.2 PESTLE Analysis
4.3 Porter’s Five Forces Model
5. Statistical Insights and Trends Reporting
5.1 Capacity Utilization
5.2 Regulatory Compliance
5.3 Average duration of contracts
5.4 Supply Chain Efficiency
6. Competitive Landscape
6.1 List of Major Companies, By Region
6.2 Market Share Analysis, By Region
6.3 Product Benchmarking
6.3.1 Product specifications and features
6.3.2 Pricing
6.4 Strategic Initiatives
6.4.1 Marketing and promotional activities
6.4.2 Distribution and supply chain strategies
6.4.3 Expansion plans and new product launches
6.4.4 Strategic partnerships and collaborations
6.5 Technological Advancements
6.6 Market Positioning and Branding
7. Pharmaceutical Contract Manufacturing Market Segmentation, By Service
7.1 Chapter Overview
7.2 Pharmaceutical Manufacturing Services
7.2.1 Pharmaceutical Manufacturing Services Market Trends Analysis (2020-2032)
7.2.2 Pharmaceutical Manufacturing Services Market Size Estimates and Forecasts to 2032 (USD Billion)
7.3 Pharmaceutical API Manufacturing Services
7.3.1 Pharmaceutical API Manufacturing Services Market Trends Analysis (2020-2032)
7.3.2 Pharmaceutical API Manufacturing Services Market Size Estimates and Forecasts to 2032 (USD Billion)
7.4 Pharmaceutical FDF Manufacturing Services
7.4.1 Pharmaceutical FDF Manufacturing Services Market Trends Analysis (2020-2032)
7.4.2 Pharmaceutical FDF Manufacturing Services Market Size Estimates and Forecasts to 2032 (USD Billion)
7.5 Drug Development Services
7.5.1 Drug Development Services Market Trends Analysis (2020-2032)
7.5.2 Drug Development Services Market Size Estimates and Forecasts to 2032 (USD Billion)
7.6 Biologic Manufacturing Services
7.6.1 Biologic Manufacturing Services Market Trends Analysis (2020-2032)
7.6.2 Biologic Manufacturing Services Market Size Estimates and Forecasts to 2032 (USD Billion)
7.7 Biologic API Manufacturing Services
7.7.1 Biologic API Manufacturing Services Market Trends Analysis (2020-2032)
7.7.2 Biologic API Manufacturing Services Market Size Estimates and Forecasts to 2032 (USD Billion)
7.8 Biologic FDF Manufacturing Services
7.8.1 Biologic FDF Manufacturing Services Market Trends Analysis (2020-2032)
7.8.2 Biologic FDF Manufacturing Services Market Size Estimates and Forecasts to 2032 (USD Billion)
8. Pharmaceutical Contract Manufacturing Market Segmentation, By End User
8.1 Chapter Overview
8.2 Big Pharmaceutical Companies
8.2.1 Big Pharmaceutical Companies Market Trends Analysis (2020-2032)
8.2.2 Big Pharmaceutical Companies Market Size Estimates and Forecasts to 2032 (USD Billion)
8.3 Small & Mid-Sized Pharmaceutical Companies
8.3.1 Small & Mid-Sized Pharmaceutical Companies Market Trends Analysis (2020-2032)
8.3.2 Small & Mid-Sized Pharmaceutical Companies Market Size Estimates and Forecasts to 2032 (USD Billion)
8.4 Generic Pharmaceutical Companies
8.4.1 Generic Pharmaceutical Companies Market Trends Analysis (2020-2032)
8.4.2 Generic Pharmaceutical Companies Market Size Estimates and Forecasts to 2032 (USD Billion)
8.5 Other
8.5.1 Other Market Trends Analysis (2020-2032)
8.5.2 Other Market Size Estimates and Forecasts to 2032 (USD Billion)
9. Regional Analysis
9.1 Chapter Overview
9.2 North America
9.2.1 Trends Analysis
9.2.2 North America Pharmaceutical Contract Manufacturing Market Estimates and Forecasts, by Country (2020-2032) (USD Billion)
9.2.3 North America Pharmaceutical Contract Manufacturing Market Estimates and Forecasts, By Service (2020-2032) (USD Billion)
9.2.4 North America Pharmaceutical Contract Manufacturing Market Estimates and Forecasts, By End User (2020-2032) (USD Billion)
9.2.5 USA
9.2.5.1 USA Pharmaceutical Contract Manufacturing Market Estimates and Forecasts, By Service (2020-2032) (USD Billion)
9.2.5.2 USA Pharmaceutical Contract Manufacturing Market Estimates and Forecasts, By End User (2020-2032) (USD Billion)
9.2.6 Canada
9.2.6.1 Canada Pharmaceutical Contract Manufacturing Market Estimates and Forecasts, By Service (2020-2032) (USD Billion)
9.2.6.2 Canada Pharmaceutical Contract Manufacturing Market Estimates and Forecasts, By End User (2020-2032) (USD Billion)
9.2.7 Mexico
9.2.7.1 Mexico Pharmaceutical Contract Manufacturing Market Estimates and Forecasts, By Service (2020-2032) (USD Billion)
9.2.7.2 Mexico Pharmaceutical Contract Manufacturing Market Estimates and Forecasts, By End User (2020-2032) (USD Billion)
9.3 Europe
9.3.1 Eastern Europe
9.3.1.1 Trends Analysis
9.3.1.2 Eastern Europe Pharmaceutical Contract Manufacturing Market Estimates and Forecasts, by Country (2020-2032) (USD Billion)
9.3.1.3 Eastern Europe Pharmaceutical Contract Manufacturing Market Estimates and Forecasts, By Service (2020-2032) (USD Billion)
9.3.1.4 Eastern Europe Pharmaceutical Contract Manufacturing Market Estimates and Forecasts, By End User (2020-2032) (USD Billion)
9.3.1.5 Poland
9.3.1.5.1 Poland Pharmaceutical Contract Manufacturing Market Estimates and Forecasts, By Service (2020-2032) (USD Billion)
9.3.1.5.2 Poland Pharmaceutical Contract Manufacturing Market Estimates and Forecasts, By End User (2020-2032) (USD Billion)
9.3.1.6 Romania
9.3.1.6.1 Romania Pharmaceutical Contract Manufacturing Market Estimates and Forecasts, By Service (2020-2032) (USD Billion)
9.3.1.6.2 Romania Pharmaceutical Contract Manufacturing Market Estimates and Forecasts, By End User (2020-2032) (USD Billion)
9.3.1.7 Hungary
9.3.1.7.1 Hungary Pharmaceutical Contract Manufacturing Market Estimates and Forecasts, By Service (2020-2032) (USD Billion)
9.3.1.7.2 Hungary Pharmaceutical Contract Manufacturing Market Estimates and Forecasts, By End User (2020-2032) (USD Billion)
9.3.1.8 Turkey
9.3.1.8.1 Turkey Pharmaceutical Contract Manufacturing Market Estimates and Forecasts, By Service (2020-2032) (USD Billion)
9.3.1.8.2 Turkey Pharmaceutical Contract Manufacturing Market Estimates and Forecasts, By End User (2020-2032) (USD Billion)
9.3.1.9 Rest of Eastern Europe
9.3.1.9.1 Rest of Eastern Europe Pharmaceutical Contract Manufacturing Market Estimates and Forecasts, By Service (2020-2032) (USD Billion)
9.3.1.9.2 Rest of Eastern Europe Pharmaceutical Contract Manufacturing Market Estimates and Forecasts, By End User (2020-2032) (USD Billion)
9.3.2 Western Europe
9.3.2.1 Trends Analysis
9.3.2.2 Western Europe Pharmaceutical Contract Manufacturing Market Estimates and Forecasts, by Country (2020-2032) (USD Billion)
9.3.2.3 Western Europe Pharmaceutical Contract Manufacturing Market Estimates and Forecasts, By Service (2020-2032) (USD Billion)
9.3.2.4 Western Europe Pharmaceutical Contract Manufacturing Market Estimates and Forecasts, By End User (2020-2032) (USD Billion)
9.3.2.5 Germany
9.3.2.5.1 Germany Pharmaceutical Contract Manufacturing Market Estimates and Forecasts, By Service (2020-2032) (USD Billion)
9.3.2.5.2 Germany Pharmaceutical Contract Manufacturing Market Estimates and Forecasts, By End User (2020-2032) (USD Billion)
9.3.2.6 France
9.3.2.6.1 France Pharmaceutical Contract Manufacturing Market Estimates and Forecasts, By Service (2020-2032) (USD Billion)
9.3.2.6.2 France Pharmaceutical Contract Manufacturing Market Estimates and Forecasts, By End User (2020-2032) (USD Billion)
9.3.2.7 UK
9.3.2.7.1 UK Pharmaceutical Contract Manufacturing Market Estimates and Forecasts, By Service (2020-2032) (USD Billion)
9.3.2.7.2 UK Pharmaceutical Contract Manufacturing Market Estimates and Forecasts, By End User (2020-2032) (USD Billion)
9.3.2.8 Italy
9.3.2.8.1 Italy Pharmaceutical Contract Manufacturing Market Estimates and Forecasts, By Service (2020-2032) (USD Billion)
9.3.2.8.2 Italy Pharmaceutical Contract Manufacturing Market Estimates and Forecasts, By End User (2020-2032) (USD Billion)
9.3.2.9 Spain
9.3.2.9.1 Spain Pharmaceutical Contract Manufacturing Market Estimates and Forecasts, By Service (2020-2032) (USD Billion)
9.3.2.9.2 Spain Pharmaceutical Contract Manufacturing Market Estimates and Forecasts, By End User (2020-2032) (USD Billion)
9.3.2.10 Netherlands
9.3.2.10.1 Netherlands Pharmaceutical Contract Manufacturing Market Estimates and Forecasts, By Service (2020-2032) (USD Billion)
9.3.2.10.2 Netherlands Pharmaceutical Contract Manufacturing Market Estimates and Forecasts, By End User (2020-2032) (USD Billion)
9.3.2.11 Switzerland
9.3.2.11.1 Switzerland Pharmaceutical Contract Manufacturing Market Estimates and Forecasts, By Service (2020-2032) (USD Billion)
9.3.2.11.2 Switzerland Pharmaceutical Contract Manufacturing Market Estimates and Forecasts, By End User (2020-2032) (USD Billion)
9.3.2.12 Austria
9.3.2.12.1 Austria Pharmaceutical Contract Manufacturing Market Estimates and Forecasts, By Service (2020-2032) (USD Billion)
9.3.2.12.2 Austria Pharmaceutical Contract Manufacturing Market Estimates and Forecasts, By End User (2020-2032) (USD Billion)
9.3.2.13 Rest of Western Europe
9.3.2.13.1 Rest of Western Europe Pharmaceutical Contract Manufacturing Market Estimates and Forecasts, By Service (2020-2032) (USD Billion)
9.3.2.13.2 Rest of Western Europe Pharmaceutical Contract Manufacturing Market Estimates and Forecasts, By End User (2020-2032) (USD Billion)
9.4 Asia Pacific
9.4.1 Trends Analysis
9.4.2 Asia Pacific Pharmaceutical Contract Manufacturing Market Estimates and Forecasts, by Country (2020-2032) (USD Billion)
9.4.3 Asia Pacific Pharmaceutical Contract Manufacturing Market Estimates and Forecasts, By Service (2020-2032) (USD Billion)
9.4.4 Asia Pacific Pharmaceutical Contract Manufacturing Market Estimates and Forecasts, By End User (2020-2032) (USD Billion)
9.4.5 China
9.4.5.1 China Pharmaceutical Contract Manufacturing Market Estimates and Forecasts, By Service (2020-2032) (USD Billion)
9.4.5.2 China Pharmaceutical Contract Manufacturing Market Estimates and Forecasts, By End User (2020-2032) (USD Billion)
9.4.6 India
9.4.5.1 India Pharmaceutical Contract Manufacturing Market Estimates and Forecasts, By Service (2020-2032) (USD Billion)
9.4.5.2 India Pharmaceutical Contract Manufacturing Market Estimates and Forecasts, By End User (2020-2032) (USD Billion)
9.4.5 Japan
9.4.5.1 Japan Pharmaceutical Contract Manufacturing Market Estimates and Forecasts, By Service (2020-2032) (USD Billion)
9.4.5.2 Japan Pharmaceutical Contract Manufacturing Market Estimates and Forecasts, By End User (2020-2032) (USD Billion)
9.4.6 South Korea
9.4.6.1 South Korea Pharmaceutical Contract Manufacturing Market Estimates and Forecasts, By Service (2020-2032) (USD Billion)
9.4.6.2 South Korea Pharmaceutical Contract Manufacturing Market Estimates and Forecasts, By End User (2020-2032) (USD Billion)
9.4.7 Vietnam
9.4.7.1 Vietnam Pharmaceutical Contract Manufacturing Market Estimates and Forecasts, By Service (2020-2032) (USD Billion)
9.2.7.2 Vietnam Pharmaceutical Contract Manufacturing Market Estimates and Forecasts, By End User (2020-2032) (USD Billion)
9.4.8 Singapore
9.4.8.1 Singapore Pharmaceutical Contract Manufacturing Market Estimates and Forecasts, By Service (2020-2032) (USD Billion)
9.4.8.2 Singapore Pharmaceutical Contract Manufacturing Market Estimates and Forecasts, By End User (2020-2032) (USD Billion)
9.4.9 Australia
9.4.9.1 Australia Pharmaceutical Contract Manufacturing Market Estimates and Forecasts, By Service (2020-2032) (USD Billion)
9.4.9.2 Australia Pharmaceutical Contract Manufacturing Market Estimates and Forecasts, By End User (2020-2032) (USD Billion)
9.4.10 Rest of Asia Pacific
9.4.10.1 Rest of Asia Pacific Pharmaceutical Contract Manufacturing Market Estimates and Forecasts, By Service (2020-2032) (USD Billion)
9.4.10.2 Rest of Asia Pacific Pharmaceutical Contract Manufacturing Market Estimates and Forecasts, By End User (2020-2032) (USD Billion)
9.5 Middle East and Africa
9.5.1 Middle East
9.5.1.1 Trends Analysis
9.5.1.2 Middle East Pharmaceutical Contract Manufacturing Market Estimates and Forecasts, by Country (2020-2032) (USD Billion)
9.5.1.3 Middle East Pharmaceutical Contract Manufacturing Market Estimates and Forecasts, By Service (2020-2032) (USD Billion)
9.5.1.4 Middle East Pharmaceutical Contract Manufacturing Market Estimates and Forecasts, By End User (2020-2032) (USD Billion)
9.5.1.5 UAE
9.5.1.5.1 UAE Pharmaceutical Contract Manufacturing Market Estimates and Forecasts, By Service (2020-2032) (USD Billion)
9.5.1.5.2 UAE Pharmaceutical Contract Manufacturing Market Estimates and Forecasts, By End User (2020-2032) (USD Billion)
9.5.1.6 Egypt
9.5.1.6.1 Egypt Pharmaceutical Contract Manufacturing Market Estimates and Forecasts, By Service (2020-2032) (USD Billion)
9.5.1.6.2 Egypt Pharmaceutical Contract Manufacturing Market Estimates and Forecasts, By End User (2020-2032) (USD Billion)
9.5.1.7 Saudi Arabia
9.5.1.7.1 Saudi Arabia Pharmaceutical Contract Manufacturing Market Estimates and Forecasts, By Service (2020-2032) (USD Billion)
9.5.1.7.2 Saudi Arabia Pharmaceutical Contract Manufacturing Market Estimates and Forecasts, By End User (2020-2032) (USD Billion)
9.5.1.8 Qatar
9.5.1.8.1 Qatar Pharmaceutical Contract Manufacturing Market Estimates and Forecasts, By Service (2020-2032) (USD Billion)
9.5.1.8.2 Qatar Pharmaceutical Contract Manufacturing Market Estimates and Forecasts, By End User (2020-2032) (USD Billion)
9.5.1.9 Rest of Middle East
9.5.1.9.1 Rest of Middle East Pharmaceutical Contract Manufacturing Market Estimates and Forecasts, By Service (2020-2032) (USD Billion)
9.5.1.9.2 Rest of Middle East Pharmaceutical Contract Manufacturing Market Estimates and Forecasts, By End User (2020-2032) (USD Billion)
9.5.2 Africa
9.5.2.1 Trends Analysis
9.5.2.2 Africa Pharmaceutical Contract Manufacturing Market Estimates and Forecasts, by Country (2020-2032) (USD Billion)
9.5.2.3 Africa Pharmaceutical Contract Manufacturing Market Estimates and Forecasts, By Service (2020-2032) (USD Billion)
9.5.2.4 Africa Pharmaceutical Contract Manufacturing Market Estimates and Forecasts, By End User (2020-2032) (USD Billion)
9.5.2.5 South Africa
9.5.2.5.1 South Africa Pharmaceutical Contract Manufacturing Market Estimates and Forecasts, By Service (2020-2032) (USD Billion)
9.5.2.5.2 South Africa Pharmaceutical Contract Manufacturing Market Estimates and Forecasts, By End User (2020-2032) (USD Billion)
9.5.2.6 Nigeria
9.5.2.6.1 Nigeria Pharmaceutical Contract Manufacturing Market Estimates and Forecasts, By Service (2020-2032) (USD Billion)
9.5.2.6.2 Nigeria Pharmaceutical Contract Manufacturing Market Estimates and Forecasts, By End User (2020-2032) (USD Billion)
9.5.2.7 Rest of Africa
9.5.2.7.1 Rest of Africa Pharmaceutical Contract Manufacturing Market Estimates and Forecasts, By Service (2020-2032) (USD Billion)
9.5.2.7.2 Rest of Africa Pharmaceutical Contract Manufacturing Market Estimates and Forecasts, By End User (2020-2032) (USD Billion)
9.6 Latin America
9.6.1 Trends Analysis
9.6.2 Latin America Pharmaceutical Contract Manufacturing Market Estimates and Forecasts, by Country (2020-2032) (USD Billion)
9.6.3 Latin America Pharmaceutical Contract Manufacturing Market Estimates and Forecasts, By Service (2020-2032) (USD Billion)
9.6.4 Latin America Pharmaceutical Contract Manufacturing Market Estimates and Forecasts, By End User (2020-2032) (USD Billion)
9.6.5 Brazil
9.6.5.1 Brazil Pharmaceutical Contract Manufacturing Market Estimates and Forecasts, By Service (2020-2032) (USD Billion)
9.6.5.2 Brazil Pharmaceutical Contract Manufacturing Market Estimates and Forecasts, By End User (2020-2032) (USD Billion)
9.6.6 Argentina
9.6.6.1 Argentina Pharmaceutical Contract Manufacturing Market Estimates and Forecasts, By Service (2020-2032) (USD Billion)
9.6.6.2 Argentina Pharmaceutical Contract Manufacturing Market Estimates and Forecasts, By End User (2020-2032) (USD Billion)
9.6.7 Colombia
9.6.7.1 Colombia Pharmaceutical Contract Manufacturing Market Estimates and Forecasts, By Service (2020-2032) (USD Billion)
9.6.7.2 Colombia Pharmaceutical Contract Manufacturing Market Estimates and Forecasts, By End User (2020-2032) (USD Billion)
9.6.8 Rest of Latin America
9.6.8.1 Rest of Latin America Pharmaceutical Contract Manufacturing Market Estimates and Forecasts, By Service (2020-2032) (USD Billion)
9.6.8.2 Rest of Latin America Pharmaceutical Contract Manufacturing Market Estimates and Forecasts, By End User (2020-2032) (USD Billion)
10. Company Profiles
10.1 Catalent
10.1.1 Company Overview
10.1.2 Financial
10.1.3 Products/ Services Offered
110.1.4 SWOT Analysis
10.2 Lonza
10.2.1 Company Overview
10.2.2 Financial
10.2.3 Products/ Services Offered
10.2.4 SWOT Analysis
10.3 Boehringer Ingelheim
10.3.1 Company Overview
10.3.2 Financial
10.3.3 Products/ Services Offered
10.3.4 SWOT Analysis
10.4 Samsung Biologics
10.4.1 Company Overview
10.4.2 Financial
10.4.3 Products/ Services Offered
10.4.4 SWOT Analysis
10.5 WuXi AppTec
10.5.1 Company Overview
10.5.2 Financial
10.5.3 Products/ Services Offered
10.5.4 SWOT Analysis
10.6 Patheon
10.6.1 Company Overview
10.6.2 Financial
10.6.3 Products/ Services Offered
10.6.4 SWOT Analysis
10.7 AMRI
10.7.1 Company Overview
10.7.2 Financial
10.7.3 Products/ Services Offered
10.7.4 SWOT Analysis
10.8 Recipharm
10.8.1 Company Overview
10.8.2 Financial
10.8.3 Products/ Services Offered
10.8.4 SWOT Analysis
10.9 Siegfried
10.9.1 Company Overview
10.9.2 Financial
10.9.3 Products/ Services Offered
10.9.4 SWOT Analysis
10.10 Jubilant Life Sciences
10.10.1 Company Overview
10.10.2 Financial
10.10.3 Products/ Services Offered
10.10.4 SWOT Analysis
11. Use Cases and Best Practices
12. Conclusion
An accurate research report requires proper strategizing as well as implementation. There are multiple factors involved in the completion of good and accurate research report and selecting the best methodology to compete the research is the toughest part. Since the research reports we provide play a crucial role in any company’s decision-making process, therefore we at SNS Insider always believe that we should choose the best method which gives us results closer to reality. This allows us to reach at a stage wherein we can provide our clients best and accurate investment to output ratio.
Each report that we prepare takes a timeframe of 350-400 business hours for production. Starting from the selection of titles through a couple of in-depth brain storming session to the final QC process before uploading our titles on our website we dedicate around 350 working hours. The titles are selected based on their current market cap and the foreseen CAGR and growth.
The 5 steps process:
Step 1: Secondary Research:
Secondary Research or Desk Research is as the name suggests is a research process wherein, we collect data through the readily available information. In this process we use various paid and unpaid databases which our team has access to and gather data through the same. This includes examining of listed companies’ annual reports, Journals, SEC filling etc. Apart from this our team has access to various associations across the globe across different industries. Lastly, we have exchange relationships with various university as well as individual libraries.
Step 2: Primary Research
When we talk about primary research, it is a type of study in which the researchers collect relevant data samples directly, rather than relying on previously collected data. This type of research is focused on gaining content specific facts that can be sued to solve specific problems. Since the collected data is fresh and first hand therefore it makes the study more accurate and genuine.
We at SNS Insider have divided Primary Research into 2 parts.
Part 1 wherein we interview the KOLs of major players as well as the upcoming ones across various geographic regions. This allows us to have their view over the market scenario and acts as an important tool to come closer to the accurate market numbers. As many as 45 paid and unpaid primary interviews are taken from both the demand and supply side of the industry to make sure we land at an accurate judgement and analysis of the market.
This step involves the triangulation of data wherein our team analyses the interview transcripts, online survey responses and observation of on filed participants. The below mentioned chart should give a better understanding of the part 1 of the primary interview.
Part 2: In this part of primary research the data collected via secondary research and the part 1 of the primary research is validated with the interviews from individual consultants and subject matter experts.
Consultants are those set of people who have at least 12 years of experience and expertise within the industry whereas Subject Matter Experts are those with at least 15 years of experience behind their back within the same space. The data with the help of two main processes i.e., FGDs (Focused Group Discussions) and IDs (Individual Discussions). This gives us a 3rd party nonbiased primary view of the market scenario making it a more dependable one while collation of the data pointers.
Step 3: Data Bank Validation
Once all the information is collected via primary and secondary sources, we run that information for data validation. At our intelligence centre our research heads track a lot of information related to the market which includes the quarterly reports, the daily stock prices, and other relevant information. Our data bank server gets updated every fortnight and that is how the information which we collected using our primary and secondary information is revalidated in real time.
Step 4: QA/QC Process
After all the data collection and validation our team does a final level of quality check and quality assurance to get rid of any unwanted or undesired mistakes. This might include but not limited to getting rid of the any typos, duplication of numbers or missing of any important information. The people involved in this process include technical content writers, research heads and graphics people. Once this process is completed the title gets uploader on our platform for our clients to read it.
Step 5: Final QC/QA Process:
This is the last process and comes when the client has ordered the study. In this process a final QA/QC is done before the study is emailed to the client. Since we believe in giving our clients a good experience of our research studies, therefore, to make sure that we do not lack at our end in any way humanly possible we do a final round of quality check and then dispatch the study to the client.
KEY MARKET SEGMENTATION
BY SERVICE
• Pharmaceutical Manufacturing Services
• Pharmaceutical API Manufacturing Services
• Pharmaceutical FDF Manufacturing Services
• Drug Development Services
• Biologic Manufacturing Services
• Biologic API Manufacturing Services
• Biologic FDF Manufacturing Services
BY END USER
• Big Pharmaceutical Companies
• Small & Mid-Sized Pharmaceutical Companies
• Generic Pharmaceutical Companies
• Other
Request for Segment Customization as per your Business Requirement: Segment Customization Request
REGIONAL COVERAGE:
North America
US
Canada
Mexico
Europe
Eastern Europe
Poland
Romania
Hungary
Turkey
Rest of Eastern Europe
Western Europe
Germany
France
UK
Italy
Spain
Netherlands
Switzerland
Austria
Rest of Western Europe
Asia Pacific
China
India
Japan
South Korea
Vietnam
Singapore
Australia
Rest of Asia Pacific
Middle East & Africa
Middle East
UAE
Egypt
Saudi Arabia
Qatar
Rest of the Middle East
Africa
Nigeria
South Africa
Rest of Africa
Latin America
Brazil
Argentina
Colombia
Rest of Latin America
Request for Country Level Research Report: Country Level Customization Request
Available Customization
With the given market data, SNS Insider offers customization as per the company’s specific needs. The following customization options are available for the report:
Product Analysis
Criss-Cross segment analysis (e.g. Product X Application)
Product Matrix which gives a detailed comparison of product portfolio of each company
Geographic Analysis
Additional countries in any of the regions
Company Information
Detailed analysis and profiling of additional market players (Up to five)
The Precision Oncology Market Size was valued at USD 100.94 Billion in 2023, and is expected to reach USD 217.61 Billion by 2032, and grow at a CAGR of 9.35%.
The Consumer Genomics Market size was estimated at USD 2.18 billion in 2023 and is expected to reach USD 14.08 billion by 2032 at a CAGR of 23.04% during the forecast period of 2024-2032.
The global CBD Skin Care Product Market size is anticipated to touch USD 22191.0 million by 2032, with a growing CAGR of 28.7% over the forecast period 2024-2032.
The Vitrification Market Size, valued at USD 8.23 billion in 2023, is projected to reach USD 33.04 billion by 2032, growing at a CAGR of 16.75%.
The Medical Decision Support Systems for Sepsis Market size was valued at USD 45.10 million in 2023, and is expected to reach USD 328.83 million by 2032, and grow at a CAGR of 24.70% over the forecast period 2024-2032.
The Cell Therapy Human Raw Materials Market Size was valued at USD 2.9 Bn in 2023 and will reach $18.1 Bn by 2032 and grow at a CAGR of 22.6% by 2024-2032.
Hi! Click one of our member below to chat on Phone