Polylactic Acid (PLA) Market Size Analysis:
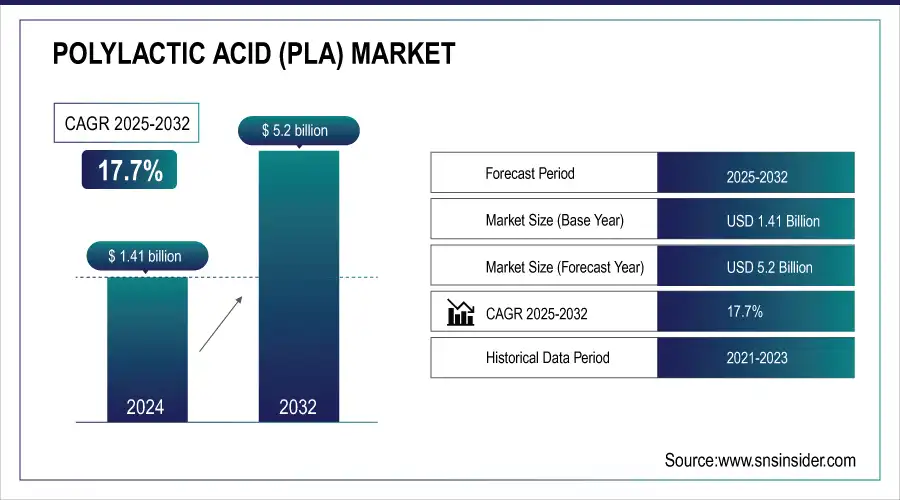
The Polylactic Acid Market Size was valued at USD 1.41 Billion in 2024 and is expected to reach USD 5.2 Billion by 2032, growing at a CAGR of 17.7% over the forecast period 2025-2032.
Polylactic Acid (PLA) is one of the most widely used biodegradable plastics in the world, and its market has grown rapidly due to the increasing demand for sustainable and environmentally-friendly materials. The increasing urge for eco-friendly options to minimize the contribution of petroleum-based plastics to environmental degradation has fueled the demand for PLA, supported by favourable governmental support across the globe. PLA, made from renewable resources such as corn starch, is biodegradable and compostable, aligning with sustainability goals. Support through regulations promoting the use of biodegradable polymers, particularly in packaging, helped strengthen the PLA market in 2023, specifically in the government sector. For instance, the U.S. Department of Agriculture (USDA) reports that the global demand for bioplastics, including PLA, is growing as countries adopt policies targeting a reduction in single-use plastic waste.

Get More Information on Polylactic Acid (PLA) Market - Request Sample Report
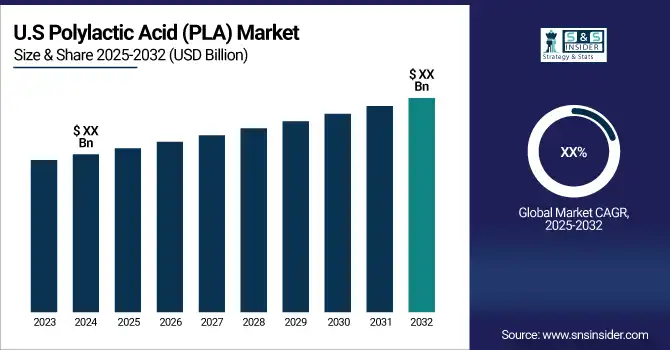
Polylactic Acid (PLA) Market Size and Forecast:
-
Market Size in 2024: USD 1.41 Billion
-
Market Size by 2032: USD 5.20 Billion
-
CAGR: 17.7% from 2025 to 2032
-
Base Year: 2024
-
Forecast Period: 2025–2032
-
Historical Data: 2021–2023
Key Polylactic Acid (PLA) Market Trends:
-
Rising adoption of biodegradable plastics in packaging reduces environmental pollution, driving demand for sustainable alternatives like PLA.
-
Increasing use of PLA in 3D printing supports lightweight, durable, and customizable product manufacturing across industries.
-
Growth in medical applications, including implants and drug delivery systems, leverages PLA’s biocompatibility and biodegradability.
-
Advancements in polymer blending and compounding enhance PLA’s thermal stability, mechanical strength, and processability for diverse applications.
-
Government regulations and bans on single-use plastics accelerate PLA adoption in consumer and industrial packaging.
-
Expansion in the food and beverage sector promotes PLA-based containers, films, and cutlery due to compostability and safety compliance.
-
Investment in large-scale PLA production facilities reduces costs, enabling wider industrial adoption and competitive pricing.
Driven by increased legislative activity, such as the Circular Economy Action Plan from the European Union, the PLA market, for example, had a positive benefit from the potential increase in recycling and utilization of bio-based materials in 2023. Meanwhile, bioplastics such as PLA have also been reported to contribute to lowering reliance on fossil resources, according to the U.S. Environmental Protection Agency (EPA). Governments further provided financial support to firms creating PLA-based applications and PLA manufacturing infrastructure. Consequently, production capacity and adoption across sectors such as packaging, automotive, and textiles have increased for PLA.
Polylactic Acid (PLA) Market Drivers:
-
Increased environmental awareness and the shift towards eco-friendly alternatives are driving demand for PLA, especially in sectors like packaging and textiles.
-
Governments worldwide are introducing regulations to reduce plastic waste, which promotes the adoption of biodegradable materials like PLA in industries such as packaging and agriculture.
-
Continuous R&D in PLA manufacturing techniques is improving the material’s properties, expanding its applications, particularly in automotive and electronics.
The growth of the Polylactic Acid (PLA) market is driven by the demand for sustainable & bio-degradable materials resulting from growing environmental concerns and a global shift toward reducing plastic waste. As a renewable and biodegradable alternative to conventional plastics, PLA is widely used in packaging, textiles, and agriculture. The packaging industry, being one of the largest consumers of PLA, has witnessed an eco-friendly transformation as many brands and companies are opting for biodegradable solutions in response to the consumer demand for greener alternatives. Take Coca-Cola for example, which aims high on its path to sustainability and is determined to manufacture sustainable packaging including PLA- bottled beverages to achieve its environmental objectives.
Moreover, stricter regulations against plastic waste introduced by several governments around the world over the past few years have spurred the demand for PLA. To illustrate, the Single-Use Plastics Directive from the European Union, which limits specific plastic products, has forced sectors to use biodegradable substitutes, such as PLA. Moreover, the improved heat resistance and flexible properties of PLA, owing to technological advancements in its production, are pushing its utilization in many sectors, thereby proving suitable for high-demand automotive and electronics sectors. In the textile industry, PLA fibers have been included in eco-friendly clothing lines by brands such as Patagonia. Combined with innovative developments in the PLA process, this will keep the material relevant in the fight against the growing worldwide plastic pollution.
Polylactic Acid (PLA) Market Restraints:
-
PLA remains more expensive than traditional plastics due to its complex production process, limiting its widespread adoption, especially in price-sensitive markets.
-
PLA has lower heat resistance compared to conventional plastics, restricting its use in high-temperature applications, particularly in electronics and automotive sectors
One significant restraint in the Polylactic Acid (PLA) market is its limited heat resistance. PLA has a reputation for being less heat-resistant than ordinary petroleum-based plastics. This restriction hinders its application in areas of high temperature such as automotive components, electronics, and some food packaging. As an example, PLA softens even at low temperatures (approx 60°C), which means items that are exposed to significant heat (or sun) will be unsuitable for the product (source). Continued attention has gone into this area which focuses on increasing PLA heat tolerable thresholds via novel additives and modifications to PLA itself. Nonetheless, these advances still have not paved the way out of the heat resistance conundrum for PLA yet, making it difficult to use PLA in applications requiring high long-term durability and heat-stability material properties . Although PLA has sustainability advantages, this issue continues to be a major barrier to the widespread implementation of PLA.
Polylactic Acid (PLA) Market Segmentation Analysis:
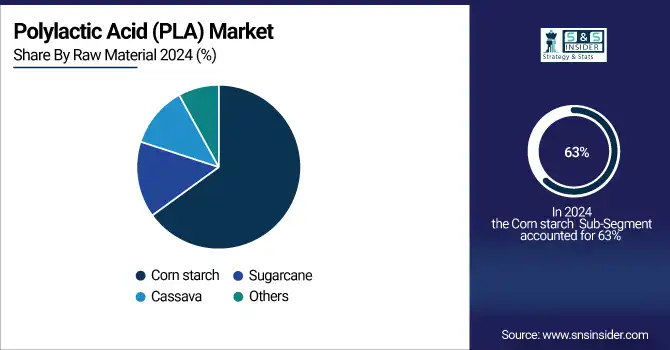
By Raw Material, Corn Starch Dominates the PLA Market Due to High Yield and Government Support
The corn starch accounted for the largest revenue share of the PLA market with 63% revenue share in 2024. This dominance is largely attributed to the availability of corn as an extensive renewable resource along with low-cost feedstock of corn for PLA production. PLA has flourished in the U.S. and Brazil, among the largest corn producers in the world, through the support of agriculture subsidies and government plans to promote bio-based materials. U.S. production of corn starch reached well above 400 million bushels in 2023, per estimates from the U.S. Department of Agriculture (USDA), thanks in large part to growing needs for PLA and associated biodegradable packing materials.
Corn starch also has some advantages over sugarcane, tapioca, or other raw materials. It has a high yield on lactic acid, which then can be transformed into PLA, and therefore, high-scale deployment potential. Corn starch is a key input in PLA production and government support for corn-based products through Farm Bill policies such as bonus points for environmentally beneficial farming practices fortify its use in PLA production. In addition, the U.S. Environmental Protection Agency (EPA) has classified PLA as a key polymer for plastic waste reduction and carbon emissions reduction, placing corn starch-derived PLA as the preferred bio-based alternative for eco-conscious industries.
By Application, Rigid Thermoform Packaging Leads PLA Demand Driven by Biodegradability and Food Industry Adoption
The rigid thermoform application segment of the PLA market accounted for the largest revenue share about 43% in 2024. Demand for biodegradable and compostable rigid thermoform packaging is increasing owing to its utilization in food packaging applications. Motivated by increasing awareness of environmental issues and the introduction of several government initiatives prompting stakeholders to adopt practices that eliminate the amount of waste generated and use bioplastics extensively across assorted channels, the global food industry is likely to witness a shift towards sustainable packaging shortly. The rising use of eco-friendly packaging as a result of government policies such as the European Union's Packaging and Packaging Waste Directive is driving the demand for PLA in this segment.
Thus rigid thermoform packaging is ideal for fresh food and beverages which means that PLA is the best alternative to traditional plastic materials. In addition, with many governments around the world now prohibiting single-use plastics in many applications, particularly within the food industry PLA is appealing since it is biodegradable and will degrade in compost conditions. PLA is just one of the biodegradable packaging solutions that can reduce the amount of plastic waste in landfills and address the problems of waste management according to the U.S. Environmental Protection Agency (EPA). In line with the push toward sustainability, sectors such as food, beverage, and consumer goods are now adopting rigid thermoform packaging that utilizes PLA. An increase in demand is also supported by government regulations; for example, the U.S. Food and Drug Administration has approved the use of PLA for food contact.
By End-use, the Packaging Segment Drives PLA Market Growth Through Sustainability and Regulatory Compliance
The packaging segment dominated the end-use segment of the PLA market in 2024, with more than 36% of the market revenue share. The packaging industry’s dominance in PLA consumption is attributed to the global push for sustainable packaging solutions. Amid rising worries about plastic at the inner and outer layer of the environment and sustainability for future generations of life, various governments are routinely stimulating plants to use less plastic, thus producing a lot of things made of a biodegradable material, PLA. The U.S. Environmental Protection Agency (EPA) includes the packaging industry as one of the major sources of plastic waste and indicates that merely switching to biodegradable counterparts like PLA would be a great solution to minimizing damage from plastic waste.
Policies, including the Plastics Strategy of the European Union, have been established by governments to reduce plastic packaging waste and to promote compostable packaging materials. Additionally, in the United States, the Sustainable Packaging Coalition has been launching efforts to develop PLA as a real alternative to conventional plastics. The result has been the emergence of PLA as the go-to material in high-performance, sustainability-sensitive applications, such as food packaging, beverage containers, and consumer goods. Moreover, the compostable and biodegradable properties of PLA have further proven to be useful in the packaging industries by minimizing landfill space and a smaller ecological footprint. As consumers and regulators continue to seek sustainable packaging solutions, demand is likely to remain robust.
Polylactic Acid Market Regional Overview:
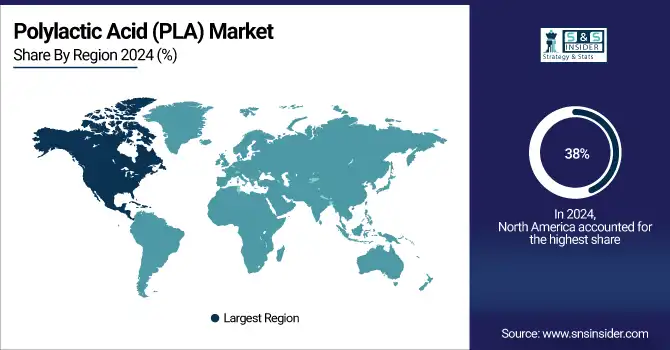
North America Dominates Polylactic Acid Market in 2024
North America holds an estimated 38% market share in 2024, driven by government incentives for biodegradable plastics, high corn production, and growing packaging industry demand. This causes manufacturers to invest in PLA production and adopt sustainable packaging solutions across industries.
-
United States Leads North America’s PLA Market
The U.S. dominates due to large-scale corn production, advanced bioplastics manufacturing infrastructure, and supportive government policies such as the Farm Bill and EPA initiatives promoting PLA adoption. Investments by packaging and food companies to switch from conventional plastics to biodegradable alternatives further reinforce market leadership. Additionally, growing consumer awareness about environmental sustainability encourages PLA usage across food, beverage, and consumer goods industries. The combination of raw material availability, technological capability, and regulatory support positions the U.S. as the largest contributor to North America’s PLA market.
Asia Pacific is the Fastest-Growing Region in Polylactic Acid Market in 2024
The region is expected to grow at a CAGR of 21.5% from 2025–2032, driven by rising demand for sustainable packaging, rapid industrialization, and government-backed green initiatives. This causes businesses to adopt PLA for food packaging, consumer goods, and industrial applications.
-
China Leads Asia Pacific’s PLA Market
China dominates due to its robust manufacturing base, increasing investments in bioplastics, and government initiatives supporting sustainable packaging and environmental protection. The country is the largest consumer of packaging materials globally, and rising concerns about plastic pollution have accelerated PLA adoption in food, beverage, and e-commerce industries. Combined with abundant corn and starch feedstock availability, PLA production is scaling rapidly. International collaborations and technological advancements in PLA polymerization further reinforce China’s leadership in Asia Pacific, making it the fastest-growing PLA market in the region.
Europe Polylactic Acid Market Insights, 2024
Europe is witnessing strong PLA market growth, driven by strict regulations on single-use plastics, government sustainability programs, and rising consumer preference for eco-friendly packaging. Germany’s policies promoting biodegradable plastics and sustainable packaging adoption encourage manufacturers to shift from conventional plastics, boosting PLA demand.
-
Germany Leads Europe’s PLA Market
Germany dominates due to progressive environmental policies, high consumer awareness of sustainability, and strong presence of packaging and bioplastics companies. Initiatives such as the European Union’s Plastics Strategy and Packaging Waste Directive further reinforce PLA adoption in food and consumer goods sectors. Germany’s commitment to circular economy practices and investment in biopolymer R&D ensure continuous growth, making it the leading European contributor to the PLA market.
Middle East & Africa and Latin America Polylactic Acid Market Insights, 2024
PLA adoption in these regions is steadily increasing, supported by rising environmental awareness, government sustainability mandates, and the expansion of food and beverage industries. Countries such as Brazil, Mexico, UAE, and South Africa are investing in biodegradable packaging infrastructure, promoting PLA usage. International collaborations and technology transfers are accelerating production and application of PLA in packaging, consumer goods, and industrial segments. Growing interest in reducing plastic waste and aligning with global sustainability targets is driving steady PLA market expansion across both regions.

Get Customized Report as per Your Business Requirement - Request For Customized Report
Competitive Landscape for Polylactic Acid (PLA) Market:
NatureWorks
NatureWorks is a U.S.-based global leader in polylactic acid (PLA) production, specializing in bio-based polymers for packaging, fibers, and industrial applications. The company produces Ingeo™ PLA resins, offering sustainable alternatives to conventional plastics with biodegradable and compostable properties. NatureWorks operates vertically integrated production, managing raw material sourcing, polymerization, and product delivery. Its role in the PLA market is vital, as it provides high-performance, eco-friendly solutions that reduce carbon footprint and plastic waste across multiple industries. NatureWorks supports brands and manufacturers in transitioning to sustainable packaging and bioplastics while maintaining product quality and functionality.
-
In 2024, NatureWorks expanded its Ingeo™ PLA portfolio, introducing higher-melt and faster-composting variants for rigid packaging, thermoformed containers, and 3D printing applications.
Total Corbion PLA
Total Corbion PLA is a joint venture between TotalEnergies and Corbion, headquartered in the Netherlands, producing bio-based polylactic acid for packaging, food service, and disposable products. The company focuses on high-quality PLA resins with excellent thermal stability, mechanical performance, and compostability. Its role in the PLA market is significant, offering scalable, sustainable polymer solutions to meet global demand for environmentally friendly packaging. Total Corbion PLA enables industries to reduce reliance on petroleum-based plastics and comply with increasing regulatory requirements on single-use plastics and waste reduction.
-
In 2024, Total Corbion PLA launched advanced PLA grades suitable for high-performance thermoforming and extrusion applications, targeting food packaging and industrial solutions.
BASF
BASF, headquartered in Germany, is a leading chemical company producing polylactic acid solutions under its eco-friendly product portfolio for packaging, consumer goods, and industrial applications. The company integrates R&D, polymer technology, and sustainability practices to provide biodegradable and compostable PLA resins. BASF’s role in the PLA market is central, as it enables manufacturers to meet stringent environmental regulations while maintaining product performance. By supplying high-quality biopolymers and collaborating with global brands, BASF drives the adoption of sustainable materials in multiple sectors.
-
In 2024, BASF expanded its PLA solutions with new grades optimized for rigid packaging, consumer products, and injection molding applications, improving thermal and mechanical performance.
Galactic
Galactic is a Belgium-based leader in lactic acid and polylactic acid solutions, offering biopolymers for packaging, food additives, and industrial applications. The company specializes in high-purity lactic acid and PLA derivatives, supporting sustainable material innovation for biodegradable and compostable solutions. Galactic plays a key role in the PLA market by providing eco-conscious alternatives to traditional plastics, enabling companies to reduce environmental impact and enhance circular economy initiatives. Its expertise in lactic acid chemistry ensures high-quality polymers with scalable production capabilities for global applications.
-
In 2024, Galactic introduced new PLA formulations for flexible films, biodegradable coatings, and food-contact applications, expanding its sustainable product portfolio across multiple industries.
Polylactic Acid (PLA) Market Key Players:
-
Total Corbion PLA
-
Galactic
-
Futerro
-
Synbra Technology
-
Zhejiang Hisun Biomaterials Co., Ltd.
-
Shimadzu Corporation
-
Evonik Industries AG
-
Shenzhen Esun Industrial Co., Ltd.
-
Corbion N.V.
-
Danimer Scientific
-
Biome Bioplastics
-
Meredian Holdings Group
-
Shenzhen Polymtek Biomaterials Co., Ltd.
-
Guangdong Green Innovation Materials Co., Ltd.
-
Suzhou Huaan Biotechnology Co., Ltd.
-
Foresight Group
-
Toray Industries, Inc.
-
Henan Jindan Lactic Acid Technology Co., Ltd.
Report Attributes | Details |
---|---|
Market Size in 2024 | USD 1.41 Billion |
Market Size by 2032 | USD 5.2 Billion |
CAGR | CAGR of 17.7% From 2025 to 2032 |
Base Year | 2024 |
Forecast Period | 2025-2032 |
Historical Data | 2021-2023 |
Report Scope & Coverage | Market Size, Segments Analysis, Competitive Landscape, Regional Analysis, DROC & SWOT Analysis, Forecast Outlook |
Key Segments | • By Raw Material (Corn starch, Sugarcane, Cassava, Others) • By Grade (Thermoforming, Injection Molding, Extrusion, Blow Molding, Others) • By Application (Rigid thermoform, Film & sheets, Bottles, Others) • By End-use (Packaging, Agriculture, Automotive & Transportation, Electronics, Textile, Consumer goods, Bio-medical, Others) |
Regional Analysis/Coverage | North America (US, Canada, Mexico), Europe (Eastern Europe [Poland, Romania, Hungary, Turkey, Rest of Eastern Europe] Western Europe [Germany, France, UK, Italy, Spain, Netherlands, Switzerland, Austria, Rest of Western Europe]), Asia Pacific (China, India, Japan, South Korea, Vietnam, Singapore, Australia, Rest of Asia Pacific), Middle East & Africa (Middle East [UAE, Egypt, Saudi Arabia, Qatar, Rest of Middle East], Africa [Nigeria, South Africa, Rest of Africa], Latin America (Brazil, Argentina, Colombia, Rest of Latin America) |
Company Profiles |
NatureWorks, Total Corbion PLA, BASF, Galactic, Futerro, Synbra Technology, Zhejiang Hisun Biomaterials, Shimadzu Corporation, Evonik Industries, Shenzhen Esun Industrial, Corbion N.V., Danimer Scientific, Biome Bioplastics, Meredian Holdings Group, Shenzhen Polymtek Biomaterials, Guangdong Green Innovation Materials, Suzhou Huaan Biotechnology, Foresight Group, Toray Industries, Henan Jindan Lactic Acid Technology. |
Table Of Contents
1. Introduction
1.1 Market Definition & Scope
1.2 Research Assumptions & Abbreviations
1.3 Research Methodology
2. Executive Summary
2.1 Market Snapshot
2.2 Market Absolute $ Opportunity Assessment & Y-o-Y Analysis, 2021–2032
2.3 Market Size & Forecast, By Segmentation, 2021–2032
2.3.1 Market Size By Raw Material
2.3.2 Market Size By Grade
2.3.3 Market Size By End-use
2.3.4 Market Size By Application
2.4 Market Share & Bps Analysis By Region, 2024
2.5 Industry Growth Scenarios – Conservative, Likely & Optimistic
2.6 Industry CxO’s Perspective
3. Market Overview
3.1 Market Dynamics
3.1.1 Drivers
3.1.2 Restraints
3.1.3 Opportunities
3.1.4 Key Market Trends
3.2 Industry PESTLE Analysis
3.3 Key Industry Forces (Porter’s) Impacting Market Growth
3.4 Industry Supply Chain Analysis
3.4.1 Raw Material Suppliers
3.4.2 Manufacturers
3.4.3 Distributors/Suppliers
3.4.4 Customers/End-Users
3.5 Industry Life Cycle Assessment
3.6 Parent Market Overview
3.7 Market Risk Assessment
4. Statistical Insights & Trends Reporting
4.1 Production & Capacity Metrics
4.1.1 Annual PLA production volume by major manufacturers (tons/year)
4.1.2 Installed PLA manufacturing capacity by region and feedstock type
4.1.3 Average plant utilization rate (%) across PLA production facilities
4.2 Feedstock & Sustainability Insights
4.2.1 Share (%) of corn-based vs. sugarcane-based PLA production
4.2.2 Average yield of PLA per ton of raw material
4.2.3 Reduction in carbon footprint (kg CO₂/ton PLA) compared to petroleum-based plastics
4.3 Application & End-Use Statistics
4.3.1 PLA consumption share (%) across packaging, textiles, biomedical, and 3D printing
4.3.2 Growth rate of PLA adoption in food-contact vs. industrial applications
4.3.3 Average amount of PLA used per product type (kg/unit)
4.4 Regulatory & Certification Trends
4.4.1 Percentage of PLA producers with ISO, FDA, or compostability certifications
4.4.2 Share (%) of PLA products compliant with EU or US bioplastic regulations
4.4.3 Number of new PLA grades approved annually for medical or food applications
5. Polylactic Acid (PLA) Market Segmental Analysis & Forecast, By Raw Material, 2021 – 2032, Value (USD Billion)
5.1 Introduction
5.2 Corn starch
5.2.1 Key Trends
5.2.2 Market Size & Forecast, 2021 – 2032
5.3 Sugarcane
5.4 Cassava
5.5 Others
6. Polylactic Acid (PLA) Market Segmental Analysis & Forecast, By Grade, 2021 – 2032, Value (USD Billion)
6.1 Introduction
6.2 Thermoforming
6.2.1 Key Trends
6.2.2 Market Size & Forecast, 2021 – 2032
6.3 Injection Molding
6.4 Extrusion
6.5 Blow Molding
6.6 Others
7. Polylactic Acid (PLA) Market Segmental Analysis & Forecast, By End-use, 2021 – 2032, Value (USD Billion)
7.1 Introduction
7.2 Packaging
7.2.1 Key Trends
7.2.2 Market Size & Forecast, 2021 – 2032
7.3 Agriculture
7.4 Automotive & Transportation
7.5 Electronics
7.6 Textile
7.7 Consumer goods
7.8 Bio-medical
7.9 Others
8. Polylactic Acid (PLA) Market Segmental Analysis & Forecast, By Application, 2021 – 2032, Value (USD Billion)
8.1 Introduction
8.2 Rigid thermoforms
8.2.1 Key Trends
8.2.2 Market Size & Forecast, 2021 – 2032
8.3 Film & Sheets
8.4 Bottles
8.5 Others
9. Polylactic Acid (PLA) Market Segmental Analysis & Forecast By Region, 2021 – 2025, Value (USD Billion)
9.1 Introduction
9.2 North America
9.2.1 Key Trends
9.2.2 Polylactic Acid (PLA) Market Size & Forecast, By Raw Material, 2021 – 2032
9.2.3 Polylactic Acid (PLA) Market Size & Forecast, By Grade, 2021 – 2032
9.2.4 Polylactic Acid (PLA) Market Size & Forecast, By End-use, 2021 – 2032
9.2.5 Polylactic Acid (PLA) Market Size & Forecast, By Application, 2021 – 2032
9.2.6 Polylactic Acid (PLA) Market Size & Forecast, By Country, 2021 – 2032
9.2.6.1 USA
9.2.6.1.1 Polylactic Acid (PLA) Market Size & Forecast, By Raw Material, 2021 – 2032
9.2.6.1.2 Polylactic Acid (PLA) Market Size & Forecast, By Grade, 2021 – 2032
9.2.6.1.3 Polylactic Acid (PLA) Market Size & Forecast, By End-use, 2021 – 2032
9.2.6.1.4 Polylactic Acid (PLA) Market Size & Forecast, By Application, 2021 – 2032
9.2.6.2 Canada
9.2.6.2.1 Polylactic Acid (PLA) Market Size & Forecast, By Raw Material, 2021 – 2032
9.2.6.2.2 Polylactic Acid (PLA) Market Size & Forecast, By Grade, 2021 – 2032
9.2.6.2.3 Polylactic Acid (PLA) Market Size & Forecast, By End-use, 2021 – 2032
9.2.6.2.4 Polylactic Acid (PLA) Market Size & Forecast, By Application, 2021 – 2032
9.3 Europe
9.3.1 Key Trends
9.3.2 Polylactic Acid (PLA) Market Size & Forecast, By Raw Material, 2021 – 2032
9.3.3 Polylactic Acid (PLA) Market Size & Forecast, By Grade, 2021 – 2032
9.3.4 Polylactic Acid (PLA) Market Size & Forecast, By End-use, 2021 – 2032
9.3.5 Polylactic Acid (PLA) Market Size & Forecast, By Application, 2021 – 2032
9.3.6 Polylactic Acid (PLA) Market Size & Forecast, By Country, 2021 – 2032
9.3.6.1 Germany
9.3.6.1.1 Polylactic Acid (PLA) Market Size & Forecast, By Raw Material, 2021 – 2032
9.3.6.1.2 Polylactic Acid (PLA) Market Size & Forecast, By Grade, 2021 – 2032
9.3.6.1.3 Polylactic Acid (PLA) Market Size & Forecast, By End-use, 2021 – 2032
9.3.6.1.4 Polylactic Acid (PLA) Market Size & Forecast, By Application, 2021 – 2032
9.3.6.2 UK
9.3.6.2.1 Polylactic Acid (PLA) Market Size & Forecast, By Raw Material, 2021 – 2032
9.3.6.2.2 Polylactic Acid (PLA) Market Size & Forecast, By Grade, 2021 – 2032
9.3.6.2.3 Polylactic Acid (PLA) Market Size & Forecast, By End-use, 2021 – 2032
9.3.6.2.4 Polylactic Acid (PLA) Market Size & Forecast, By Application, 2021 – 2032
9.3.6.3 France
9.3.6.3.1 Polylactic Acid (PLA) Market Size & Forecast, By Raw Material, 2021 – 2032
9.3.6.3.2 Polylactic Acid (PLA) Market Size & Forecast, By Grade, 2021 – 2032
9.3.6.3.3 Polylactic Acid (PLA) Market Size & Forecast, By End-use, 2021 – 2032
9.3.6.3.4 Polylactic Acid (PLA) Market Size & Forecast, By Application, 2021 – 2032
9.3.6.4 Italy
9.3.6.4.1 Polylactic Acid (PLA) Market Size & Forecast, By Raw Material, 2021 – 2032
9.3.6.4.2 Polylactic Acid (PLA) Market Size & Forecast, By Grade, 2021 – 2032
9.3.6.4.3 Polylactic Acid (PLA) Market Size & Forecast, By End-use, 2021 – 2032
9.3.6.4.4 Polylactic Acid (PLA) Market Size & Forecast, By Application, 2021 – 2032
9.3.6.5 Spain
9.3.6.5.1 Polylactic Acid (PLA) Market Size & Forecast, By Raw Material, 2021 – 2032
9.3.6.5.2 Polylactic Acid (PLA) Market Size & Forecast, By Grade, 2021 – 2032
9.3.6.5.3 Polylactic Acid (PLA) Market Size & Forecast, By End-use, 2021 – 2032
9.3.6.5.4 Polylactic Acid (PLA) Market Size & Forecast, By Application, 2021 – 2032
9.3.6.6 Russia
9.3.6.6.1 Polylactic Acid (PLA) Market Size & Forecast, By Raw Material, 2021 – 2032
9.3.6.6.2 Polylactic Acid (PLA) Market Size & Forecast, By Grade, 2021 – 2032
9.3.6.6.3 Polylactic Acid (PLA) Market Size & Forecast, By End-use, 2021 – 2032
9.3.6.6.4 Polylactic Acid (PLA) Market Size & Forecast, By Application, 2021 – 2032
9.3.6.7 Poland
9.3.6.7.1 Polylactic Acid (PLA) Market Size & Forecast, By Raw Material, 2021 – 2032
9.3.6.7.2 Polylactic Acid (PLA) Market Size & Forecast, By Grade, 2021 – 2032
9.3.6.7.3 Polylactic Acid (PLA) Market Size & Forecast, By End-use, 2021 – 2032
9.3.6.7.4 Polylactic Acid (PLA) Market Size & Forecast, By Application, 2021 – 2032
9.3.6.8 Rest of Europe
9.3.6.8.1 Polylactic Acid (PLA) Market Size & Forecast, By Raw Material, 2021 – 2032
9.3.6.8.2 Polylactic Acid (PLA) Market Size & Forecast, By Grade, 2021 – 2032
9.3.6.8.3 Polylactic Acid (PLA) Market Size & Forecast, By End-use, 2021 – 2032
9.3.6.8.4 Polylactic Acid (PLA) Market Size & Forecast, By Application, 2021 – 2032
9.4 Asia-Pacific
9.4.1 Key Trends
9.4.2 Polylactic Acid (PLA) Market Size & Forecast, By Raw Material, 2021 – 2032
9.4.3 Polylactic Acid (PLA) Market Size & Forecast, By Grade, 2021 – 2032
9.4.4 Polylactic Acid (PLA) Market Size & Forecast, By End-use, 2021 – 2032
9.4.5 Polylactic Acid (PLA) Market Size & Forecast, By Application, 2021 – 2032
9.4.6 Polylactic Acid (PLA) Market Size & Forecast, By Country, 2021 – 2032
9.4.6.1 China
9.4.6.1.1 Polylactic Acid (PLA) Market Size & Forecast, By Raw Material, 2021 – 2032
9.4.6.1.2 Polylactic Acid (PLA) Market Size & Forecast, By Grade, 2021 – 2032
9.4.6.1.3 Polylactic Acid (PLA) Market Size & Forecast, By End-use, 2021 – 2032
9.4.6.1.4 Polylactic Acid (PLA) Market Size & Forecast, By Application, 2021 – 2032
9.4.6.2 India
9.4.6.2.1 Polylactic Acid (PLA) Market Size & Forecast, By Raw Material, 2021 – 2032
9.4.6.2.2 Polylactic Acid (PLA) Market Size & Forecast, By Grade, 2021 – 2032
9.4.6.2.3 Polylactic Acid (PLA) Market Size & Forecast, By End-use, 2021 – 2032
9.4.6.2.4 Polylactic Acid (PLA) Market Size & Forecast, By Application, 2021 – 2032
9.4.6.3 Japan
9.4.6.3.1 Polylactic Acid (PLA) Market Size & Forecast, By Raw Material, 2021 – 2032
9.4.6.3.2 Polylactic Acid (PLA) Market Size & Forecast, By Grade, 2021 – 2032
9.4.6.3.3 Polylactic Acid (PLA) Market Size & Forecast, By End-use, 2021 – 2032
9.4.6.3.4 Polylactic Acid (PLA) Market Size & Forecast, By Application, 2021 – 2032
9.4.6.4 South Korea
9.4.6.4.1 Polylactic Acid (PLA) Market Size & Forecast, By Raw Material, 2021 – 2032
9.4.6.4.2 Polylactic Acid (PLA) Market Size & Forecast, By Grade, 2021 – 2032
9.4.6.4.3 Polylactic Acid (PLA) Market Size & Forecast, By End-use, 2021 – 2032
9.4.6.4.4 Polylactic Acid (PLA) Market Size & Forecast, By Application, 2021 – 2032
9.4.6.5 Australia
9.4.6.5.1 Polylactic Acid (PLA) Market Size & Forecast, By Raw Material, 2021 – 2032
9.4.6.5.2 Polylactic Acid (PLA) Market Size & Forecast, By Grade, 2021 – 2032
9.4.6.5.3 Polylactic Acid (PLA) Market Size & Forecast, By End-use, 2021 – 2032
9.4.6.5.4 Polylactic Acid (PLA) Market Size & Forecast, By Application, 2021 – 2032
9.4.6.6 ASEAN Countries
9.4.6.6.1 Polylactic Acid (PLA) Market Size & Forecast, By Raw Material, 2021 – 2032
9.4.6.6.2 Polylactic Acid (PLA) Market Size & Forecast, By Grade, 2021 – 2032
9.4.6.6.3 Polylactic Acid (PLA) Market Size & Forecast, By End-use, 2021 – 2032
9.4.6.6.4 Polylactic Acid (PLA) Market Size & Forecast, By Application, 2021 – 2032
9.4.6.7 Rest of Asia-Pacific
9.4.6.7.1 Polylactic Acid (PLA) Market Size & Forecast, By Raw Material, 2021 – 2032
9.4.6.7.2 Polylactic Acid (PLA) Market Size & Forecast, By Grade, 2021 – 2032
9.4.6.7.3 Polylactic Acid (PLA) Market Size & Forecast, By End-use, 2021 – 2032
9.4.6.7.4 Polylactic Acid (PLA) Market Size & Forecast, By Application, 2021 – 2032
9.5 Latin America
9.5.1 Key Trends
9.5.2 Polylactic Acid (PLA) Market Size & Forecast, By Raw Material, 2021 – 2032
9.5.3 Polylactic Acid (PLA) Market Size & Forecast, By Grade, 2021 – 2032
9.5.4 Polylactic Acid (PLA) Market Size & Forecast, By End-use, 2021 – 2032
9.5.5 Polylactic Acid (PLA) Market Size & Forecast, By Application, 2021 – 2032
9.5.6 Polylactic Acid (PLA) Market Size & Forecast, By Country, 2021 – 2032
9.5.6.1 Brazil
9.5.6.1.1 Polylactic Acid (PLA) Market Size & Forecast, By Raw Material, 2021 – 2032
9.5.6.1.2 Polylactic Acid (PLA) Market Size & Forecast, By Grade, 2021 – 2032
9.5.6.1.3 Polylactic Acid (PLA) Market Size & Forecast, By End-use, 2021 – 2032
9.5.6.1.4 Polylactic Acid (PLA) Market Size & Forecast, By Application, 2021 – 2032
9.5.6.2 Argentina
9.5.6.2.1 Polylactic Acid (PLA) Market Size & Forecast, By Raw Material, 2021 – 2032
9.5.6.2.2 Polylactic Acid (PLA) Market Size & Forecast, By Grade, 2021 – 2032
9.5.6.2.3 Polylactic Acid (PLA) Market Size & Forecast, By End-use, 2021 – 2032
9.5.6.2.4 Polylactic Acid (PLA) Market Size & Forecast, By Application, 2021 – 2032
9.5.6.3 Mexico
9.5.6.3.1 Polylactic Acid (PLA) Market Size & Forecast, By Raw Material, 2021 – 2032
9.5.6.3.2 Polylactic Acid (PLA) Market Size & Forecast, By Grade, 2021 – 2032
9.5.6.3.3 Polylactic Acid (PLA) Market Size & Forecast, By End-use, 2021 – 2032
9.5.6.3.4 Polylactic Acid (PLA) Market Size & Forecast, By Application, 2021 – 2032
9.5.6.4 Colombia
9.5.6.4.1 Polylactic Acid (PLA) Market Size & Forecast, By Raw Material, 2021 – 2032
9.5.6.4.2 Polylactic Acid (PLA) Market Size & Forecast, By Grade, 2021 – 2032
9.5.6.4.3 Polylactic Acid (PLA) Market Size & Forecast, By End-use, 2021 – 2032
9.5.6.4.4 Polylactic Acid (PLA) Market Size & Forecast, By Application, 2021 – 2032
9.5.6.5 Rest of Latin America
9.5.6.5.1 Polylactic Acid (PLA) Market Size & Forecast, By Raw Material, 2021 – 2032
9.5.6.5.2 Polylactic Acid (PLA) Market Size & Forecast, By Grade, 2021 – 2032
9.5.6.5.3 Polylactic Acid (PLA) Market Size & Forecast, By End-use, 2021 – 2032
9.5.6.5.4 Polylactic Acid (PLA) Market Size & Forecast, By Application, 2021 – 2032
9.6 Middle East & Africa
9.6.1 Key Trends
9.6.2 Polylactic Acid (PLA) Market Size & Forecast, By Raw Material, 2021 – 2032
9.6.3 Polylactic Acid (PLA) Market Size & Forecast, By Grade, 2021 – 2032
9.6.4 Polylactic Acid (PLA) Market Size & Forecast, By End-use, 2021 – 2032
9.6.5 Polylactic Acid (PLA) Market Size & Forecast, By Application, 2021 – 2032
9.6.6 Polylactic Acid (PLA) Market Size & Forecast, By Country, 2021 – 2032
9.6.6.1 UAE
9.6.6.1.1 Polylactic Acid (PLA) Market Size & Forecast, By Raw Material, 2021 – 2032
9.6.6.1.2 Polylactic Acid (PLA) Market Size & Forecast, By Grade, 2021 – 2032
9.6.6.1.3 Polylactic Acid (PLA) Market Size & Forecast, By End-use, 2021 – 2032
9.6.6.1.4 Polylactic Acid (PLA) Market Size & Forecast, By Application, 2021 – 2032
9.6.6.2 Saudi Arabia
9.6.6.2.1 Polylactic Acid (PLA) Market Size & Forecast, By Raw Material, 2021 – 2032
9.6.6.2.2 Polylactic Acid (PLA) Market Size & Forecast, By Grade, 2021 – 2032
9.6.6.2.3 Polylactic Acid (PLA) Market Size & Forecast, By End-use, 2021 – 2032
9.6.6.2.4 Polylactic Acid (PLA) Market Size & Forecast, By Application, 2021 – 2032
9.6.6.3 Qatar
9.6.6.3.1 Polylactic Acid (PLA) Market Size & Forecast, By Raw Material, 2021 – 2032
9.6.6.3.2 Polylactic Acid (PLA) Market Size & Forecast, By Grade, 2021 – 2032
9.6.6.3.3 Polylactic Acid (PLA) Market Size & Forecast, By End-use, 2021 – 2032
9.6.6.3.4 Polylactic Acid (PLA) Market Size & Forecast, By Application, 2021 – 2032
9.6.6.4 Egypt
9.6.6.4.1 Polylactic Acid (PLA) Market Size & Forecast, By Raw Material, 2021 – 2032
9.6.6.4.2 Polylactic Acid (PLA) Market Size & Forecast, By Grade, 2021 – 2032
9.6.6.4.3 Polylactic Acid (PLA) Market Size & Forecast, By End-use, 2021 – 2032
9.6.6.4.4 Polylactic Acid (PLA) Market Size & Forecast, By Application, 2021 – 2032
9.6.6.5 South Africa
9.6.6.5.1 Polylactic Acid (PLA) Market Size & Forecast, By Raw Material, 2021 – 2032
9.6.6.5.2 Polylactic Acid (PLA) Market Size & Forecast, By Grade, 2021 – 2032
9.6.6.5.3 Polylactic Acid (PLA) Market Size & Forecast, By End-use, 2021 – 2032
9.6.6.5.4 Polylactic Acid (PLA) Market Size & Forecast, By Application, 2021 – 2032
9.6.6.6 Rest of Middle East & Africa
9.6.6.6.1 Polylactic Acid (PLA) Market Size & Forecast, By Raw Material, 2021 – 2032
9.6.6.6.2 Polylactic Acid (PLA) Market Size & Forecast, By Grade, 2021 – 2032
9.6.6.6.3 Polylactic Acid (PLA) Market Size & Forecast, By End-use, 2021 – 2032
9.6.6.6.4 Polylactic Acid (PLA) Market Size & Forecast, By Application, 2021 – 2032
10. Competitive Landscape
10.1 Key Players' Positioning
10.2 Competitive Developments
10.2.1 Key Strategies Adopted (%), By Key Players, 2024
10.2.2 Year-Wise Strategies & Development, 2021 – 2025
10.2.3 Number Of Strategies Adopted By Key Players, 2024
10.3 Market Share Analysis, 2024
10.4 Product/Service & Application Benchmarking
10.4.1 Product/Service Specifications & Features By Key Players
10.4.2 Product/Service Heatmap By Key Players
10.4.3 Application Heatmap By Key Players
10.5 Industry Start-Up & Innovation Landscape
10.6 Key Company Profiles
10.6.1 NatureWorks LLC
10.6.1.1 Company Overview & Snapshot
10.6.1.2 Product/Service Portfolio
10.6.1.3 Key Company Financials
10.6.1.4 SWOT Analysis
10.6.2 Total Corbion PLA
10.6.3 BASF SE
10.6.4 Galactic
10.6.5 Futerro
10.6.6 Synbra Technology
10.6.7 Zhejiang Hisun Biomaterials Co., Ltd.
10.6.8 Shimadzu Corporation
10.6.9 Evonik Industries AG
10.6.10 Shenzhen Esun Industrial Co., Ltd.
10.6.11 Corbion N.V.
10.6.12 Danimer Scientific
10.6.13 Biome Bioplastics
10.6.14 Meredian Holdings Group
10.6.15 Shenzhen Polymtek Biomaterials Co., Ltd.
10.6.16 Guangdong Green Innovation Materials Co., Ltd.
10.6.17 Suzhou Huaan Biotechnology Co., Ltd.
10.6.18 Foresight Group
10.6.19 Toray Industries, Inc.
10.6.20 Henan Jindan Lactic Acid Technology Co., Ltd.
11. Analyst Recommendations
11.1 SNS Insider Opportunity Map
11.2 Industry Low-Hanging Fruit Assessment
11.3 Market Entry & Growth Strategy
11.4 Analyst Viewpoint & Suggestions on Market Growth
12. Assumptions
13. Disclaimer
14. Appendix
14.1 List Of Tables
14.2 List Of Figure
Key Segments:
By Raw Material
-
Corn starch
-
Sugarcane
-
Cassava
-
Others
By Grade
-
Thermoforming
-
Injection Molding
-
Extrusion
-
Blow Molding
-
Others
By Application
-
Rigid thermoform
-
Film & Sheets
-
Bottles
-
Others
By End-use
-
Packaging
-
Agriculture
-
Automotive & Transportation
-
Electronics
-
Textile
-
Consumer goods
-
Bio-medical
-
Others
Request for Segment Customization as per your Business Requirement: Segment Customization Request
REGIONAL COVERAGE:
North America
-
US
-
Canada
-
Mexico
Europe
-
Eastern Europe
-
Poland
-
Romania
-
Hungary
-
Turkey
-
Rest of Eastern Europe
-
-
Western Europe
-
Germany
-
France
-
UK
-
Italy
-
Spain
-
Netherlands
-
Switzerland
-
Austria
-
Rest of Western Europe
-
Asia Pacific
-
China
-
India
-
Japan
-
South Korea
-
Vietnam
-
Singapore
-
Australia
-
Rest of Asia Pacific
Middle East & Africa
-
Middle East
-
UAE
-
Egypt
-
Saudi Arabia
-
Qatar
-
Rest of the Middle East
-
-
Africa
-
Nigeria
-
South Africa
-
Rest of Africa
-
Latin America
-
Brazil
-
Argentina
-
Colombia
-
Rest of Latin America
Request for Country Level Research Report: Country Level Customization Request
Available Customization
With the given market data, SNS Insider offers customization as per the company’s specific needs. The following customization options are available for the report:
-
Product Analysis
-
Criss-Cross segment analysis (e.g. Product X Application)
-
Product Matrix which gives a detailed comparison of product portfolio of each company
-
Geographic Analysis
-
Additional countries in any of the regions
-
Company Information
-
Detailed analysis and profiling of additional market players (Up to five)
An accurate research report requires proper strategizing as well as implementation. There are multiple factors involved in the completion of good and accurate research report and selecting the best methodology to compete the research is the toughest part. Since the research reports we provide play a crucial role in any company’s decision-making process, therefore we at SNS Insider always believe that we should choose the best method which gives us results closer to reality. This allows us to reach at a stage wherein we can provide our clients best and accurate investment to output ratio.
Each report that we prepare takes a timeframe of 350-400 business hours for production. Starting from the selection of titles through a couple of in-depth brain storming session to the final QC process before uploading our titles on our website we dedicate around 350 working hours. The titles are selected based on their current market cap and the foreseen CAGR and growth.
The 5 steps process:
Step 1: Secondary Research:
Secondary Research or Desk Research is as the name suggests is a research process wherein, we collect data through the readily available information. In this process we use various paid and unpaid databases which our team has access to and gather data through the same. This includes examining of listed companies’ annual reports, Journals, SEC filling etc. Apart from this our team has access to various associations across the globe across different industries. Lastly, we have exchange relationships with various university as well as individual libraries.

Step 2: Primary Research
When we talk about primary research, it is a type of study in which the researchers collect relevant data samples directly, rather than relying on previously collected data. This type of research is focused on gaining content specific facts that can be sued to solve specific problems. Since the collected data is fresh and first hand therefore it makes the study more accurate and genuine.
We at SNS Insider have divided Primary Research into 2 parts.
Part 1 wherein we interview the KOLs of major players as well as the upcoming ones across various geographic regions. This allows us to have their view over the market scenario and acts as an important tool to come closer to the accurate market numbers. As many as 45 paid and unpaid primary interviews are taken from both the demand and supply side of the industry to make sure we land at an accurate judgement and analysis of the market.
This step involves the triangulation of data wherein our team analyses the interview transcripts, online survey responses and observation of on filed participants. The below mentioned chart should give a better understanding of the part 1 of the primary interview.

Part 2: In this part of primary research the data collected via secondary research and the part 1 of the primary research is validated with the interviews from individual consultants and subject matter experts.
Consultants are those set of people who have at least 12 years of experience and expertise within the industry whereas Subject Matter Experts are those with at least 15 years of experience behind their back within the same space. The data with the help of two main processes i.e., FGDs (Focused Group Discussions) and IDs (Individual Discussions). This gives us a 3rd party nonbiased primary view of the market scenario making it a more dependable one while collation of the data pointers.
Step 3: Data Bank Validation
Once all the information is collected via primary and secondary sources, we run that information for data validation. At our intelligence centre our research heads track a lot of information related to the market which includes the quarterly reports, the daily stock prices, and other relevant information. Our data bank server gets updated every fortnight and that is how the information which we collected using our primary and secondary information is revalidated in real time.

Step 4: QA/QC Process
After all the data collection and validation our team does a final level of quality check and quality assurance to get rid of any unwanted or undesired mistakes. This might include but not limited to getting rid of the any typos, duplication of numbers or missing of any important information. The people involved in this process include technical content writers, research heads and graphics people. Once this process is completed the title gets uploader on our platform for our clients to read it.
Step 5: Final QC/QA Process:
This is the last process and comes when the client has ordered the study. In this process a final QA/QC is done before the study is emailed to the client. Since we believe in giving our clients a good experience of our research studies, therefore, to make sure that we do not lack at our end in any way humanly possible we do a final round of quality check and then dispatch the study to the client.