Quantum Sensors Market Size & Trends:
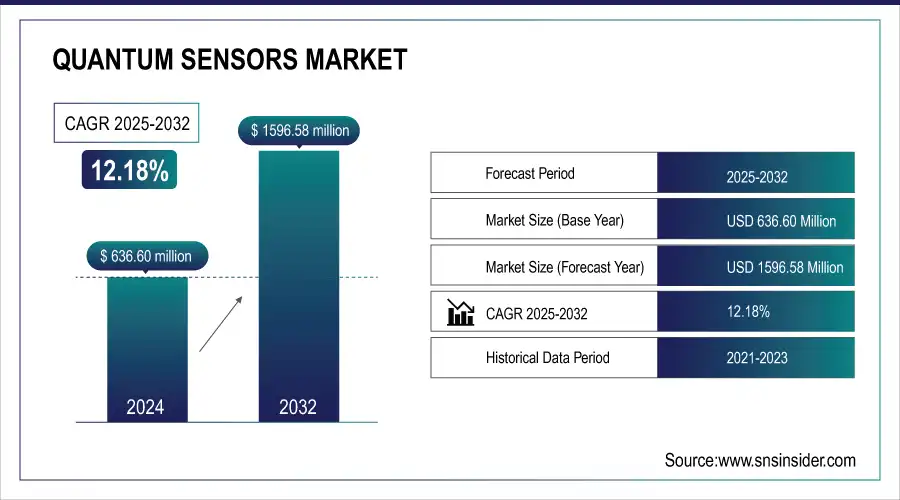
The Quantum Sensors Market Size was valued at USD 636.60 million in 2024 and is expected to reach USD 1596.58 million by 2032, growing at a CAGR of 12.18% over the forecast period 2025-2032. Quantum sensors market is registering fast-paced growth owing to the rapid adoption of premium technology across end-user verticals. As a function of quantum sensor applications in healthcare, defense, and environmental monitoring, adoption and integration metrics indicate a growing count of users. Improvement and innovation in quantum sensor technologies target increased precision, heightened sensitivity, and miniaturization to facilitate new applications. Manufacturing and production metrics focus on the problem of production scaling with a focus on producing more, cheaper, and more reliable. The fusion of AI and quantum computing in sensor applications is also rapidly adapting, which will create systems that are both more intelligent and energy-efficient while having the ability for enhanced data processing and analytics.

Get More Information on Quantum Sensors Market - Request Sample Report
Key Quantum Sensors Market Highlights:
-
Rising demand across key industries including automotive autonomous driving aerospace and defense GPS denied navigation submarine detection and healthcare advanced MRI early diagnostics is fueling market growth
-
Government and private R&D investments with significant funding programs and collaborations are accelerating the commercialization of quantum sensing technologies worldwide
-
Cost and complexity barriers such as high manufacturing costs need for controlled environments and lack of standard protocols are restraining large scale adoption
-
Conventional technology competition as traditional sensing technologies remain entrenched requiring high transition costs and integration efforts to shift toward quantum based solutions
-
Emerging opportunities in environmental monitoring with increasing use in climate change studies precision agriculture and environmental tracking
-
Miniaturization and consumer electronics potential with advances in compact portable quantum sensors enabling integration into wearables smartphones and IoT devices
Quantum Sensors Market Drivers:
-
Driving Forces Behind Quantum Sensors Market Growth in Automotive Aerospace Healthcare Sectors
High demand for high-precision sensing technologies in automotive, aerospace & defense, and healthcare industries is one of the major factors driving the market growth. Quantum sensors have a significant role in the automotive sector, especially when it comes to autonomous driving systems, which require highly accurate positioning and navigation information. Apart from these, in aerospace & defense, these sensors are extensively used in gravitational anomaly detection & submarine detection, and GPS-denied navigation. Increased investment levels by governments and private players in quantum R&D also contribute to the improvement of the increasing commercialization of quantum sensing technology. Another major driver of quantum sensing equipment demand is the growing requirement in the healthcare industry for ultra-sensitive medical imaging and diagnostics since quantum sensors can provide higher-resolution pictures supported by improved MRI technology and early disease detection.
Quantum Sensors Market Restraints:
-
Challenges Hindering Widespread Adoption of Quantum Sensors Despite Market Growth Potential
While the market for quantum sensors is thriving, several drivers may pose a restraint preventing them from achieving widespread adoption. The first and foremost challenge is the high cost and complexity associated with quantum sensor development and manufacturing. A lot of these sensors need very controlled environments, expensive materials, and very precise calibration, which makes them expensive and makes them difficult to commercialize at scale. Also, the teething phase of quantum technologies, with no standard protocols and demonstrations, is a major obstacle to uptake. While conventional sensing technologies remain a staple in many industries, requiring significant investments in research, training, and integration to transition to quantum-based alternatives slows market growth.
Quantum Sensors Market Opportunities:
-
Growth Opportunities in Quantum Sensors for Environmental Monitoring and Consumer Electronics Expansion
Growth opportunities also lie in the growing use of quantum technology for environmental monitoring like climate change studies and precision agriculture. Quantum sensors and technology offer success that corresponds with favorable developments in miniaturization, integration, and the production of small-sized, portable devices that can be easily transferred into consumer electronics and other mobile technology markets, including wearables. In addition, collaborative efforts among research institutions, technology companies, and start-ups pave the way for next-generation quantum sensors, offering enhanced precision and cost-effectiveness. As quantum computing and quantum communication are maturing along parallel paths, their convergence can unlock new use cases in the fields of quantum secure communication and quantum communication systems, which will increase the market size.
Quantum Sensors Market Segment Analysis:
By Product
The quantum sensors market was dominated by Atomic Clocks in 2024 accounting for 39.3% of the market due to their extensive use in precise timekeeping, navigation, and defense applications. Their predominant use within GPS devices, telecommunications, and scientific research has established them as the market leader.
Photosynthetically Active Radiation (PAR) Sensors are expected to grow fastest between 2025 and 2032 and are driven by growing demand for these sensors in agriculture, environmental monitoring, and climate research. Increasing emphasis on sustainable agriculture and improving ambient conditions for plant growth using quantum-enabled light detection technologies is anticipated to lead to considerable demand for PAR sensors shortly.
By Application
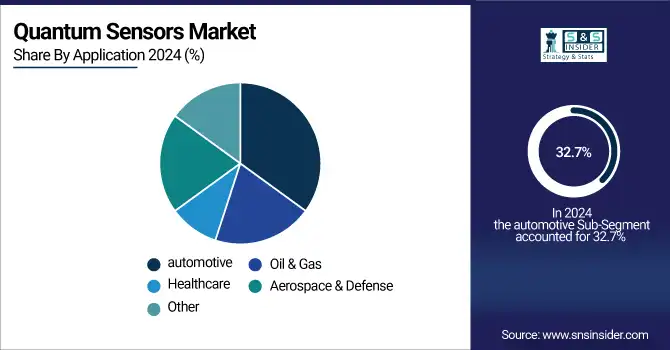
The automotive application accounted for the largest market share of 32.7% in the quantum sensors market in 2024 due to the increasing integration of quantum sensors in advanced driver-assistance systems (ADAS), autonomous vehicles, and navigation. As the future of mobility relies more heavily on these adoption technologies, Quantum sensors will facilitate vehicle safety, positioning, and performance, making them a vital aspect of next-generation mobility solutions.
The healthcare segment is expected to register the fastest CAGR between 2025 and 2032 owing to rising demand for ultra-sensitive medical imaging, and interdisciplinary medical research for early detection of diseases and diagnostics. High sensitivity detection capabilities due to the quantum sensors lead to advanced technologies such as MRI, brain imaging, and bio-sensing applications.
Europe Quantum Sensors Market Trends
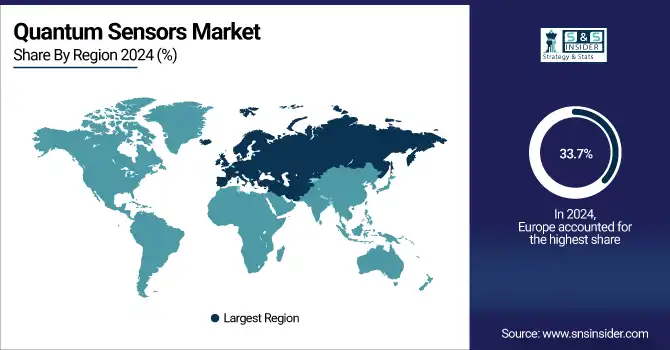
Europe led quantum sensors with a 33.7% share of the market in 2023 thanks to government funding, competitive research institutions, and partnerships between industry players. As a pioneer hub for the development of quantum technology, this includes the EURO 1 billion EU Quantum Flagship Program, dedicated to fostering quantum research in the region. European companies Muquans (France) and Qnami (Switzerland) are influence makers in quantum sensing solutions development for aerospace, defense, and medical imaging. Moreover, the UK National Quantum Technologies Programmed has also contributed advances in atomic clocks, and quantum magnetometers, further adding to the strength of Europe's business advantage in this space.
Asia-Pacific Quantum Sensors Market Trends
The Asia-Pacific market is expected to grow at the fastest CAGR from 2025-2032, due to Rising Quantum Technology Investments by China, Japan & South Korea Notably, China has made rapid advances like launching the Hefei National Laboratory for Physical Sciences concentrating on quantum precision measurement. Companies such as CASIQLY (China) are developing high-performance quantum sensors for a range of navigational and defense purposes. Meanwhile, Japan's home region of Ibaraki is emerging as the next potential powerhouse of quantum-enhanced healthcare solutions, with the RIKEN Center for Quantum Computing also on the hunt for top-tier quantum sensor commercialization within its borders.
North America Quantum Sensors Market Trends
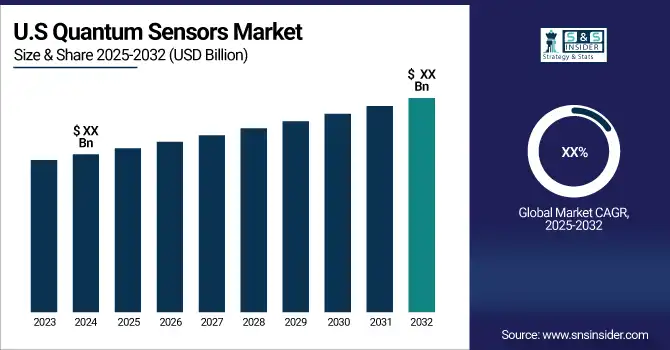
North America held a significant share of the quantum sensors market in 2023, driven by strong defense investments, advancements in quantum computing infrastructure, and substantial funding initiatives from the U.S. and Canada. The U.S. National Quantum Initiative Act and Department of Defense (DoD) programs have accelerated the development of quantum magnetometers, gyroscopes, and gravimeters for aerospace, navigation, and security applications. Companies like ColdQuanta (U.S.) and AOSense (U.S.) are spearheading innovations in atomic-based quantum sensing solutions, while collaborations with leading universities and research institutes are strengthening the ecosystem.
Latin America Quantum Sensors Market Trends
The Latin American quantum sensors market is in its early stages but is gaining momentum with growing academic collaborations and niche research projects, particularly in Brazil, Chile, and Argentina. Brazil’s National Institute for Quantum Science & Technology (INCT) is supporting projects in quantum metrology and environmental sensing. Emerging startups and partnerships with European and North American research hubs are laying the groundwork for regional growth, focusing on precision agriculture, energy infrastructure monitoring, and climate research applications.
Middle East & Africa Quantum Sensors Market Trends
The Middle East & Africa (MEA) region is witnessing gradual adoption of quantum sensors, fueled by initiatives in the UAE, Saudi Arabia, and South Africa. Government-led programs, such as the UAE’s National Quantum Strategy, aim to develop local expertise in quantum-enhanced navigation and oilfield exploration technologies. Collaborations with European quantum research institutions are fostering knowledge transfer and pilot deployments in energy, defense, and smart city infrastructure.

Get Customized Report as per your Business Requirement - Request For Customized Report
Key Quantum Sensors Companies are:
-
Andor Technology (Marana 4.2B-11, Balor sCMOS camera)
-
D-Wave Systems (D-Wave 2000Q, D-Wave Advantage)
-
Quantinuum (System Model H1-1, System Model H2)
-
Kistler Group (PiezoStar KI100 sensors, Type 6215 Quartz High-Pressure Sensor)
-
QuantX Labs (Cryoclock, advanced magnetic field sensors)
-
Xanadu Quantum Technologies (Programmable Gaussian Boson Sampler, Photonic Quantum Computer)
-
Uster Technologies (Quantum Expert System, Quantum 3 Yarn Clearer)
-
ID Quantique (ID281 Superconducting Nanowire System, Clavis3 Quantum Key Distribution)
-
Qnami (ProteusQ, Quantilever MX)
-
Muquans (Absolute Quantum Gravimeter, MuClock)
-
ColdQuanta (Quantum Core, Albert)
-
AOSense (Quantum Gravimeter, Atomic Gyroscope)
-
Bosch (MEMS Quantum Sensors, BMA400 Accelerometer)
-
Honeywell Quantum Solutions (H1 Quantum Computer, Trapped-Ion Quantum Sensors)
-
Microsoft Quantum (Quantum Development Kit, Topological Qubits)
-
Campbell Scientific, Inc. (PAR Quantum Sensors, LI-190R Quantum Sensor)
-
LI-COR, Inc. (LI-250A Light Meter, LI-190R Quantum Sensor)
-
M Squared Ltd. (Quantum Accelerometer, Quantum Gravimeter, Quantum Clocks
-
Mulberry Sensors (Chip-Scale Mid-Infrared Molecular Sensors)
-
KWAN-TEK (Diamond NV-Center Quantum Sensors)
Quantum Sensors Market Competitive Landscape:
Andor Technology, established in 1989 in Belfast, Northern Ireland, is a leading provider of high-performance scientific imaging solutions. The company specializes in advanced cameras and detectors, including sCMOS and EMCCD technologies, widely used in quantum sensing, life sciences, and materials research, enabling high-precision measurement and imaging applications globally.
-
In November 2024, Andor Technology launched the ZL41 Cell and ZL41 Wave sCMOS cameras, enhancing sensor technology for life and physical sciences.
D-Wave Systems, founded in 1999 and headquartered in Burnaby, Canada, is a pioneer in quantum computing technology. The company develops quantum annealing systems and software platforms used across various industries, including quantum sensing research, optimization, and AI applications, supporting advancements in aerospace, defense, and high-performance computing solutions.
Carahsoft Technology Corp., established in 2004 in Reston, Virginia, USA, is a leading government IT solutions provider. While not a direct quantum hardware manufacturer, Carahsoft partners with quantum technology firms to deliver quantum sensing, computing, and cybersecurity solutions to federal, state, and education sectors, accelerating market adoption and deployment.
-
In January 2025, D-Wave and Carahsoft partnered to expand quantum computing solutions in the U.S. public sector, providing access via government contract vehicles.
Report Attributes | Details |
---|---|
Market Size in 2024 | USD 636.60 Million |
Market Size by 2032 | USD 1596.58 Million |
CAGR | CAGR of 12.18 % From 2025 to 2032 |
Base Year | 2024 |
Forecast Period | 2025-2032 |
Historical Data | 2021-2023 |
Report Scope & Coverage | Market Size, Segments Analysis, Competitive Landscape, Regional Analysis, DROC & SWOT Analysis, Forecast Outlook |
Key Segments | • By Product (Atomic Clocks, Gravitational Sensors, Photosynthetically Active Radiation (PAR), Quantum Magnetic Sensors, Others) • By Application (Aerospace & Defense, Automotive, Oil & Gas, Healthcare, Other) |
Regional Analysis/Coverage | North America (US, Canada), Europe (Germany, UK, France, Italy, Spain, Russia, Poland, Rest of Europe), Asia Pacific (China, India, Japan, South Korea, Australia, ASEAN Countries, Rest of Asia Pacific), Middle East & Africa (UAE, Saudi Arabia, Qatar, South Africa, Rest of Middle East & Africa), Latin America (Brazil, Argentina, Mexico, Colombia, Rest of Latin America). |
Company Profiles |
Andor Technology, D-Wave Systems, Quantinuum, Kistler Group, QuantX Labs, Xanadu Quantum Technologies, Uster Technologies, ID Quantique, Qnami, Muquans, ColdQuanta, AOSense, Bosch, Honeywell Quantum Solutions, Microsoft Quantum, Campbell Scientific, Inc., LI-COR, Inc., M Squared Ltd., Mulberry Sensors, KWAN-TEK. |
Table of Content
1. Introduction
1.1 Market Definition & Scope
1.2 Research Assumptions & Abbreviations
1.3 Research Methodology
2. Executive Summary
2.1 Market Snapshot
2.2 Market Absolute $ Opportunity Assessment & Y-o-Y Analysis, 2021–2032
2.3 Market Size & Forecast, By Segmentation, 2021–2032
2.3.1 Market Size By Product
2.3.2 Market Size By Application
2.4 Market Share & Bps Analysis By Region, 2024
2.5 Industry Growth Scenarios – Conservative, Likely & Optimistic
2.6 Industry CxO’s Perspective
3. Market Overview
3.1 Market Dynamics
3.1.1 Drivers
3.1.2 Restraints
3.1.3 Opportunities
3.1.4 Key Market Trends
3.2 Industry PESTLE Analysis
3.3 Key Industry Forces (Porter’s) Impacting Market Growth
3.4 Industry Supply Chain Analysis
3.4.1 Raw Material Suppliers
3.4.2 Manufacturers
3.4.3 Distributors/Suppliers
3.4.4 Customers/End-Users
3.5 Industry Life Cycle Assessment
3.6 Parent Market Overview
3.7 Market Risk Assessment
4. Statistical Insights & Trends Reporting
4.1 Performance & Technical Metrics
4.1.1 Average processing speed (GHz) and GPU performance (TFLOPS) by device type (PC, console, GPU, CPU, peripherals)
4.1.2 Latency and response time (ms) for gaming peripherals and systems
4.1.3 Energy consumption (Watts) and thermal efficiency (%) across devices
4.1.4 Lifespan (hours or years) of Quantum Sensors components
4.2 Adoption & Deployment Trends
4.2.1 Market share by device type: gaming consoles, gaming PCs, GPUs, gaming laptops, accessories (%)
4.2.2 Share of casual vs. professional vs. esports user adoption (%)
4.2.3 Year-on-year growth in Quantum Sensors sales globally and regionally
4.2.4 Share of new purchases vs. hardware upgrades (%)
4.3 Technology & Innovation Metrics
4.3.1 Adoption rate of advanced technologies: ray tracing, VR/AR, AI-enhanced GPUs (%)
4.3.2 Share of SSD vs. HDD usage in gaming devices (%)
4.3.3 Trends in peripheral innovation: high-DPI mice, mechanical keyboards, adaptive controllers (%)
4.3.4 Average frame rate (FPS) improvement across hardware generations
4.4 Manufacturing & Supply Chain Statistics
4.4.1 Global production share by leading manufacturers (%)
4.4.2 Average lead time for Quantum Sensors delivery (weeks)
4.4.3 Component-level cost distribution (GPU, CPU, memory, cooling systems, casing) (%)
4.4.4 Average selling price trends (USD/unit) by device type
5. Quantum Sensors Market Segmental Analysis & Forecast, By Product, 2021 – 2032, Value (USD Billion)
5.1 Introduction
5.2 Atomic Clocks
5.2.1 Key Trends
5.2.2 Market Size & Forecast, 2021 – 2032
5.3 Gravitational Sensors
5.3.1 Key Trends
5.3.2 Market Size & Forecast, 2021 – 2032
5.4 Photosynthetically Active Radiation (PAR)
5.4.1 Key Trends
5.4.2 Market Size & Forecast, 2021 – 2032
5.5 Quantum Magnetic Sensors
5.5.1 Key Trends
5.5.2 Market Size & Forecast, 2021 – 2032
5.6 Others
5.6.1 Key Trends
5.6.2 Market Size & Forecast, 2021 – 2032
6. Quantum Sensors Market Segmental Analysis & Forecast, By Application, 2021 – 2032, Value (USD Billion)
6.1 Introduction
6.2 Aerospace & Defense
6.2.1 Key Trends
6.2.2 Market Size & Forecast, 2021 – 2032
6.3 Automotive
6.3.1 Key Trends
6.3.2 Market Size & Forecast, 2021 – 2032
6.4 Oil & Gas
6.4.1 Key Trends
6.4.2 Market Size & Forecast, 2021 – 2032
6.5 Oil & Gas
6.5.1 Key Trends
6.5.2 Market Size & Forecast, 2021 – 2032
6.6 Other
6.6.1 Key Trends
6.6.2 Market Size & Forecast, 2021 – 2032
7. Quantum Sensors Market Segmental Analysis & Forecast By Region, 2021 – 2025, Value (USD Billion)
7.1 Introduction
7.2 North America
7.2.1 Key Trends
7.2.2 Quantum Sensors Market Size & Forecast, By Product, 2021 – 2032
7.2.3 Quantum Sensors Market Size & Forecast, By Application, 2021 – 2032
7.2.4 Quantum Sensors Market Size & Forecast, By Country, 2021 – 2032
7.2.4.1 USA
7.2.4.1.1 Quantum Sensors Market Size & Forecast, By Product, 2021 – 2032
7.2.4.1.2 Quantum Sensors Market Size & Forecast, By Application, 2021 – 2032
7.2.4.2 Canada
7.2.4.2.1 Quantum Sensors Market Size & Forecast, By Product, 2021 – 2032
7.2.4.2.2 Quantum Sensors Market Size & Forecast, By Application, 2021 – 2032
7.3 Europe
7.3.1 Key Trends
7.3.2 Quantum Sensors Market Size & Forecast, By Product, 2021 – 2032
7.3.3 Quantum Sensors Market Size & Forecast, By Application, 2021 – 2032
7.3.4 Quantum Sensors Market Size & Forecast, By Country, 2021 – 2032
7.3.4.1 Germany
7.3.4.1.1 Quantum Sensors Market Size & Forecast, By Product, 2021 – 2032
7.3.4.1.2 Quantum Sensors Market Size & Forecast, By Application, 2021 – 2032
7.3.4.2 UK
7.3.4.2.1 Quantum Sensors Market Size & Forecast, By Product, 2021 – 2032
7.3.4.2.2 Quantum Sensors Market Size & Forecast, By Application, 2021 – 2032
7.3.4.3 France
7.3.4.3.1 Quantum Sensors Market Size & Forecast, By Product, 2021 – 2032
7.3.4.3.2 Quantum Sensors Market Size & Forecast, By Application, 2021 – 2032
7.3.4.4 Italy
7.3.4.4.1 Quantum Sensors Market Size & Forecast, By Product, 2021 – 2032
7.3.4.4.2 Quantum Sensors Market Size & Forecast, By Application, 2021 – 2032
7.3.4.5 Spain
7.3.4.5.1 Quantum Sensors Market Size & Forecast, By Product, 2021 – 2032
7.3.4.5.2 Quantum Sensors Market Size & Forecast, By Application, 2021 – 2032
7.3.4.6 Russia
7.3.4.6.1 Quantum Sensors Market Size & Forecast, By Product, 2021 – 2032
7.3.4.6.2 Quantum Sensors Market Size & Forecast, By Application, 2021 – 2032
7.3.4.7 Poland
7.3.4.7.1 Quantum Sensors Market Size & Forecast, By Product, 2021 – 2032
7.3.4.7.2 Quantum Sensors Market Size & Forecast, By Application, 2021 – 2032
7.3.4.8 Rest of Europe
7.3.4.8.1 Quantum Sensors Market Size & Forecast, By Product, 2021 – 2032
7.3.4.8.2 Quantum Sensors Market Size & Forecast, By Application, 2021 – 2032
7.4 Asia-Pacific
7.4.1 Key Trends
7.4.2 Quantum Sensors Market Size & Forecast, By Product, 2021 – 2032
7.4.3 Quantum Sensors Market Size & Forecast, By Application, 2021 – 2032
7.4.4 Quantum Sensors Market Size & Forecast, By Country, 2021 – 2032
7.4.4.1 China
7.4.4.1.1 Quantum Sensors Market Size & Forecast, By Product, 2021 – 2032
7.4.4.1.2 Quantum Sensors Market Size & Forecast, By Application, 2021 – 2032
7.4.4.2 India
7.4.4.2.1 Quantum Sensors Market Size & Forecast, By Product, 2021 – 2032
7.4.4.2.2 Quantum Sensors Market Size & Forecast, By Application, 2021 – 2032
7.4.4.3 Japan
7.4.4.3.1 Quantum Sensors Market Size & Forecast, By Product, 2021 – 2032
7.4.4.3.2 Quantum Sensors Market Size & Forecast, By Application, 2021 – 2032
7.4.4.4 South Korea
7.4.4.4.1 Quantum Sensors Market Size & Forecast, By Product, 2021 – 2032
7.4.4.4.2 Quantum Sensors Market Size & Forecast, By Application, 2021 – 2032
7.4.4.5 Australia
7.4.4.5.1 Quantum Sensors Market Size & Forecast, By Product, 2021 – 2032
7.4.4.5.2 Quantum Sensors Market Size & Forecast, By Application, 2021 – 2032
7.4.4.6 ASEAN Countries
7.4.4.6.1 Quantum Sensors Market Size & Forecast, By Product, 2021 – 2032
7.4.4.6.2 Quantum Sensors Market Size & Forecast, By Application, 2021 – 2032
7.4.4.7 Rest of Asia-Pacific
7.4.4.7.1 Quantum Sensors Market Size & Forecast, By Product, 2021 – 2032
7.4.4.7.2 Quantum Sensors Market Size & Forecast, By Application, 2021 – 2032
7.5 Latin America
7.5.1 Key Trends
7.5.2 Quantum Sensors Market Size & Forecast, By Product, 2021 – 2032
7.5.3 Quantum Sensors Market Size & Forecast, By Application, 2021 – 2032
7.5.4 Quantum Sensors Market Size & Forecast, By Country, 2021 – 2032
7.5.4.1 Brazil
7.5.4.1.1 Quantum Sensors Market Size & Forecast, By Product, 2021 – 2032
7.5.4.1.2 Quantum Sensors Market Size & Forecast, By Application, 2021 – 2032
7.5.4.2 Argentina
7.5.4.2.1 Quantum Sensors Market Size & Forecast, By Product, 2021 – 2032
7.5.4.2.2 Quantum Sensors Market Size & Forecast, By Application, 2021 – 2032
7.5.4.3 Mexico
7.5.4.3.1 Quantum Sensors Market Size & Forecast, By Product, 2021 – 2032
7.5.4.3.2 Quantum Sensors Market Size & Forecast, By Application, 2021 – 2032
7.5.4.4 Colombia
7.5.4.4.1 Quantum Sensors Market Size & Forecast, By Product, 2021 – 2032
7.5.4.4.2 Quantum Sensors Market Size & Forecast, By Application, 2021 – 2032
7.5.4.5 Rest of Latin America
7.5.4.5.1 Quantum Sensors Market Size & Forecast, By Product, 2021 – 2032
7.5.4.5.2 Quantum Sensors Market Size & Forecast, By Application, 2021 – 2032
7.6 Middle East & Africa
7.6.1 Key Trends
7.6.2 Quantum Sensors Market Size & Forecast, By Product, 2021 – 2032
7.6.3 Quantum Sensors Market Size & Forecast, By Application, 2021 – 2032
7.6.4 Quantum Sensors Market Size & Forecast, By Country, 2021 – 2032
7.6.4.1 UAE
7.6.4.1.1 Quantum Sensors Market Size & Forecast, By Product, 2021 – 2032
7.6.4.1.2 Quantum Sensors Market Size & Forecast, By Application, 2021 – 2032
7.6.4.2 Saudi Arabia
7.6.4.2.1 Quantum Sensors Market Size & Forecast, By Product, 2021 – 2032
7.6.4.2.2 Quantum Sensors Market Size & Forecast, By Application, 2021 – 2032
7.6.4.3 Qatar
7.6.4.3.1 Quantum Sensors Market Size & Forecast, By Product, 2021 – 2032
7.6.4.3.2 Quantum Sensors Market Size & Forecast, By Application, 2021 – 2032
7.6.4.4 Egypt
7.6.4.4.1 Quantum Sensors Market Size & Forecast, By Product, 2021 – 2032
7.6.4.4.2 Quantum Sensors Market Size & Forecast, By Application, 2021 – 2032
7.6.4.5 South Africa
7.6.4.5.1 Quantum Sensors Market Size & Forecast, By Product, 2021 – 2032
7.6.4.5.2 Quantum Sensors Market Size & Forecast, By Application, 2021 – 2032
7.6.4.6 Rest of Middle East & Africa
7.6.4.6.1 Quantum Sensors Market Size & Forecast, By Product, 2021 – 2032
7.6.4.6.2 Quantum Sensors Market Size & Forecast, By Application, 2021 – 2032
8. Competitive Landscape
8.1 Key Players' Positioning
8.2 Competitive Developments
8.2.1 Key Strategies Adopted (%), By Key Players, 2024
8.2.2 Year-Wise Strategies & Development, 2021 – 2025
8.2.3 Number Of Strategies Adopted By Key Players, 2024
8.3 Market Share Analysis, 2024
8.4 Component/Service & Application Benchmarking
8.4.1 Component/Service Specifications & Features By Key Players
8.4.2 Component/Service Heatmap By Key Players
8.4.3 Application Heatmap By Key Players
8.5 Industry Start-Up & Innovation Landscape
8.6 Key Company Profiles
8.6.1 Andor Technology
8.6.1.1 Company Overview & Snapshot
8.6.1.2 Component/Service Portfolio
8.6.1.3 Key Company Financials
8.6.1.4 SWOT Analysis
8.6.2 D-Wave Systems
8.6.2.1 Company Overview & Snapshot
8.6.2.2 Component/Service Portfolio
8.6.2.3 Key Company Financials
8.6.2.4 SWOT Analysis
8.6.3 Quantinuum
8.6.3.1 Company Overview & Snapshot
8.6.3.2 Component/Service Portfolio
8.6.3.3 Key Company Financials
8.6.3.4 SWOT Analysis
8.6.4 Kistler Group
8.6.4.1 Company Overview & Snapshot
8.6.4.2 Component/Service Portfolio
8.6.4.3 Key Company Financials
8.6.4.4 SWOT Analysis
8.6.5 QuantX Labs
8.6.5.1 Company Overview & Snapshot
8.6.5.2 Component/Service Portfolio
8.6.5.3 Key Company Financials
8.6.5.4 SWOT Analysis
8.6.6 Xanadu Quantum Technologies
8.6.6.1 Company Overview & Snapshot
8.6.6.2 Component/Service Portfolio
8.6.6.3 Key Company Financials
8.6.6.4 SWOT Analysis
8.6.7 Uster Technologies
8.6.7.1 Company Overview & Snapshot
8.6.7.2 Component/Service Portfolio
8.6.7.3 Key Company Financials
8.6.7.4 SWOT Analysis
8.6.8 ID Quantique
8.6.8.1 Company Overview & Snapshot
8.6.8.2 Component/Service Portfolio
8.6.8.3 Key Company Financials
8.6.8.4 SWOT Analysis
8.6.9 Qnami
8.6.9.1 Company Overview & Snapshot
8.6.9.2 Component/Service Portfolio
8.6.9.3 Key Company Financials
8.6.9.4 SWOT Analysis
8.6.10 Muquans
8.6.10.1 Company Overview & Snapshot
8.6.10.2 Component/Service Portfolio
8.6.10.3 Key Company Financials
8.6.10.4 SWOT Analysis
8.6.11 ColdQuanta
8.6.11.1 Company Overview & Snapshot
8.6.11.2 Component/Service Portfolio
8.6.11.3 Key Company Financials
8.6.11.4 SWOT Analysis
8.6.12 AOSense
8.6.12.1 Company Overview & Snapshot
8.6.12.2 Component/Service Portfolio
8.6.12.3 Key Company Financials
8.6.12.4 SWOT Analysis
8.6.13 Bosch
8.6.13.1 Company Overview & Snapshot
8.6.13.2 Component/Service Portfolio
8.6.13.3 Key Company Financials
8.6.13.4 SWOT Analysis
8.6.14 Honeywell Quantum Solutions
8.6.14.1 Company Overview & Snapshot
8.6.14.2 Component/Service Portfolio
8.6.14.3 Key Company Financials
8.6.14.4 SWOT Analysis
8.6.15 Microsoft Quantum
8.6.15.1 Company Overview & Snapshot
8.6.15.2 Component/Service Portfolio
8.6.15.3 Key Company Financials
8.6.15.4 SWOT Analysis
8.6.16 Campbell Scientific, Inc.
8.6.16.1 Company Overview & Snapshot
8.6.16.2 Component/Service Portfolio
8.6.16.3 Key Company Financials
8.6.16.4 SWOT Analysis
8.6.17 LI-COR, Inc.
8.6.17.1 Company Overview & Snapshot
8.6.17.2 Component/Service Portfolio
8.6.17.3 Key Company Financials
8.6.17.4 SWOT Analysis
8.6.18 M Squared Ltd.
8.6.18.1 Company Overview & Snapshot
8.6.18.2 Component/Service Portfolio
8.6.18.3 Key Company Financials
8.6.18.4 SWOT Analysis
8.6.19 Mulberry Sensors
8.6.19.1 Company Overview & Snapshot
8.6.19.2 Component/Service Portfolio
8.6.19.3 Key Company Financials
8.6.19.4 SWOT Analysis
8.6.20 KWAN-TEK
8.6.20.1 Company Overview & Snapshot
8.6.20.2 Component/Service Portfolio
8.6.20.3 Key Company Financials
8.6.20.4 SWOT Analysis
9. Analyst Recommendations
9.1 SNS Insider Opportunity Map
9.2 Industry Low-Hanging Fruit Assessment
9.3 Market Entry & Growth Strategy
9.4 Analyst Viewpoint & Suggestions On Market Growth
10. Assumptions
11. Disclaimer
12. Appendix
12.1 List Of Tables
12.2 List Of Figures
Key Segments:
By Product
-
Atomic Clocks
-
Gravitational Sensors
-
Photosynthetically Active Radiation (PAR)
-
Quantum Magnetic Sensors
-
Others
By Application
-
Aerospace & Defense
-
Automotive
-
Oil & Gas
-
Healthcare
-
Other
Request for Segment Customization as per your Business Requirement: Segment Customization Request
Regional Coverage:
North America
-
US
-
Canada
-
Mexico
Europe
-
Eastern Europe
-
Poland
-
Romania
-
Hungary
-
Turkey
-
Rest of Eastern Europe
-
-
Western Europe
-
Germany
-
France
-
UK
-
Italy
-
Spain
-
Netherlands
-
Switzerland
-
Austria
-
Rest of Western Europe
-
Asia Pacific
-
China
-
India
-
Japan
-
South Korea
-
Vietnam
-
Singapore
-
Australia
-
Rest of Asia Pacific
Middle East & Africa
-
Middle East
-
UAE
-
Egypt
-
Saudi Arabia
-
Qatar
-
Rest of Middle East
-
-
Africa
-
Nigeria
-
South Africa
-
Rest of Africa
-
Latin America
-
Brazil
-
Argentina
-
Colombia
-
Rest of Latin America
Request for Country Level Research Report: Country Level Customization Request
Available Customization
With the given market data, SNS Insider offers customization as per the company’s specific needs. The following customization options are available for the report:
-
Detailed Volume Analysis
-
Criss-Cross segment analysis (e.g. Product X Application)
-
Competitive Product Benchmarking
-
Geographic Analysis
-
Additional countries in any of the regions
-
Customized Data Representation
-
Detailed analysis and profiling of additional market players
An accurate research report requires proper strategizing as well as implementation. There are multiple factors involved in the completion of good and accurate research report and selecting the best methodology to compete the research is the toughest part. Since the research reports we provide play a crucial role in any company’s decision-making process, therefore we at SNS Insider always believe that we should choose the best method which gives us results closer to reality. This allows us to reach at a stage wherein we can provide our clients best and accurate investment to output ratio.
Each report that we prepare takes a timeframe of 350-400 business hours for production. Starting from the selection of titles through a couple of in-depth brain storming session to the final QC process before uploading our titles on our website we dedicate around 350 working hours. The titles are selected based on their current market cap and the foreseen CAGR and growth.
The 5 steps process:
Step 1: Secondary Research:
Secondary Research or Desk Research is as the name suggests is a research process wherein, we collect data through the readily available information. In this process we use various paid and unpaid databases which our team has access to and gather data through the same. This includes examining of listed companies’ annual reports, Journals, SEC filling etc. Apart from this our team has access to various associations across the globe across different industries. Lastly, we have exchange relationships with various university as well as individual libraries.

Step 2: Primary Research
When we talk about primary research, it is a type of study in which the researchers collect relevant data samples directly, rather than relying on previously collected data. This type of research is focused on gaining content specific facts that can be sued to solve specific problems. Since the collected data is fresh and first hand therefore it makes the study more accurate and genuine.
We at SNS Insider have divided Primary Research into 2 parts.
Part 1 wherein we interview the KOLs of major players as well as the upcoming ones across various geographic regions. This allows us to have their view over the market scenario and acts as an important tool to come closer to the accurate market numbers. As many as 45 paid and unpaid primary interviews are taken from both the demand and supply side of the industry to make sure we land at an accurate judgement and analysis of the market.
This step involves the triangulation of data wherein our team analyses the interview transcripts, online survey responses and observation of on filed participants. The below mentioned chart should give a better understanding of the part 1 of the primary interview.

Part 2: In this part of primary research the data collected via secondary research and the part 1 of the primary research is validated with the interviews from individual consultants and subject matter experts.
Consultants are those set of people who have at least 12 years of experience and expertise within the industry whereas Subject Matter Experts are those with at least 15 years of experience behind their back within the same space. The data with the help of two main processes i.e., FGDs (Focused Group Discussions) and IDs (Individual Discussions). This gives us a 3rd party nonbiased primary view of the market scenario making it a more dependable one while collation of the data pointers.
Step 3: Data Bank Validation
Once all the information is collected via primary and secondary sources, we run that information for data validation. At our intelligence centre our research heads track a lot of information related to the market which includes the quarterly reports, the daily stock prices, and other relevant information. Our data bank server gets updated every fortnight and that is how the information which we collected using our primary and secondary information is revalidated in real time.

Step 4: QA/QC Process
After all the data collection and validation our team does a final level of quality check and quality assurance to get rid of any unwanted or undesired mistakes. This might include but not limited to getting rid of the any typos, duplication of numbers or missing of any important information. The people involved in this process include technical content writers, research heads and graphics people. Once this process is completed the title gets uploader on our platform for our clients to read it.
Step 5: Final QC/QA Process:
This is the last process and comes when the client has ordered the study. In this process a final QA/QC is done before the study is emailed to the client. Since we believe in giving our clients a good experience of our research studies, therefore, to make sure that we do not lack at our end in any way humanly possible we do a final round of quality check and then dispatch the study to the client.