FOUP Stockers Market Size & Growth:
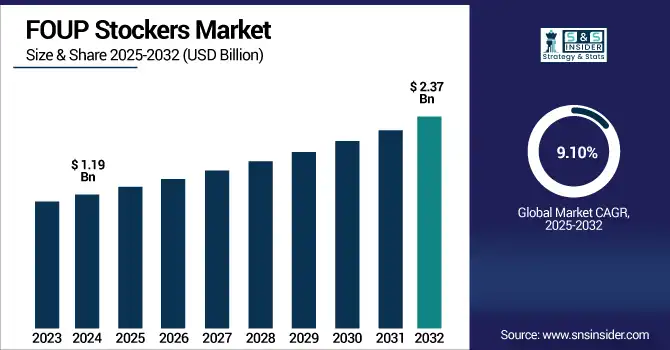
The FOUP Stockers Market Size was valued at USD 1.19 billion in 2024 and is expected to reach USD 2.37 billion by 2032 and grow at a CAGR of 9.10% over the forecast period 2025-2032.
To Get more information on FOUP Stockers Market - Request Free Sample Report
The Worldwide market for FOUP Stockers is very fast and is driven by rising demand for semiconductors, increasing cleanroom automation and growing requirements for wafer handling. Growing regional investments and transition to smart manufacturing lines continue to drive expansion. With the increasing competition, the ability to continually innovate and improve production efficiency has become the key to satisfying the demands of contamination-sensitive and high-volume fabrication processes.
The U.S. FOUP Stockers Market size was USD 0.23 billion in 2024 and is expected to reach USD 0.49 billion by 2032, growing at a CAGR of 9.79% over the forecast period of 2025–2032.
The US FOUP Stockers Market growth is attributed to the rise in the investment in domestic semiconductor manufacturing, government back-up chip production incentives and rise in demand for advanced automation in cleanroom premises. Moreover, the focus in the nation on reshoring of chip production to reduce supply chain dependence is influencing the uptake of high-efficiency FOUP stocker systems in leading fabrication plants.
According to research, Over 60–70% of new U.S. fab projects specify AI-enabled, real-time monitored FOUP stocker systems.
FOUP Stockers Market Dynamics
Key Drivers:
-
Rising semiconductor manufacturing complexity necessitates high-efficiency FOUP stockers for contamination control and automation efficiency
As the semiconductor industry ramping semiconductor wafers of smaller and more complex semiconductor dies, for such an advanced FOUP stocker, the demand has very high accordingly. These stockers keep the FOUPs clean and accurately handled in a controlled atmosphere environment and prevent wafer contamination while performing process flow efficiency. As chip designs get more complex, fab cleanliness and automation are essential, and these will be a significant driver of FOUP stocker demand. The throughput of these systems, combined with their de-laboring automation, enables high-volume manufacturing and are playing an integral role in next-gen semiconductor fabs around the world.
According to research, FOUP stockers can reduce manual handling by over 90%, cutting labor costs and improving yield & Automation improves wafer traceability and logistics efficiency by 30–50% compared to semi-manual operations.
Restrain:
-
Technical complexity and maintenance challenges affect operational uptime and increase reliance on specialized personnel
FOUP stockers are complicated systems containing accurate robotics, software interfacing and contamination controlling. These systems require well-trained personnel and periodic system calibration, which leads to high operational costs. Such breakdowns can occur without warning and can shut down an entire production line, rendering fabs susceptible to crippling downtime. In addition, reliance on proprietary vendors for troubleshooting and maintenance introduces logistical concerns, particularly in low-capacity technical contexts. This logistical operation complexity generates barriers to adoption and limits the growth across the wider FOUP stockers market.
Opportunities:
-
Technological advancements in AI integration and real-time monitoring enhance FOUP stocker value in smart fabs
New artificial intelligence (AI), machine learning (ML) and IoT innovations in FOUP stockers are redefining their purpose on today’s fabs. Such developments allow for predictive analytics, online faults detection and dynamic stocker management on fab load. This AI-based automation is in line with the development of intelligent fabs, where real-time data is critical to quality control and production efficiency. As fabs aim to minimize manual surveillance, AI-enabled FOUP stockers will gain traction, triggering a high-margin technology-based replacement wave for suppliers.
According to research, the global FOUP stocker market is seeing a high-margin replacement wave, with advanced AI-enabled models priced at 15–25% premium over conventional systems.
Challenges:
-
Customization demands and lack of standardization across fabs complicate scalability and increase design cycle time
The layout, process flow, and automation requirements distinct for each semiconductor fab are driving the need for customized FOUP stocker designs. This customisation requirement adds complexity to the mass production of the system, and in turn longer lead times, higher costs and design complexity. In addition to that, due to the lack of a standard interface among different OEM systems, the plug-and-play deployment is still not possible. The lack of industry standards makes it difficult for FOUP stocker providers to achieve economies of scale, leading to slow market scalability and hindering widespread usage, particularly for fabs looking for rapid and cost-effective deployment.
FOUP Stockers Market Segment Analysis:
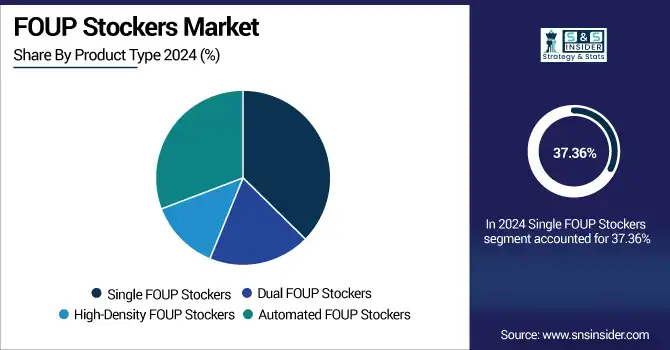
By Product Type
Single FOUP Stockers dominated the highest revenue share of about 37.36% in 2024 because of their low cost, small footprint, and optimization for a fab with low-to-medium wafer throughput. Their high-integration-design-friendly and low-MTTR requirements are the best-in-class solution for facilities looking to minimize footprint, but not performance. Companies like Tokyo Electron provide robust single FOUP stockers which can address these requirements and are therefore more predominant in older fabs and R&D environments were manufacturing efficiencies and cost are key.
Automated FOUP Stockers are projected to grow at the fastest CAGR of 10.15% from 2025 to 2032, with the rising surge in the demand for the cleanroom automation and the efficiency of the work. With those systems customers can automatically handle the FOUP without human-hand contact and minimize the potential for contamination and labour expenses. ASM Pacific Technology - Scaling new heights in factory automation The company is one of the major contributors of advanced digitalized FOUP stocker system with Industry 4.0 trends for modern fabs to improve their yield and to ready themselves for the smart manufacturing.
By End User Industry
The Semiconductor Manufacturing segment dominated the FOUP Stockers Market with a 40.98% revenue share in 2024, due to the highly frequent contact of wafer during chip patterning procedure. FOUP stockers are crucial to protecting the wafers and keeping them free from contaminants and defects in the production process. FOUP Stockers Companies such as Brooks Automation offer targeted solutions for semi fabs, helping to grow the industry which is being driven by the global appetite for electronics and digital devices.
The Solar Panel Production segment is expected to grow at the fastest CAGR of 9.99% from 2025 to 2032 because of the mounting worldwide concentration on alternative energy and increased production in solar technology. In photovoltaic production, the use of FOUP stockers becomes more and more popular to minimize defect rates due to manual handling. ULVAC Technologies is also broadening its range to penetrate the Solar Panel fabs, which are growing rapidly, the quality demands are achieved and so on.
By Technology
Mechanical Stockers segment dominated the FOUP Stockers Market share of 36.97% in 2024because they are most reliable, much less expensive to invest in, and simpler. These stockers have a very low SW overhead and are suitable for fabs with simple automation requirements. Nikon Corporation provides reliable mechanical stocker systems that are popular for their decisiveness and stable operation in the analog type manufacturing site.
Mobile Stockers are expected to grow at the fastest CAGR of 10.60% from 2025 to 2032, driven by the growing penetration of flexible, space-efficient automation systems in fabs. These stockers deliver hands-free transport, increasing both scalability and productivity. Kawasaki Heavy Industries has announced the delivery of its mobile FOUP stockers, which are well suited for smart factory environments and interest manufacturers of semiconductor equipment who require flexibility with floor layout.
By Handling Capacity
The Medium Capacity (51–100 FOUPs) segment dominated the highest revenue share of about 34.35% revenue share in 2024 because of the trade-off between space consumption and storing volume. These stockers are appropriate for medium to high fab capacities with moderate throughput handling. Entegris delivers stockers designed for this capacity range that are flexible and scalable for hybrid or growing automation environments.
Ultra High Capacity (200+ FOUPs) stockers are forecasted to grow at the fastest CAGR of 10.23% from 2025 to 2032, due to the demand for high density storage in mega fabs and advanced fabrication. Such systems make an efficient use of the space and improve the ability the to trace the wafers. Hitachi High-Tech provides ultra-high capacity FOUP stockers with central control, to realize the highest efficiency and optimum throughput in next-gen fabs.
By Additional Features
Temperature Control stockers dominated the FOUP Stockers Market share in 2024 with a 35.92% because on how they contribute on saving the wafer quality under the thermal demands. Mitsubishi Electric provides high-performance temperature-controlled FOUP stockers that keep wafers intact for fabs targeting the next generation where thermal characteristics of wafers become more critical for preserving yield.
Integration with Factory Management Systems is projected to grow at the fastest CAGR of 9.69% from 2025 to 2032, due to the emergence of smart manufacturing and digitalization. FOUP stockers having this capability allow in-line monitoring and predictive maintenance. Applied Materials is already offering FOUP stockers that come with MES and factory control so that fab-wide process visibility and operational agility is maximized.
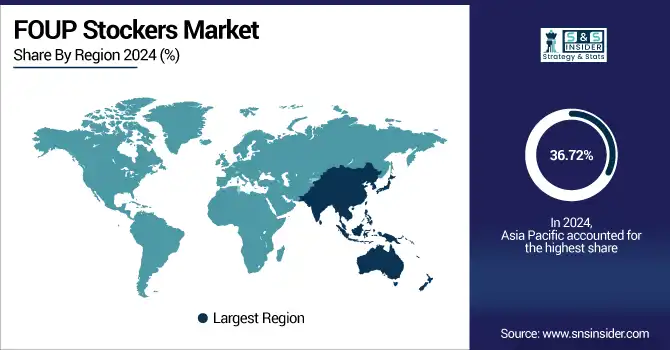
FOUP Stockers Market Regional Outlook:
Asia Pacific dominated the FOUP Stockers Market with the highest revenue share of about 36.72% in 2024, because they are located in the top semiconductor-manufacturing countries in the world, including China, Taiwan, South Korea, and Japan. Strong infrastructure, government support and access to major fabs with heavy investments in automation and cleanroom technologies support the region. Furthermore, the low-cost production and strong supply chain of the Asia Pacific region has made it the epicenter for the deployment of FOUP stocker along the semiconductor value chain.
-
Asia Pacific FOUP Stockers Market is dominated by the China owing to the presence of huge semiconductor production capacity, strong government support, and advancement in the advanced fabs. Significant investments in automation as well as local production capacity further contribute to Solidus s leadership position in wafer handling systemss.
North America is expected to grow at the fastest CAGR of about 10.41% from 2025 to 2032, fueled by the rising trend of semiconductor production reshoring, substantial investment in new fab construction, and increasing focus on smart factory adoption. Government policies, like the CHIPS Act, are pushing for local manufacturing and firms are quickly turning to advanced automation to increase production and limit dependence on the global supply chain.
-
The U.S. holds a dominating share of the North American market on account of advanced semiconductor R&D, key fab operators, and robust federal backing of the type witnessed by the CHIPS Act which is investing in domestic fabrication and cutting-edge automation.
Europe holds market share in FOUP stockers due to the presence of advanced semiconductor labs, established automotive electronics companies and increasing investments for chip manufacturing. In Europe, countries such as Germany, France and the Netherlands are increasing automation in fabs. The area also continues to benefit from EU policies supporting technological independence and cleanroom automation in all the stages of semiconductor manufacturing, increasing market demand.
-
Germany is the significant Market in the Europe owing to growing semiconductor industry, due to higher investments in R&D, Engineering expertise and investments in automation. Demand continues to be strong due to the country’s position as a leader in the automotive and industrial electronics markets.
The UAE dominates the Market in the Middle East & Africa on account of investments in high-tech manufacturing and cleanroom infrastructure. The market in Latin America is dominated by Brazil, which is adopting wafer handling robots to support electronics production, with the adoption of automation technologies expanding to improve the efficiency and precision of wafer handling processes.
Get Customized Report as per Your Business Requirement - Enquiry Now
FOUP Stockers Companies are:
Major Key Players in FOUP Stockers Market are Daifuku Co., Ltd., Genmark Automation (Nidec Group), Siasun Robot & Automation Co., Ltd., RORZE Corporation, Murata Machinery, Robots and Design (RND), KENMEC Mechanical Engineering, ANI CO, Shanghai Fortrend Technology, SEMES and others.
Recent Development:
-
In December 2023, Murata Machinery introduced the CDWX Bare Wafer Stocker at SEMICON Japan 2023. This system enhances wafer storage efficiency by removing wafers from FOUPs and storing them in specialized wafer cells, achieving higher density storage. The CDWX system began full-scale sales from the exhibition date.
-
In January 2024 – Murata Machinery filed a patent for an overhead transport system designed to transfer FOUPs between buildings. This system aims to enhance the efficiency and flexibility of wafer handling in semiconductor fabs.
| Report Attributes | Details |
|---|---|
| Market Size in 2024 | USD 1.19 Billion |
| Market Size by 2032 | USD 2.37 Billion |
| CAGR | CAGR of 9.10% From 2025 to 2032 |
| Base Year | 2024 |
| Forecast Period | 2025-2032 |
| Historical Data | 2021-2023 |
| Report Scope & Coverage | Market Size, Segments Analysis, Competitive Landscape, Regional Analysis, DROC & SWOT Analysis, Forecast Outlook |
| Key Segments | • By Product Type (Single FOUP Stockers, Dual FOUP Stockers, High-Density FOUP Stockers, Automated FOUP Stockers) • By End User Industry (Semiconductor Manufacturing, Microelectronics, LED Manufacturing, Solar Panel Production) • By Technology (Mechanical Stockers, Robotic Stockers, Modular Stockers, Mobile Stockers) • By Handling Capacity (Low Capacity (up to 50 FOUPs), Medium Capacity (51-100 FOUPs), High Capacity (101-200 FOUPs), Ultra High Capacity (200+ FOUPs)) • By Additional Features (Temperature Control, Dust-Free Environments, Automated Inventory Management, Integration with Factory Management Systems) |
| Regional Analysis/Coverage | North America (US, Canada, Mexico), Europe (Germany, France, UK, Italy, Spain, Poland, Turkey, Rest of Europe), Asia Pacific (China, India, Japan, South Korea, Singapore, Australia,Taiwan, Rest of Asia Pacific), Middle East & Africa (UAE, Saudi Arabia, Qatar, South Africa, Rest of Middle East & Africa), Latin America (Brazil, Argentina, Rest of Latin America) |
| Company Profiles | Daifuku Co., Ltd., Genmark Automation (Nidec Group), Siasun Robot & Automation Co., Ltd., RORZE Corporation, Murata Machinery, Robots and Design (RND), KENMEC Mechanical Engineering, ANI CO, Shanghai Fortrend Technology, SEMES. |
Frequently Asked Questions
Asia Pacific dominated the FOUP Stockers Market in 2024.
Single FOUP Stockers Controllers segment dominated the FOUP Stockers Market.
The major growth factor of the FOUP Stockers Market is the semiconductor production, increasing factory automation, and demand for contamination-free wafer handling.
The FOUP Stockers Market size was USD 1.19 billion in 2024 and is expected to reach USD 2.37 billion by 2032.
The FOUP Stockers Market is expected to grow at a CAGR of 9.10 % from 2025-2032.
Get in Touch
