image

Ride Sharing Market Report Scope & Overview:

Ride Sharing Market Size was valued at USD 115.30 billion in 2023 and is expected to reach USD 388.56 billion by 2031 and grow at a CAGR of 16.4% over the forecast period 2024-2031.

Ride sharing is the act of sharing a ride with another passenger, preferably in the same direction. It can be used by numerous travelers on a shared basis. There is usually a middleman that provides an app that allows riders and drivers to find and connect in order to use these ride-share services. A passenger can schedule a shared ride through the use of e-hailing, which is short for electronic hailing, by making a phone call and sending a text message, or by going to the actual location of the service provider and using the internet to access a smartphone application or website. Taxis and cabs are available for passengers to reserve or hire for predetermined trips along routes that the passenger establishes in advance.

Ride Sharing Market Report Size by 2023 -2030

Get More Information About This Research Report - Request For Sample Report

Ride-sharing services typically make use of passenger cars, motorbikes, scooters, minivans, vans, buses and coaches, auto-rickshaws, and other types of vehicles. Ride-sharing is a relatively new concept in the mobility sector that has grown in popularity alongside car-sharing, car-hailing, and carpooling. The ride-sharing system operates by people offering and accepting rides at the driver's convenience. Ride-sharing makes short and lengthy travels easier by providing one-way and two-way rides. Because many people in economically developing countries do not own cars, they rely on car-hailing services.

In 2021, BMW has expanded its car-sharing service to include BMW370 series vehicles for short and long-term rental and delivery.

MARKET DYNAMICS:

KEY DRIVERS: 

  • Demand for carpool and bike pool services has increased.

  • Demand for internet booking platforms has increased.

  • The rise in the cost of owning a car is expected to propel the market forward.

RESTRAINTS: 

  • Improvement of the public transportation system.

  • Market expansion is being limited by local transportation services and differing laws across the globe.

OPPORTUNITIES: 

  • Progress on Robo-cabs.

  • Eco-friendly electric cab services are projected to drive market growth throughout the forecast period.

CHALLENGES: 

  • Cyberattacks pose a significant threat to the market.

  • Passengers may be put at risk as a result of the advanced features.

IMPACT OF COVID-19:

The rapid expansion of COVID-19 at the beginning of the year 2020 has caused operational problems in a number of different businesses, notably the automotive industry. The primary pattern that is most severely impacted by the COVID-19 epidemic is carpooling and ridesharing. The Lockdown situation and societal conventions that encourage people to keep their distance were the primary contributors to the stagnation of the ride-sharing sector. Even now, the industry is having a hard time dealing with the customer perspective that they should adopt private automobiles rather than shared vehicles as a result of heightened health concerns and awareness of the spread of the COVID-19 virus. This is causing the market to struggle.

Market, By Type:

The global market has been divided into P2P car sharing, and Corporate Car Sharing based on the type segment. It is expected that the P2P car-sharing segment would lead the car-sharing market. P2P car sharing is a sort of vehicle sharing in which users share their automobiles with other travelers. A further benefit of the P2P approach is that the owner is present in the vehicle at all times.

Market, By Service Type:

The global market has been divided into E-hailing, Car sharing, Station-based mobility, and Car rental based on the service type segment. During the projected period, the e-hailing segment is expected to be the largest ride-sharing market. E-expanding hailing's popularity can be ascribed to a variety of factors, including the convenience of online reservations, increasing traffic congestion, improved passenger experience, and increased government efforts to raise public awareness about the dangers of air pollution.

Market, By Distance:

The global market has been divided into Long Distance, and Short Distance based on the commute type segment. Short-distance and corporate commutes are expected to dominate the market. However, because of the increasing tendency of ride-hailing platform providers to delve into these services through their current platforms, the short distance type is expected to lead during the projected period.

MARKET SEGMENTATION:

By Service Type

  • Car Sharing

  • Car Rental

  • E-Hailing

  • Station Based Mobility

By Type

  • P2P Car Sharing

  • Corporate Car Sharing

By Vehicle Type

  • ICE Vehicle

  • CNG/LPG Vehicle

  • Electric Vehicle

  • Micro Mobility Vehicle

    • Bike/Bicycle

    • Scooter

    • Others

By Data Service

  • Information Service

  • Navigation

  • Payment

  • Other

By Distance

  • Long Distance

  • Short Distance

Get Customized Report as per your Business Requirement - Request For Customized Report

REGIONAL ANALYSIS:

North America was the most successful region, with the United States accounting for approximately 95.0 percent of the regional market share. On the other hand, it is projected that Asia would eventually overtake North America within the period of the forecast. Due to the region's huge number of cities and towns that are undergoing fast urbanization, Asia is a prospective market for ride-sharing services. China and India, the two most populous countries in the world, both call this area of the world their home. China already holds a dominant position in the market for ride-hailing services and is expected to experience explosive growth in ride-sharing over the course of the projection period.

Although India has had healthy expansion over the past few years, the business sector there has not yet made the most of the opportunities presented by the country. There is still some resistance to the idea being implemented in some European nations, like Germany, therefore the content is not yet fully functional. Over the course of the past ten years, developed nations such as the United Kingdom and France have enthusiastically adopted platforms for sharing four-wheelers and bicycles.

REGIONAL COVERAGE:

North America

  • US

  • Canada

  • Mexico

Europe

  • Eastern Europe

    • Poland

    • Romania

    • Hungary

    • Turkey

    • Rest of Eastern Europe

  • Western Europe

    • Germany

    • France

    • UK

    • Italy

    • Spain

    • Netherlands

    • Switzerland

    • Austria

    • Rest of Western Europe

Asia Pacific

  • China

  • India

  • Japan

  • South Korea

  • Vietnam

  • Singapore

  • Australia

  • Rest of Asia Pacific

Middle East & Africa

  • Middle East

    • UAE

    • Egypt

    • Saudi Arabia

    • Qatar

    • Rest of Middle East

  • Africa

    • Nigeria

    • South Africa

    • Rest of Africa

Latin America

  • Brazil

  • Argentina

  • Colombia

  • Rest of Latin America   

KEY PLAYERS:

Uber Technologies Inc. (U.S.), Gett, Lyft Inc. (U.S.), Didi Chuxing Technology Co. (China), GrabTaxi Holdings Pte. Ltd. (Singapore), car2go (Germany), Cabify (Spain), Careem (UAE), Bolt Technology, Zimride are some of the affluent competitors with significant market share in the Ride Sharing Market.

Taxify (Estonia)-Company Financial Analysis

Ride Sharing Market Report Scope:
Report Attributes Details
Market Size in 2023 US$ 115.30 Billion
Market Size by 2031 US$ 388.56 Billion
CAGR CAGR of 16.4% From 2024 to 2031
Base Year 2023
Forecast Period 2024-2031
Historical Data 2020-2022
Report Scope & Coverage Market Size, Segments Analysis, Competitive  Landscape, Regional Analysis, DROC & SWOT Analysis, Forecast Outlook
Key Segments
  • by Service Type (Car Sharing, Car Rental, E-Hailing, Station Based Mobility)
  • by Type (P2P Car Sharing, Corporate Car Sharing)
  • by Vehicle Type [ICE Vehicle, CNG/LPG Vehicle, Electric Vehicle, Micro Mobility Vehicle (Bike/Bicycle, Scooter, Others)]
  • By Data Service (Information Service, Navigation, Payment, Other)
  • By Distance (Long Distance, Short Distance)
Regional Analysis/Coverage North America (US, Canada, Mexico), Europe (Eastern Europe [Poland, Romania, Hungary, Turkey, Rest of Eastern Europe] Western Europe] Germany, France, UK, Italy, Spain, Netherlands, Switzerland, Austria, Rest of Western Europe]), Asia Pacific (China, India, Japan, South Korea, Vietnam, Singapore, Australia, Rest of Asia Pacific), Middle East & Africa (Middle East [UAE, Egypt, Saudi Arabia, Qatar, Rest of Middle East], Africa [Nigeria, South Africa, Rest of Africa], Latin America (Brazil, Argentina, Colombia, Rest of Latin America)
Company Profiles

Uber Technologies Inc. (U.S.), Gett, Lyft Inc. (U.S.), Didi Chuxing Technology Co. (China), GrabTaxi Holdings Pte. Ltd. (Singapore), car2go (Germany), Cabify (Spain), Careem (UAE), Bolt Technology, Zimride

Key Drivers •Demand for carpool and bike pool services has increased.

•Demand for internet booking platforms has increased.
RESTRAINTS •Improvement of the public transportation system.

•Market expansion is being limited by local transportation services and differing laws across the globe.

Frequently Asked Questions

Ans:- The market forecast period is 2024-2031 according to the study report.

Ans;- Ride sharing is the act of sharing a ride with another passenger, preferably in the same direction.

Ans:- Progress on Robo-cabs & Eco-friendly electric cab services are projected are the most promising aspects/opportunities of the market.

Ans:- The e-hailing segment is expected to see the most significant growth.

Ans:- Raw material vendors, Distributors/traders/wholesalers/suppliers, Regulatory authorities, government agencies and NGOs, Commercial research & development (R&D) institutions, Trade/Industrial associations, and End-use industries are the stakeholder of this report.

TABLE OF CONTENTS

1. Introduction

1.1 Market Definition

1.2 Scope

1.3 Research Assumptions

2. Industry Flowchart

3. Research Methodology

4. Market Dynamics

4.1 Drivers

4.2 Restraints

4.3 Opportunities

4.4 Challenges

5. Impact Analysis

5.1 Impact of Russia-Ukraine Crisis

5.2 Impact of Economic Slowdown on Major Countries

5.2.1 Introduction

5.2.2 United States

5.2.3 Canada

5.2.4 Germany

5.2.5 France

5.2.6 UK

5.2.7 China

5.2.8 Japan

5.2.9 South Korea

5.2.10 India

6. Value Chain Analysis

7. Porter’s 5 Forces Model

8.  Pest Analysis

9. Ride Sharing Market Segmentation, By Data Service

9.1 Introduction

9.2 Trend Analysis

9.3 Information Service

9.4 Navigation

9.5 Payment

9.6 Other

10. Ride Sharing Market Segmentation, By Service Type

10.1 Introduction

10.2 Trend Analysis

10.3 Car Sharing

10.4 Car Rental

10.5 E-Hailing

10.6 Station Based Mobility

11. Ride Sharing Market Segmentation, By Vehicle Type

11.1 Introduction

11.2 Trend Analysis

11.3 ICE Vehicle

11.4 CNG/LPG Vehicle

11.5 lectric Vehicle

11.6 Micro Mobility Vehicle

11.6.1 Bike/Bicycle

11.6.2 Scooter

11.6.3 Others

12. Ride Sharing Market Segmentation, By Type

12.1 Introduction

12.2 Trend Analysis

12.3 P2P Car Sharing

12.4 Corporate Car Sharing

13. Ride Sharing Market Segmentation, By Distance

13.1 Introduction

13.2 Trend Analysis

13.3 Long Distance

13.4 Short Distance

14. Regional Analysis

14.1 Introduction

14.2 North America

14.2.1 Trend Analysis

14.2.2 North America Ride Sharing Market By Country

14.2.3 North America Ride Sharing Market By Data Service

14.2.4 North America Ride Sharing Market By Service Type

14.2.5 North America Ride Sharing Market By Vehicle Type

14.2.6 North America Ride Sharing Market, By Type

14.2.7 North America Ride Sharing Market, By Distance

14.2.8 USA     

14.2.8.1 USA Ride Sharing Market By Data Service

14.2.8.2 USA Ride Sharing Market By Service Type

14.2.8.3 USA Ride Sharing Market By Vehicle Type

14.2.8.4 USA Ride Sharing Market, By Type

14.2.8.5 USA Ride Sharing Market, By Distance

14.2.9 Canada

14.2.9.1 Canada Ride Sharing Market By Data Service     

14.2.9.2 Canada Ride Sharing Market By Service Type

14.2.9.3 Canada Ride Sharing Market By Vehicle Type

14.2.9.4 Canada Ride Sharing Market, By Type

14.2.9.5 Canada Ride Sharing Market, By Distance

14.2.10 Mexico

14.2.10.1 Mexico Ride Sharing Market By Data Service

14.2.10.2 Mexico Ride Sharing Market By Service Type

14.2.10.3 Mexico Ride Sharing Market By Vehicle Type

14.2.10.4 Mexico Ride Sharing Market, By Type

14.2.10.5 Mexico Ride Sharing Market, By Distance

14.3 Europe

14.3.1 Trend Analysis

14.3.2 Eastern Europe

14.3.2.1 Eastern Europe Ride Sharing Market By Country

14.3.2.2 Eastern Europe Ride Sharing Market By Data Service

14.3.2.3 Eastern Europe Ride Sharing Market By Service Type

14.3.2.4 Eastern Europe Ride Sharing Market By Vehicle Type

14.3.2.5 Eastern Europe Ride Sharing Market By Type

14.3.2.6 Eastern Europe Ride Sharing Market, By Distance

14.3.2.7 Poland

14.3.2.7.1 Poland Ride Sharing Market By Data Service   

14.3.2.7.2 Poland Ride Sharing Market By Service Type

14.3.2.7.3 Poland Ride Sharing Market By Vehicle Type

14.3.2.7.4 Poland Ride Sharing Market By Type

14.3.2.7.5 Poland Ride Sharing Market, By Distance

14.3.2.8 Romania

14.3.2.8.1 Romania Ride Sharing Market By Data Service

14.3.2.8.2 Romania Ride Sharing Market By Service Type

14.3.2.8.3 Romania Ride Sharing Market By Vehicle Type

14.3.2.8.4 Romania Ride Sharing Market By Type

14.3.2.8.5 Romania Ride Sharing Market, By Distance

14.3.2.9 Hungary

14.3.2.9.1 Hungary Ride Sharing Market By Data Service

14.3.2.9.2 Hungary Ride Sharing Market By Service Type

14.3.2.9.3 Hungary Ride Sharing Market By Vehicle Type

14.3.2.9.4 Hungary Ride Sharing Market By Type

14.3.2.9.5 Hungary Ride Sharing Market, By Distance

14.3.2.10 Turkey

14.3.2.10.1 Turkey Ride Sharing Market By Data Service

14.3.2.10.2 Turkey Ride Sharing Market By Service Type

14.3.2.10.3 Turkey Ride Sharing Market By Vehicle Type

14.3.2.10.4 Turkey Ride Sharing Market By Type

14.3.2.10.5 Turkey Ride Sharing Market, By Distance

14.3.2.11 Rest of Eastern Europe

14.3.2.11.1 Rest of Eastern Europe Ride Sharing Market By Data Service

14.3.2.11.2 Rest of Eastern Europe Ride Sharing Market By Service Type

14.3.2.11.3 Rest of Eastern Europe Ride Sharing Market By Vehicle Type

14.3.2.11.4 Rest of Eastern Europe Ride Sharing Market By Type

14.3.2.11.5 Rest of Eastern Europe Ride Sharing Market, By Distance

14.3.3 Western Europe 

14.3.3.1 Western Europe Ride Sharing Market By Country

14.3.3.2 Western Europe Ride Sharing Market By Data Service

14.3.3.3 Western Europe Ride Sharing Market By Service Type

14.3.3.4 Western Europe Ride Sharing Market By Vehicle Type

14.3.3.5 Western Europe Ride Sharing Market By Type

14.3.3.6 Western Europe Ride Sharing Market, By Distance

14.3.3.7 Germany

14.3.3.7.1 Germany Ride Sharing Market By Data Service

14.3.3.7.2 Germany Ride Sharing Market By Service Type

14.3.3.7.3 Germany Ride Sharing Market By Vehicle Type

14.3.3.7.4 Germany Ride Sharing Market By Type

14.3.3.7.5 Germany Ride Sharing Market, By Distance

14.3.3.8 France 

14.3.3.8.1 France Ride Sharing Market By Data Service

14.3.3.8.2 France Ride Sharing Market By Service Type

14.3.3.8.3 France Ride Sharing Market By Vehicle Type

14.3.3.8.4 France Ride Sharing Market By Type

14.3.3.8.5 France Ride Sharing Market, By Distance

14.3.3.9 UK

14.3.3.9.1 UK Ride Sharing Market By Data Service

14.3.3.9.2 UK Ride Sharing Market By Service Type

14.3.3.9.3 UK Ride Sharing Market By Vehicle Type

14.3.3.9.4 UK Ride Sharing Market By Type

14.3.3.9.5 UK Ride Sharing Market, By Distance

14.3.3.10 Italy

14.3.3.10.1 Italy Ride Sharing Market By Data Service     

14.3.3.10.2 Italy Ride Sharing Market By Service Type

14.3.3.10.3 Italy Ride Sharing Market By Vehicle Type

14.3.3.10.4 Italy Ride Sharing Market By Type

14.3.3.10.5 Italy Ride Sharing Market, By Distance

14.3.3.11 Spain

14.3.3.11.1 Spain Ride Sharing Market By Data Service

14.3.3.11.2 Spain Ride Sharing Market By Service Type

14.3.3.11.3 Spain Ride Sharing Market By Vehicle Type

14.3.3.11.4 Spain Ride Sharing Market By Type

14.3.3.11.5 Spain Ride Sharing Market, By Distance

14.3.3.12 Netherlands

14.3.3.12.1 Netherlands Ride Sharing Market By Data Service   

14.3.3.12.2 Netherlands Ride Sharing Market By Service Type

14.3.3.12.3 Netherlands Ride Sharing Market By Vehicle Type

14.3.3.12.4 Netherlands Ride Sharing Market By Type

14.3.3.12.5 Netherlands Ride Sharing Market, By Distance

14.3.3.13 Switzerland

14.3.3.13.1 Switzerland Ride Sharing Market By Data Service    

14.3.3.13.2 Switzerland Ride Sharing Market By Service Type

14.3.3.13.3 Switzerland Ride Sharing Market By Vehicle Type

14.3.3.13.4 Switzerland Ride Sharing Market By Type

14.3.3.13.5 Switzerland Ride Sharing Market, By Distance

14.3.3.14 Austria 

14.3.3.14.1 Austria Ride Sharing Market By Data Service

14.3.3.14.2 Austria Ride Sharing Market By Service Type           

14.3.3.14.3 Austria Ride Sharing Market By Vehicle Type

14.3.3.14.4 Austria Ride Sharing Market By Type

14.3.3.14.5 Austria Ride Sharing Market, By Distance

14.3.3.15 Rest of Western Europe

14.3.3.15.1 Rest of Western Europe Ride Sharing Market By Data Service

14.3.3.15.2 Rest of Western Europe Ride Sharing Market By Service Type

14.3.3.15.3 Rest of Western Europe Ride Sharing Market By Vehicle Type

14.3.3.15.4 Rest of Western Europe Ride Sharing Market By Type

14.3.3.15.5 Rest of Western Europe Ride Sharing Market, By Distance

14.4 Asia-Pacific

14.4.1 Trend Analysis

14.4.2 Asia-Pacific Ride Sharing Market By country

14.4.3 Asia-Pacific Ride Sharing Market By Data Service 

14.4.4 Asia-Pacific Ride Sharing Market By Service Type

14.4.5 Asia-Pacific Ride Sharing Market By Vehicle Type

14.4.6 Asia-Pacific Ride Sharing Market By Type

14.4.7 Asia-Pacific Ride Sharing Market, By Distance

14.4.8 China

14.4.8.1 China Ride Sharing Market By Data Service        

14.4.8.2 China Ride Sharing Market By Service Type       

14.4.8.3 China Ride Sharing Market By Vehicle Type

14.4.8.4 China Ride Sharing Market By Type

14.4.8.5 China Ride Sharing Market, By Distance

14.4.9 India

14.4.9.1 India Ride Sharing Market By Data Service

14.4.9.2 India Ride Sharing Market By Service Type

14.4.9.3 India Ride Sharing Market By Vehicle Type

14.4.9.4 India Ride Sharing Market By Type

14.4.9.5 India Ride Sharing Market, By Distance

14.4.10 Japan

14.4.10.1 Japan Ride Sharing Market By Data Service

14.4.10.2 Japan Ride Sharing Market By Service Type

14.4.10.3 Japan Ride Sharing Market By Vehicle Type

14.4.10.4 Japan Ride Sharing Market By Type

14.4.10.5 Japan Ride Sharing Market, By Distance

14.4.11 South Korea

14.4.11.1 South Korea Ride Sharing Market By Data Service

14.4.11.2 South Korea Ride Sharing Market By Service Type

14.4.11.3 South Korea Ride Sharing Market By Vehicle Type

14.4.11.4 South Korea Ride Sharing Market By Type

14.4.11.5 South Korea Ride Sharing Market, By Distance

14.4.12 Vietnam

14.4.12.1 Vietnam Ride Sharing Market By Data Service

14.4.12.2 Vietnam Ride Sharing Market By Service Type

14.4.12.3 Vietnam Ride Sharing Market By Vehicle Type

14.4.12.4 Vietnam Ride Sharing Market By Type

14.4.12.5 Vietnam Ride Sharing Market, By Distance

14.4.13 Singapore

14.4.13.1 Singapore Ride Sharing Market By Data Service

14.4.13.2 Singapore Ride Sharing Market By Service Type

14.4.13.3 Singapore Ride Sharing Market By Vehicle Type

14.4.13.4 Singapore Ride Sharing Market By Type

14.4.13.5 Singapore Ride Sharing Market, By Distance

14.4.14 Australia

14.4.14.1 Australia Ride Sharing Market By Data Service

14.4.14.2 Australia Ride Sharing Market By Service Type

14.4.14.3 Australia Ride Sharing Market By Vehicle Type

14.4.14.4 Australia Ride Sharing Market By Type

14.4.14.5 Australia Ride Sharing Market, By Distance

14.4.15 Rest of Asia-Pacific

14.4.15.1 Rest of Asia-Pacific Ride Sharing Market By Data Service

14.4.15.2 Rest of Asia-Pacific Ride Sharing Market By Service Type

14.4.15.3 Rest of Asia-Pacific Ride Sharing Market By Vehicle Type

14.4.15.4 Rest of Asia-Pacific Ride Sharing Market By Type

14.4.15.5 Rest of Asia-Pacific Ride Sharing Market, By Distance

14.5 Middle East & Africa

14.5.1 Trend Analysis

14.5.2 Middle East

14.5.2.1 Middle East Ride Sharing Market By Country

14.5.2.2 Middle East Ride Sharing Market By Data Service

14.5.2.3 Middle East Ride Sharing Market By Service Type

14.5.2.4 Middle East Ride Sharing Market By Vehicle Type

14.5.2.5 Middle East Ride Sharing Market By Type

14.5.2.6 Middle East Ride Sharing Market, By Distance

14.5.2.7 UAE

14.5.2.7.1 UAE Ride Sharing Market By Data Service

14.5.2.7.2 UAE Ride Sharing Market By Service Type

14.5.2.7.3 UAE Ride Sharing Market By Vehicle Type

14.5.2.7.4 UAE Ride Sharing Market By Type

14.5.2.7.5 UAE Ride Sharing Market, By Distance

14.5.2.8 Egypt

14.5.2.8.1 Egypt Ride Sharing Market By Data Service

14.5.2.8.2 Egypt Ride Sharing Market By Service Type

14.5.2.8.3 Egypt Ride Sharing Market By Vehicle Type

14.5.2.8.4 Egypt Ride Sharing Market By Type

14.5.2.8.5 Egypt Ride Sharing Market, By Distance

14.5.2.9 Saudi Arabia 

14.5.2.9.1 Saudi Arabia Ride Sharing Market By Data Service

14.5.2.9.2 Saudi Arabia Ride Sharing Market By Service Type

14.5.2.9.3 Saudi Arabia Ride Sharing Market By Vehicle Type

14.5.2.9.4 Saudi Arabia Ride Sharing Market By Type

14.5.2.9.5 Saudi Arabia Ride Sharing Market, By Distance

14.5.2.10 Qatar

14.5.2.10.1 Qatar Ride Sharing Market By Data Service

14.5.2.10.2 Qatar Ride Sharing Market By Service Type

14.5.2.10.3 Qatar Ride Sharing Market By Vehicle Type

14.5.2.10.4 Qatar Ride Sharing Market By Type

14.5.2.10.5 Qatar Ride Sharing Market, By Distance

14.5.2.11 Rest of Middle East

14.5.2.11.1 Rest of Middle East Ride Sharing Market By Data Service

14.5.2.11.2 Rest of Middle East Ride Sharing Market By Service Type

14.5.2.11.3 Rest of Middle East Ride Sharing Market By Vehicle Type

14.5.2.11.4 Rest of Middle East Ride Sharing Market By Type

14.5.2.11.5 Rest of Middle East Ride Sharing Market, By Distance

14.5.3 Africa

14.5.3.1 Africa Ride Sharing Market By Country

14.5.3.2 Africa Ride Sharing Market By Data Service

14.5.3.3 Africa Ride Sharing Market By Service Type

14.5.3.4 Africa Ride Sharing Market By Vehicle Type

14.5.3.5 Africa Ride Sharing Market By Type

14.5.3.6 Africa Ride Sharing Market, By Distance

14.5.3.7 Nigeria

14.5.3.7.1 Nigeria Ride Sharing Market By Data Service

14.5.3.7.2 Nigeria Ride Sharing Market By Service Type

14.5.3.7.3 Nigeria Ride Sharing Market By Vehicle Type

14.5.3.7.4 Nigeria Ride Sharing Market By Type

14.5.3.7.5 Nigeria Ride Sharing Market, By Distance

14.5.3.8 South Africa

14.5.3.8.1 South Africa Ride Sharing Market By Data Service

14.5.3.8.2 South Africa Ride Sharing Market By Service Type

14.5.3.8.3 South Africa Ride Sharing Market By Vehicle Type

14.5.3.8.4 South Africa Ride Sharing Market By Type

14.5.3.8.5 South Africa Ride Sharing Market, By Distance

14.5.3.9 Rest of Africa

14.5.3.9.1 Rest of Africa Ride Sharing Market By Data Service

14.5.3.9.2 Rest of Africa Ride Sharing Market By Service Type

14.5.3.9.3 Rest of Africa Ride Sharing Market By Vehicle Type

14.5.3.9.4 Rest of Africa Ride Sharing Market By Type

14.5.3.9.5 Rest of Africa Ride Sharing Market, By Distance

14.6 Latin America

14.6.1 Trend Analysis

14.6.2 Latin America Ride Sharing Market By country

14.6.3 Latin America Ride Sharing Market By Data Service

14.6.4 Latin America Ride Sharing Market By Service Type

14.6.5 Latin America Ride Sharing Market By Vehicle Type

14.6.6 Latin America Ride Sharing Market By Type

14.6.7 Latin America Ride Sharing Market, By Distance

14.6.8 Brazil

14.6.8.1 Brazil Ride Sharing Market By Data Service

14.6.8.2 Brazil Ride Sharing Market By Service Type

14.6.8.3 Brazil Ride Sharing Market By Vehicle Type

14.6.8.4 Brazil Ride Sharing Market By Type

14.6.8.5 Brazil Ride Sharing Market, By Distance

14.6.9 Argentina

14.6.9.1 Argentina Ride Sharing Market By Data Service

14.6.9.2 Argentina Ride Sharing Market By Service Type

14.6.9.3 Argentina Ride Sharing Market By Vehicle Type

14.6.9.4 Argentina Ride Sharing Market By Type

14.6.9.5 Argentina Ride Sharing Market, By Distance

14.6.10 Colombia

14.6.10.1 Colombia Ride Sharing Market By Data Service

14.6.10.2 Colombia Ride Sharing Market By Service Type

14.6.10.3 Colombia Ride Sharing Market By Vehicle Type

14.6.10.4 Colombia Ride Sharing Market By Type

14.6.10.5 Colombia Ride Sharing Market, By Distance

14.6.11 Rest of Latin America

14.6.11.1 Rest of Latin America Ride Sharing Market By Data Service

14.6.11.2 Rest of Latin America Ride Sharing Market By Service Type

14.6.11.3 Rest of Latin America Ride Sharing Market By Vehicle Type

14.6.11.4 Rest of Latin America Ride Sharing Market By Type

14.6.11.5 Rest of Latin America Ride Sharing Market, By Distance

15. Company Profiles

15.1 Uber Technologies Inc

15.1.1 Company Overview

15.1.2 Financial

15.1.3 Products/ Services Offered

15.1.4 SWOT Analysis

15.1.5 The SNS View

15.2 Gett

15.2.1 Company Overview

15.2.2 Financial

15.2.3 Products/ Services Offered

15.2.4 SWOT Analysis

15.2.5 The SNS View

15.3 Lyft Inc.

15.3.1 Company Overview

15.3.2 Financial

15.3.3 Products/ Services Offered

15.3.4 SWOT Analysis

15.3.5 The SNS View

15.4 Didi Chuxing Technology Co.

15.4.1 Company Overview

15.4.2 Financial

15.4.3 Products/ Services Offered

15.4.4 SWOT Analysis

15.4.5 The SNS View

15.5 GrabTaxi Holdings Pte. Ltd

15.5.1 Company Overview

15.5.2 Financial

15.5.3 Products/ Services Offered

15.5.4 SWOT Analysis

15.5.5 The SNS View

15.6 car2go

15.6.1 Company Overview

15.6.2 Financial

15.6.3 Products/ Services Offered

15.6.4 SWOT Analysis

15.6.5 The SNS View

15.7 Cabify

15.7.1 Company Overview

15.7.2 Financial

15.7.3 Products/ Services Offered

15.7.4 SWOT Analysis

15.7.5 The SNS View

15.8 Careem

15.8.1 Company Overview

15.8.2 Financial

15.8.3 Products/ Services Offered

15.8.4 SWOT Analysis

15.8.5 The SNS View

15.9 Bolt Technology

15.9.1 Company Overview

15.9.2 Financial

15.9.3 Products/ Services Offered

15.9.4 SWOT Analysis

15.9.5 The SNS View

15.10 Zimride 

15.10.1 Company Overview

15.10.2 Financial

15.10.3 Products/ Services Offered

15.10.4 SWOT Analysis

15.10.5 The SNS View

16. Competitive Landscape

16.1 Competitive Benchmarking

16.2 Market Share Analysis

16.3 Recent Developments

            16.3.1 Industry News

            16.3.2 Company News

            16.3.3 Mergers & Acquisitions

17. Use Case and Best Practices

18. Conclusion

An accurate research report requires proper strategizing as well as implementation. There are multiple factors involved in the completion of good and accurate research report and selecting the best methodology to compete the research is the toughest part. Since the research reports we provide play a crucial role in any company’s decision-making process, therefore we at SNS Insider always believe that we should choose the best method which gives us results closer to reality. This allows us to reach at a stage wherein we can provide our clients best and accurate investment to output ratio.

Each report that we prepare takes a timeframe of 350-400 business hours for production. Starting from the selection of titles through a couple of in-depth brain storming session to the final QC process before uploading our titles on our website we dedicate around 350 working hours. The titles are selected based on their current market cap and the foreseen CAGR and growth.


The 5 steps process:

Step 1: Secondary Research:

Secondary Research or Desk Research is as the name suggests is a research process wherein, we collect data through the readily available information. In this process we use various paid and unpaid databases which our team has access to and gather data through the same. This includes examining of listed companies’ annual reports, Journals, SEC filling etc. Apart from this our team has access to various associations across the globe across different industries. Lastly, we have exchange relationships with various university as well as individual libraries.
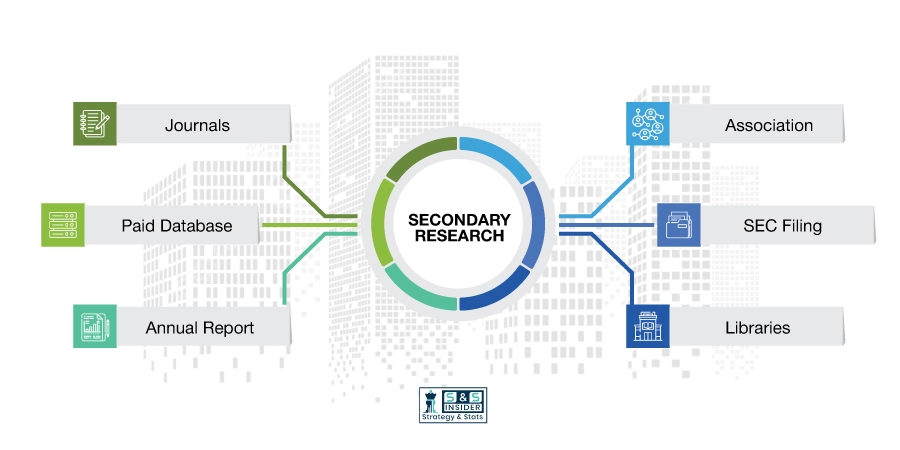
Secondary Research

Step 2: Primary Research

When we talk about primary research, it is a type of study in which the researchers collect relevant data samples directly, rather than relying on previously collected data.  This type of research is focused on gaining content specific facts that can be sued to solve specific problems. Since the collected data is fresh and first hand therefore it makes the study more accurate and genuine.

We at SNS Insider have divided Primary Research into 2 parts.

Part 1 wherein we interview the KOLs of major players as well as the upcoming ones across various geographic regions. This allows us to have their view over the market scenario and acts as an important tool to come closer to the accurate market numbers. As many as 45 paid and unpaid primary interviews are taken from both the demand and supply side of the industry to make sure we land at an accurate judgement and analysis of the market.

This step involves the triangulation of data wherein our team analyses the interview transcripts, online survey responses and observation of on filed participants. The below mentioned chart should give a better understanding of the part 1 of the primary interview.
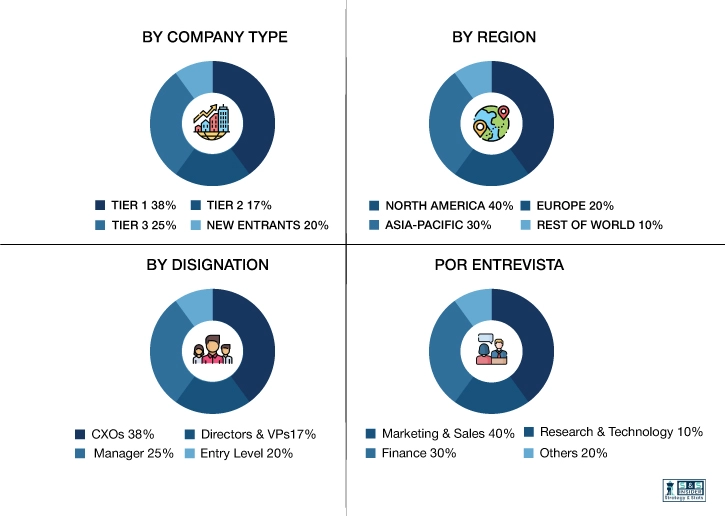
Primary Research

Part 2: In this part of primary research the data collected via secondary research and the part 1 of the primary research is validated with the interviews from individual consultants and subject matter experts.

Consultants are those set of people who have at least 12 years of experience and expertise within the industry whereas Subject Matter Experts are those with at least 15 years of experience behind their back within the same space. The data with the help of two main processes i.e., FGDs (Focused Group Discussions) and IDs (Individual Discussions). This gives us a 3rd party nonbiased primary view of the market scenario making it a more dependable one while collation of the data pointers.

Step 3: Data Bank Validation

Once all the information is collected via primary and secondary sources, we run that information for data validation. At our intelligence centre our research heads track a lot of information related to the market which includes the quarterly reports, the daily stock prices, and other relevant information. Our data bank server gets updated every fortnight and that is how the information which we collected using our primary and secondary information is revalidated in real time.

Data Bank Validation

Step 4: QA/QC Process

After all the data collection and validation our team does a final level of quality check and quality assurance to get rid of any unwanted or undesired mistakes. This might include but not limited to getting rid of the any typos, duplication of numbers or missing of any important information. The people involved in this process include technical content writers, research heads and graphics people. Once this process is completed the title gets uploader on our platform for our clients to read it.

Step 5: Final QC/QA Process:

This is the last process and comes when the client has ordered the study. In this process a final QA/QC is done before the study is emailed to the client. Since we believe in giving our clients a good experience of our research studies, therefore, to make sure that we do not lack at our end in any way humanly possible we do a final round of quality check and then dispatch the study to the client.

Start a Conversation

Hi! Click one of our member below to chat on Phone