Smartphone Sensors Market Report Scope & Overview:
Get more information on the Smartphone Sensors Market - Request Sample Report
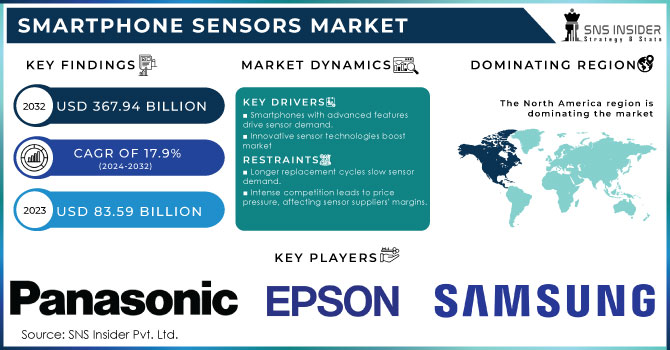
The Smartphone Sensors Market Size was valued at USD 83.59 billion in 2023 and is expected to reach USD 367.94 billion by 2032 and grow at a CAGR of 17.9% over the forecast period 2024-2032.
An increasing demand for the application of AI in the agricultural sector, especially in the U.S., is raising the potential market growth of the smartphone sensor sector. In the U.S., AI is being adopted more and more for the purpose of monitoring crop health, detecting pests, optimizing irrigation and estimating yields across every hundred hectares of land farmed. The requirements for such use of AI in smartphones, such as cameras, GPS, environmental sensors etc., will continue to grow as AI advances. It is estimated that both presently and in the future, there will be a demand for these sensors at nearly two billion American farms, due to a rapidly increasing world population that needs to be fed. Moreover, the U.S. has climate conditions that are generally suitable for growing crops and should become one of the world-leading exporters of crops, and subsequently a key player in the development of the sensor market, given the economic weight of exports of agricultural products: the value of U.S. agricultural exports, according to available data, has exceeded 100 billion dollars this past year, say. Since the operations to keep up with these developments are increasingly constrained by climate change and the need to innovate is raised, this move is supported by the idea that the smartphone sensor market is an expanding sector is supported by the increasing financial and human resources being allocated by programs and institutions such as the AI Institute for Resilient Agriculture at Iowa State, which are dedicated to improving AI technology.
The rapid spread of IoT devices across a variety of industries, with a particular emphasis on mobility and automotive, generated a massive surge in the smartphone sensor market. As sensors play a critical part in the functioning and safety of these connected devices, the making of IoT technology has prompted high demand for modern sensors, including biometric, environmental, and motion sensors, in smartphones. Apart from innovation, the growth is stimulated by an increased focus on cybersecurity and customer safety standards. The new U.S. Cyber Trust Mark Labeling Program, for example, is anticipated to ensure that IoT devices, including smartphones, meet tough cyber security standards in the market and become fully operational by late 2024. To help shift the focus of vendors on safety and boost consumer smartphone usage, the FCC has launched the optional labeling app. In addition, global cybersecurity was in the spotlight in the EU Cyber Resilience Act and the UK PSTI Bill, which impose additional cyber security standards on IoT devices, potentially complicating compliance. Alone, these demands and programs would impel the need for enhanced cybersecurity, but the impact on the smartphone sensor market will be even more pervasive. Countless off-brand manufacturers are expected to differentiate their smartphones by adding improved sensors and soon after mainstream vendors are anticipated to adapt. For instance, Infineon and other companies have already updated their products, such as their IoT development kits, to comply with the new cyber security requirements. Together with the expansion of IoT in general, the market for Smartphone Sensors is expected to experience massive expansion as a result of governmental cyber governance schemes. Finally, the smartphone sensor market will be an integral part of the IoT for which the development is just beginning, and many of those who worked on the smartphone sensor market will switch their focus entirely to smart objects.
Market Dynamics
Drivers
Incorporation of Self-Powered Sensors Enabled by Advanced 5G Networks
One of the factors that is going to the smartphone sensor market seeing a huge increase is the introduction of 5G-Advanced networks. These standardized networks are going to change sensor technology by making it possible to have self-powered and battery-free sensors. These advanced IoT technologies are being developed to solve the disadvantages with current RFID systems, such as a limited range of communication, expensive to implement, and the fact that it cannot be automated.. A field test took place in the second quarter of 2022, and the advanced IoT technology had coverage that was ten times superior to passive RFID tags, which the base station can read at a maximum covering of 235 meters and a target link budget of 98 dB. Additionally, these sensors are able to generate their own power, which only consumes 100 µW per device, making them 100 times superior to NB-IoT, while their battery can last ten years without having to be replaced. At 50 U.S. cents per device, the device is very cheap to implement in smartphones. The functionality of the sensors reaches a two to three meter range when determining the location of the device, enabling the smartphone’s features for location, surround sensing, and enhancing relationship connection. This is going to cause a significant change in the smartphone sensor market as it is going to lead to a huge increase in its production. This advance is important for smartphones for them to increase their influence and the user functionalities for different uses and making overall progress on the market.
The smartphone sensor market gets driven by the synergies between 5G and IoT.
The quick adoption of 5G technology, coupled with the expanding Internet of Things network, is the primary cause of the smartphone sensor market. As we move into the 5G age, the number of connected devices is estimated to rise significantly. The 5G network is on track to promote the rapid development of connected devices by offering new services and applications. There are only nearly 8 billion connected devices worldwide right now, but in the next four to five years, that number will increase by a considerable margin. Fifth-gen networks are vastly more than just faster data connections. These networks promise ultra-low latency, capacity, and network slicing, which is necessary for IoT Smartphone Types. Low latency and massive capacity are required for all of the consumer goods that will be built into smart cities, autonomous cars, health-care systems, and other things. Moreover, the 22 billion connected devices around the world, which includes even more than almost 9 billion smartphones as part of the network right now, will require advanced sensors to meet this huge increase in demand. The emergence of 5G technology has dramatically changed the IoT landscape. We are entering a phase where smartphones can support several gigabits per second at speeds of mere 30 milliseconds. The low latency allows for precise actions like remote surgery and predictive maintenance. As a result, the need for advanced sensors in smartphones is growing. Smartphone Sensors will be more important as a result of the help from 5G networks, allowing for real-time data transfer, enriching user experiences, and enabling more devices to be deployed within IoT trends. The coming together of 5G and IoT fosters creativity, improves the efficiency of businesses, and facilitates scaling. As a result, performance and productivity are maximized in a connected environment. There are a growing number of devices in a digital and connected world driven by 5G and IoT networks, making sensors absolutely indispensable as a result of this growing trend.
Restraints
Power usage and cost effectiveness in sensors of smartphones.
Balancing power consumption and cost efficiency is a key challenge in the smartphone sensor market. Conventional sensors, which depend on batteries for functionality, have notable disadvantages such as expensive upkeep and environmental issues associated with battery disposal. Industries such as manufacturing, mining, and energy are increasingly seeking sensors that provide dependable functionality at a low cost, preferably below 10 U.S. cents per unit and using only 100 microwatts of power. This requirement shows the importance of incorporating sensors into large-scale networks without facing high costs or using too much energy. Additionally, although RFID tags are frequently employed for monitoring inventory, their restricted coverage range and vulnerability to interference hinder their effectiveness for extensive or densely populated situations. The difficulties linked to RFID, like the time and effort needed to oversee these systems, make it even harder to adopt affordable and long-lasting sensor solutions. As the smartphone sensor market advances, it will be essential to overcome these limitations in order to promote creativity and fulfill the needs of different industries that rely on affordable and energy-efficient sensor technologies.
Segment Analysis
By Product
During 2023, image sensors were the leading technology in the smartphone sensor market, accounting for 29% of the market share, showcasing their important contribution to the advancement of smartphone photography and videography. Rising consumer desire for superior photo and video features on smartphones is the main factor fueling the growth of the image sensors sector. With the increasing use of user-generated content on social media platforms, there is a rising requirement for smartphones to have advanced image sensors to keep up. CMOS sensors are increasingly popular because of their high performance and cost effectiveness. Compared to other sensor technologies, they provide notable enhancements in image quality, low-light shooting abilities, and energy efficiency. The adaptability of CMOS sensors is clear in their use in various camera systems in smartphones, such as wide-angle, ultra-wide-angle, telephoto, and macro lenses, each needing its own sensor for best results. Sony, Samsung, and Omni Vision are at the forefront of the industry. For example, Sony has been a significant contender with its advanced IMX series of CMOS sensors, offering high resolution and exceptional low-light capabilities. Samsung's ISOCELL sensors are well-known in the market for their innovative features, such as Tetra cell technology for enhanced low-light imaging and Smart-ISO for better dynamic range. The OV series by Omni Vision continues to enhance the market by offering sensors that combine great image quality and affordability. The essential role of CMOS sensors in modern smartphones is emphasized by these advancements and their widespread adoption, fulfilling various imaging needs ranging from everyday photography to complex computational photography Smartphone Types.
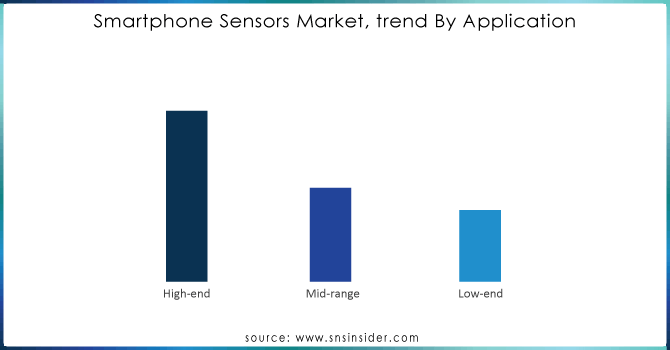
By Application
Based on Application, the High-End Dominate the smart phone sensor market with 42% of share in 2023. Magnetometers for navigation, 3D sensing for facial recognition and AR, EIS and OIS for better image and video quality, and proximity sensors for touchless interactions are the sensors that enhance the high-end smartphones’ features and user experiences. Both Apple and Samsung have incorporated the sensors into its iPhone and Galaxy series, respectively. In detail, the 3D sensing technology equipped with the sensor is implied in Apple’s advanced True Depth camera system, which is used in both Face ID and AR functions. In addition, Samsung uses EIS and OIS to benefit the image stabilization of the devices. Furthermore, Sony, STMicroelectronics, and other significant contributors to the technology deliver exceptionally high-resolution magnetometer and motion sensors. In general, the advanced sensors play an instrumental role in the progress of smartphone technology as they significantly improve the functions of high-end devices by enhancing their capabilities. At the same time, they generate massive revenue in the market.
Get Customized Report as per your Business Requirement - Request For Customized Report
REGIONAL ANALYSIS:
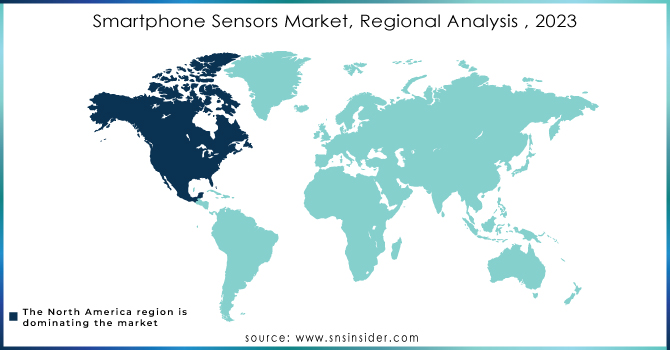
Regional Analysis
North America dominate the smart phone sensor market with 34% of share in 2023. The rapid control of the high-end market sector in North America is attributed to its advanced technology. Because its high profit in high-demand for high-end smartphones thus, many of the top industry leaders are participating. North America rapid control over the high-end market sector, especially in advanced sensors, includes the production of magnetometers, 3D sensing, image stabilization, and VR/AR features. The components are also very crucial to the production of the high-end of all companies in the North America area. For example, Apple, in Cupertino, California, uses cutting-edge sensor technologies in its iPhones product line, which is the main selling equipment of the company. Moreover, it uses advanced 3D sensing to make the Face ID and AR apps that are found in its equipment. Similarly, in San Diego, California, Qualcomm also contributes meaningfully in producing advanced sensors and chipsets that enhance better smartphones with advanced features. Texas Instruments is also a significant contributor to the advanced sensors made in North America. North America has been expanding the industry of the smartphone sensor rapidly because it has the affinity for technological devices. Moreover, the North America region also has an increasing need to utilize its smartphone features. The research is mainly because of its high demand for technological devices generated, which is fuelled by the need to control a specific market sector. The regional control also shows a larger pattern because all the companies in the North America region are using advanced sensor technology. The companies are also to determine new controlling methods for their reduction in demand that influences the market trend in the world.
Asia Pacific is the second fastest growing region in smart phone sensor market with 29 % of share in 2023. This strong presence of the area is driven by the increasing amount of smartphone manufacturing companies and consumers of the product. The key players in this domination are China, Japan, South Korea, and India. China has large manufacturing capacities and the world’s leading and most significant sensor companies in the market – Huawei, Xiaomi, and Oppo. These developers are making sensors suitable for the add-on features to smartphones on the market. Meanwhile, South Korea has major semiconductor manufacturers Samsung and LG. South Korea stands out with the prompt use of sensor technologies and support for all the advancements in sensor technology with the premium manufacturing of smartphones. The growth of the Asia-Pacific smartphone sensor market is driven by considerable investments in research and development and technological advancements. Developing this type of market is based on the high demand for smartphones in the area. Particularly, increased urbanization creates demand for advanced electronic devices of which smartphones are at the top of the list. The population’s growth of young individuals and the development of the middle class in the region is causing a boom in the use of smartphones. At the same time, all the markets located in Asia-Pacific together are the most significant contributors to the export of smartphones globally. China leads in the export of products while this country is followed by Vietnam, Hong Kong, South Korea, and India. Meanwhile, Hong Kong and Japan together have significant share of imports, which are led by the United States. This pattern of the global interaction between importing and exporting improves the importance in the worldwide market of Asia-Pacific, affecting the supply chain of sensors and facilities for the market of this kind of product. Therefore, the presence of consumers, manufacturing, and technology make this region a dominant force in the global Smartphone Sensors market meaning it drives the future growth and trends in the industry.
KEY PLAYERS:
The key players in the smartphone sensors market are Epson Europe Electronics, DYNA IMAGE Corporation, NEXT Biometrics, Samsung Electronics, Panasonic Corporation, Everlight Electronics, Maxim Integrated, Omron Corporation, Sony Corporation, STMicroelectronics & Other Players.
RECENT DEVELOPMENT
-
Feb 26 2024, Sony launches Alpha 9 III, world's first full-frame image sensor camera with a global shutter system Next generation Alpha 9 III captures all decisive moments with up to 120 frames per second high-speed shooting, distortion-free and blackout-free images, flash sync at all shooting speeds and much more
-
January 17, 2023 Samsung Introduces the 200-Megapixel Image Sensor for the Ultimate High Resolution Experience in Flagship Smartphones
-
Qualcomm (June 2024): Qualcomm unveiled its latest Snapdragon 8 Gen 3 processor, which includes integrated support for advanced camera sensors and machine learning capabilities. This new processor is expected to enhance the performance of smartphone cameras by improving image processing and enabling advanced features such as real-time object recognition.
-
Apr 182024, STMicroelectronics extends edge-AI sensor family with inertial module for intensive movement analysis Enables longer battery runtime in wearables, trackers, and activity monitoring
| Report Attributes | Details |
|---|---|
| Market Size in 2023 | USD 83.59 Billion |
| Market Size by 2032 | USD 367.94 Billion |
| CAGR | CAGR of 17.9% From 2024 to 2032 |
| Base Year | 2023 |
| Forecast Period | 2024-2032 |
| Historical Data | 2020-2022 |
| Report Scope & Coverage | Market Size, Segments Analysis, Competitive Landscape, Regional Analysis, DROC & SWOT Analysis, Forecast Outlook |
| Key Segments |
|
| Regional Analysis/Coverage | North America (US, Canada, Mexico), Europe (Eastern Europe [Poland, Romania, Hungary, Turkey, Rest of Eastern Europe] Western Europe] Germany, France, UK, Italy, Spain, Netherlands, Switzerland, Austria, Rest of Western Europe]), Asia Pacific (China, India, Japan, South Korea, Vietnam, Singapore, Australia, Rest of Asia Pacific), Middle East & Africa (Middle East [UAE, Egypt, Saudi Arabia, Qatar, Rest of Middle East], Africa [Nigeria, South Africa, Rest of Africa], Latin America (Brazil, Argentina, Colombia, Rest of Latin America) |
| Company Profiles | Epson Europe Electronics, DYNA IMAGE Corporation, NEXT Biometrics, Samsung Electronics, Panasonic Corporation, Everlight Electronics, Maxim Integrated, Omron Corporation, Sony Corporation, and STMicroelectronics. |
| Key Drivers |
|
| RESTRAINTS |
|
Frequently Asked Questions
The North America region with the Highest Revenue share in 2023.
The High-end segment is leading in the market revenue share in 2023.
The Asia-Pacific region is anticipated to record the Fastest Growing in the Smartphone Sensors Market.
The expected CAGR of the global Smartphone Sensors Market during the forecast period is 17.9%.
The Smartphone Sensors Market was valued at USD 83.59 billion in 2023.
Get in Touch
