Cross-Border B2C E-Commerce Market Report Scope & Overview:
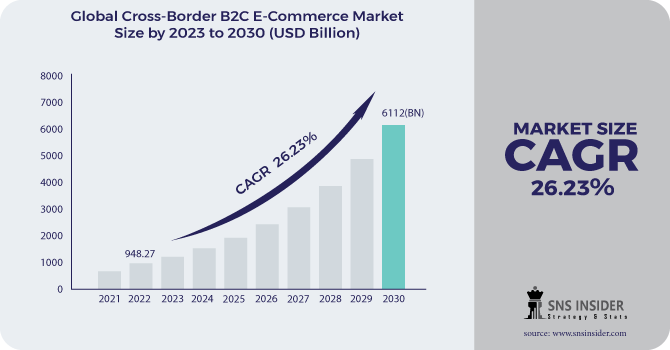
The Cross-Border B2C E-Commerce Market size was valued at USD 948.27 Bn in 2022 and is expected to reach USD 6112 Bn by 2030 and grow at a CAGR of 26.23% over the forecast period 2023-2030.
B2C cross-border E-Commerce may be described as E-Commerce trading over international boundaries, which entails purchasing and selling things via online storefronts across international and national borders. A transaction organization that operates in two or more nations is involved. The enterprises do business and distribute items utilizing cross-border B2C logistics on the E-Commerce platform.
To Get More Information on Cross-Border B2C E-Commerce Market - Request Sample Report
Internet information technology underpins cross-border B2C E-Commerce. As a result, it expands enterprises' expanding networks, performs paperless transactions, and eliminates downtime obstacles. Increased international commerce across nations, along with an increase in industry mergers and acquisitions, is expected to create lucrative industry growth prospects. However, logistics-related challenges such as import rules, return logistics, long delivery times, and high shipping costs are projected to stymie the expansion of the cross-border B2C E-commerce business.
MARKET DYNAMICS
KEY DRIVERS
-
An increase in the number of young metropolitan residents who rely significantly on technology.
-
An increase in the number of young metropolitan residents who rely significantly on technology.
-
The availability of higher-quality items at lower prices is propelling the industry's expansion.
RESTRAINTS
-
Data safety is a concern.
-
A lack of awareness of digital adoption.
OPPORTUNITY
-
The growing worldwide digital adoption index is expected to generate enormous industrial growth prospects.
-
The region's digital adoption is measured across many sectors of the economy, including government, people, and industry.
IMPACT OF COVID-19
The COVID-19 epidemic has had an impact on a variety of businesses throughout the world. To limit the pandemic's rapid spread, governments throughout the world enacted severe lockdown measures and social distance standards. During the early phases of the pandemic, manufacturing facilities throughout the world were shut down. Furthermore, the post-pandemic economic crisis may cause a major delay in the commercial roll-out of the Cross-Border B2C E-Commerce service business. Small and medium-sized businesses are the backbone of technology providers, and their income has dropped precipitously since the pandemic's appearance in 2020. As a result of supply chain interruptions, industry participants faced several hurdles. However, when additional supplies become available in the second half of 2022, things will improve.
MARKET ESTIMATION
Credit/debit cards are predicted to hold the largest share in 2021 and to dominate the cross-border B2C E-commerce sector in the next years. The acceptance of credit/debit card payments across all E-Commerce platforms accounts for a sizable part of the category. Furthermore, technical improvements such as the adoption of blockchain for improved security are expected to drive category expansion. The multitude of special privileges and bonuses earned by using credit cards is expected to increase the amount paid using this method.
The digital wallets category is expected to develop at the quickest rate in the coming years. The introduction of cross-border B2C payment platforms is expected to propel the segment's growth. Furthermore, the increasing number of non-bank competitors is expected to provide enormous cross-border B2C E-commerce industry development prospects.
KEY SEGMENTS
On The Basis of Category
-
Entertainment & Education
-
Apparel & Accessories
-
Home Furnishing
-
Personal Care & Beauty
-
Healthcare & Nutrition
-
Footwear
-
Food & Beverage
-
Others
On The Basis of Payment Method
-
Digital Wallets
-
Credit/Debit Cards
-
Internet Banking
-
Others
On The Basis of Offering
-
In-House Brands
-
Assorted Brands
On The Basis of End-user
-
Adults
-
Teenagers/Millennials
-
Senior Citizens
-
Others
.png)
Do You Need any Customization Research on Cross-Border B2C E-Commerce Market - Inquire Now
REGIONAL ANALYSIS
In 2021, Asia Pacific will account for the greatest revenue share of the worldwide cross-border B2C E-commerce market. This massive industry share can be attributable to rising internet and smartphone usage in emerging markets. Furthermore, the industry's expansion is being fueled by increased urbanization, rising living standards, and rising disposable income. The existence of a huge customer base in the Asia Pacific is expected to fuel market expansion. Furthermore, the region's developing trade links are expected to provide substantial market growth potential. Furthermore, the North America Cross-Border B2C E-Commerce industry is expected to rise steadily in the next years. The rapidly expanding market in North America can be attributable to the rising demand for high-quality items at reasonable prices. The lack of items at lower prices in the domestic market is expected to boost market expansion. Furthermore, the region's massive internet-purchasing client base is likely to provide enormous market growth prospects. Because of the reduced prices, most US customers choose to buy from China.
REGIONAL COVERAGE:
-
North America
-
USA
-
Canada
-
Mexico
-
-
Europe
-
Germany
-
UK
-
France
-
Italy
-
Spain
-
The Netherlands
-
Rest of Europe
-
-
Asia-Pacific
-
Japan
-
south Korea
-
China
-
India
-
Australia
-
Rest of Asia-Pacific
-
-
The Middle East & Africa
-
Israel
-
UAE
-
South Africa
-
Rest of Middle East & Africa
-
-
Latin America
-
Brazil
-
Argentina
-
Rest of Latin America
-
KEY PLAYERS
The major players are Alibaba/AliExpres, Amazon, ASOS, eBay, iHerb, Joom, Lazada, Pinduoduo, Shein, Shopee & Other Players
Amazon-Company Financial Analysis
| Report Attributes | Details |
|---|---|
| Market Size in 2022 | US$ 948.27 Billion |
| Market Size by 2030 | US$ 6112 Billion |
| CAGR | CAGR 26.23% From 2023 to 2030 |
| Base Year | 2022 |
| Forecast Period | 2023-2030 |
| Historical Data | 2020-2021 |
| Report Scope & Coverage | Market Size, Segments Analysis, Competitive Landscape, Regional Analysis, DROC & SWOT Analysis, Forecast Outlook |
| Key Segments | • by Category (Entertainment & Education, Apparel & Accessories, Consumer Electronics, Home Furnishing, Personal Care & Beauty, Healthcare & Nutrition, Footwear, Food & Beverage, Others) • by Payment Method (Digital Wallets, Credit/Debit Cards, Internet Banking, Others) • by Offering (In-House Brands and Assorted Brands) • by End-user (Adults, Teenagers/Millennials, Senior Citizens, Others) |
| Regional Analysis/Coverage | North America (USA, Canada, Mexico), Europe (Germany, UK, France, Italy, Spain, Netherlands, Rest of Europe), Asia-Pacific (Japan, South Korea, China, India, Australia, Rest of Asia-Pacific), The Middle East & Africa (Israel, +D11UAE, South Africa, Rest of Middle East & Africa), Latin America (Brazil, Argentina, Rest of Latin America) |
| Company Profiles | Alibaba/AliExpres, Amazon, ASOS, eBay, iHerb, Joom, Lazada, Pinduoduo, Shein, Shopee |
| Key Drivers | •An increase in the number of young metropolitan residents who rely significantly on technology. •The availability of higher-quality items at lower prices is propelling the industry's expansion. |
| Market Restraints | •Data safety is a concern. •A lack of awareness of digital adoption. |
Frequently Asked Questions
Ans: - Key Stakeholders Considered in the study are Raw material vendors, Regulatory authorities, including government agencies and NGOs, Commercial research, and development (R&D) institutions, Importers and exporters, etc.
Ans: - The major key players are Alibaba/AliExpres, Amazon, ASOS, eBay, iHerb, Joom, Lazada, Pinduoduo, Shein, Shopee.
Ans: - Asia Pacific will account for the greatest revenue share of the worldwide cross-border B2C E-commerce market.
Ans: - Data safety is a concern and a lack of awareness of digital adoption.
Ans: - The estimated market size for the Cross-Border B2C E-Commerce market for the year 2028 is USD3853.33 Bn.
Get in Touch
