Running Gear Market Size & Trends Analysis:
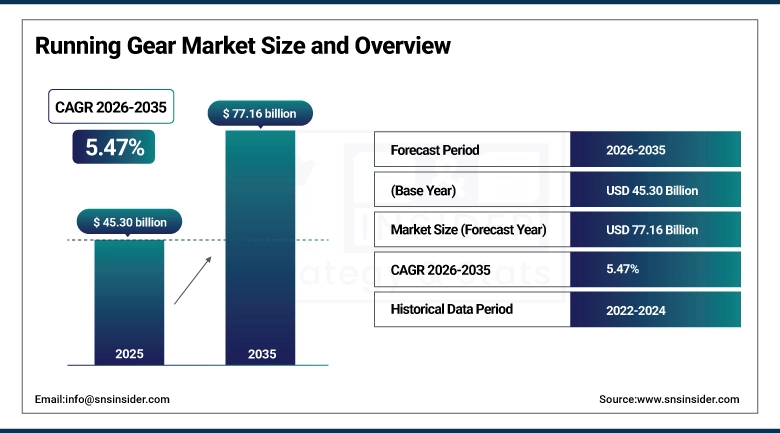
The Running Gear Market size was valued at USD 45.30 billion in 2025 and is expected to reach USD 77.16 billion by 2035, growing at a CAGR of 5.47% over the forecast period of 2026-2035.
Running Gear Market trends are shifting toward smart wearables, sustainable materials, and gender-inclusive designs. E-commerce and personalized products are accelerating demand. Growing awareness of health and fitness has driven people to participate more and more in marathons and running events abroad, which in turn is contributing to the growth of the global running gear market. Market growth is also aided by the increased demand for smart wearables and high-tech running shoes. Also, the sustainability of consumers for fashionable, utility aimed & performance-oriented apparel is propelling the innovations.
Running Gear Market Size and Growth Forecast:
-
Market Size in 2025: USD 45.30 Billion
-
Market Size by 2035: USD 77.16 Billion
-
CAGR: 5.47% from 2026 to 2035
-
Base Year: 2025
-
Forecast Period: 2026–2035
-
Historical Data: 2022–2024
To Get more information on Running Gear Market - Request Free Sample Report
Key Trends in the Running Gear Market:
-
Rising demand for high-performance running shoes and gear driven by increasing participation in recreational and professional running activities.
-
Growing adoption of advanced materials and cushioning technologies to enhance comfort, durability, and injury prevention.
-
Increasing focus on lightweight, breathable, and ergonomically designed footwear to improve running efficiency and user experience.
-
Expansion of smart and wearable running devices, including fitness trackers, smart insoles, and connected shoes, for performance monitoring and health tracking.
-
Rising popularity of sustainable and eco-friendly running gear, leveraging recycled materials and environmentally responsible manufacturing practices.
-
Higher investment by sportswear brands in research and development for innovative running gear, including motion analysis and biomechanical optimization.
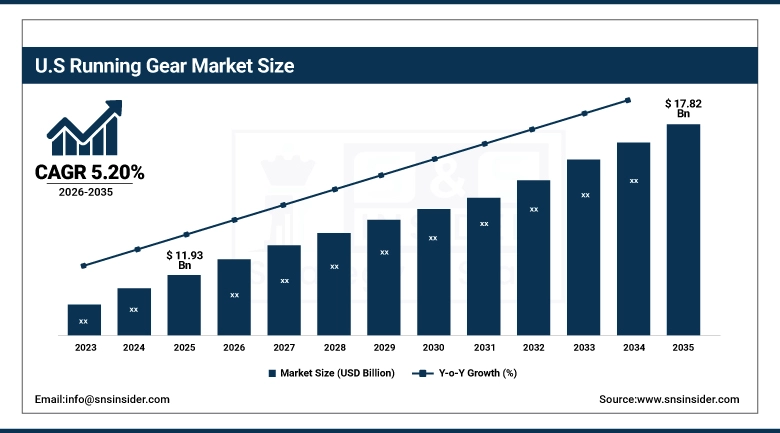
U.S. Running Gear Market Size Outlook:
The U.S. Running Gear Market size was valued at USD 11.93 billion in 2025 and is expected to reach USD 17.82 billion by 2035, growing at a CAGR of 5.20% over the forecast period of 2026-2035. The U.S. Running Gear Market is growing due to rising health consciousness, marathon participation, smart wearable devices, e-commerce growth, and consumer demand for sustainable and performance-driven athletic wear and running gear.
Running Gear Market Drivers:
-
Health Awareness and Fitness Culture Drive Global Demand for Innovative and Stylish Running Gear Products
Rising consciousness regarding health and a broader fitness culture across every age group is the primary factor behind the global running gear market growth. Demand for high-performance footwear, apparel, and accessories is bolstered by increasing participation across marathons, every day running, and fitness events. Improvements in smart wearables like fitness trackers and GPS-enabled devices allow for better user interactions and tracking. Moreover, the growing trend of athleisure wear and functional fashion is increasing the need for products that combine style with utility.
The 2024 New York City Marathon shattered previous records with 55,646 finishers, highlighting surging interest in long-distance running especially among younger adults
Running Gear Market Restraints:
-
Product Saturation and Counterfeit Goods Pose Major Challenges for Global Running Gear Market Expansion
Product saturation in mature markets, wherein consumers already own a number of items such as a fitness tracker or running shoes, is one of the major restraints in the global running gear market. This results in longer replacement cycles and lower demand for more frequent purchases. In price-sensitive markets, the presence of counterfeit goods and unregulated online sellers dilute both brand equity and consumer trust.
Running Gear Market Opportunities:
-
Ecommerce Growth and Personalization Create New Opportunities for Running Gear Brands in Emerging Global Markets
Franchises have great opportunities to expand in the growing e-commerce platforms as well as in direct-to-consumer sales models, particularly in developing countries. And there is a huge opportunity for brands to invest in sustainable materials, personalized gear and inclusive designs tailored to various consumer segments. These also are excellent avenues for visibility and consumer interaction through strategic influencer marketing and digital fitness platforms.
Influencer-led campaigns boosted engagement by 13% among Gen Z consumers in 2023–2024, and micro‑influencers (10k–100k followers) were found to deliver ~30% higher ROI and ~3.9% engagement rates, compared to larger creators
Running Gear Market Challenges:
-
Balancing Innovation Performance Sustainability and Style Presents Ongoing Challenges for Running Gear Manufacturers Worldwide
It continues to be a struggle for manufacturers to keep innovating with regard to performance, sustainability and cosmetics. Long-term research & development is necessary to create materials that balance durability, comfort, and environmental sustainability. Furthermore, changing customer preferences around things like cross-use apparel (eg yoga pant for gym, fitness for casual wear) require brands to constantly adapt to changing demands making it difficult to maintain regular product cycle and supply chain orders.
Running Gear Market Segmentation Analysis:
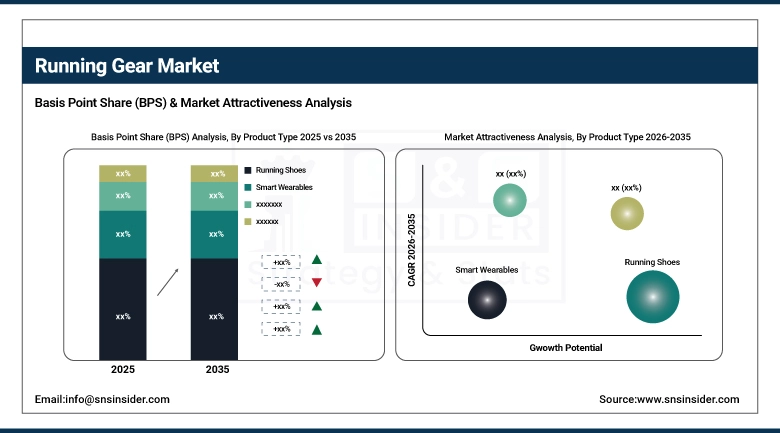
By Product Type, Running Shoes Segment Dominates Running Gear Market with 51.7% Share in 2025, Smart Wearables to Record Fastest Growth
The Running Shoes segment had the highest share at about 51.7% in 2025, which is attributed to the large number of recreational and professional runners who use running shoes. The rapid improvements in cushioning, motion control, light-weight and injury-prevention technologies have established running shoes as the core product category in the running shoe industry. Market leadership undergirded by growing fitness awareness and powerful retail and e-commerce penetration of key brands.
Smart Wearables will be the fastest growing segment, driven by fitness, GPS and biometrics technologies adoption between 2026-2035 The user experience is improved with integration with mobile apps and running ecosystems, motivating consumers willing to pay extra for tech-savvy and health-conscious running gear to upcycle to integrated gear.
By Consumer Group, Men Segment Dominates Running Gear Market with 40.4% Share in 2025, Women Segment to Record Fastest Growth
In 2025, the Men's category was the most prominent, having accounted for a 40.4% share, which was primarily driven by greater attendance at marathons and fitness classes, as well as involvement in performance sports. Meanwhile, brands have traditionally designed high-performance footwear, clothing and smart accessories for male consumers, continuing sales through reliable volume and stylised product offerings.
The Women’s segment is projected to grow at the fastest rate of CAGR during the period between 2026 to 2035 attributed to the growing number of female participants in organized runs, wellness-based events and fitness challenges. Brands are developing products marketed to women focusing on fit, comfort, and performance; while inclusive advertising and targeted marketing strategies create ongoing momentum.
By Distribution Channel, Online Segment Dominates Running Gear Market with 38.4% Share in 2025 and Records Fastest Growth
In 2025, a 38.4% market share was held by the Online segment for its convenience, large product offering and slew of exclusive online launches. Features like virtual try-ons, AI-based suggestions, and customized shopping experiences increase consumer interaction. Based on the end-user, the Online segment is expected to grow with the fastest CAGR during the forecast period of 2026–2035 as the consumers are digital-first, tech-savvy, and fitness seekers.
By End User/Usage, Recreational Runners Segment Dominates Running Gear Market with 36.3% Share in 2025, Fitness Enthusiasts to Record Fastest Growth
Due to the large adoption of running as a daily fitness activity for wellness, stress relief, and general health, the share of the total market for Recreational Runners and Joggers was 36.3% in 2025. One reason running is such a common fitness form is that it requires minimal equipment, and running gear is relatively inexpensive and widely available.
Over the period from 2026–2035, the fastest growth is expected in the Fitness Enthusiasts segment, as consumers include running into multi-disciplinary training regimens such as HIIT and gym exercises and cross-training exercises. The increasing need for multifunctional smart, tech-interfacing, and performance-oriented goods drives their adoption; due to which brands are working on smart wearables and multi-functional wearable garments.
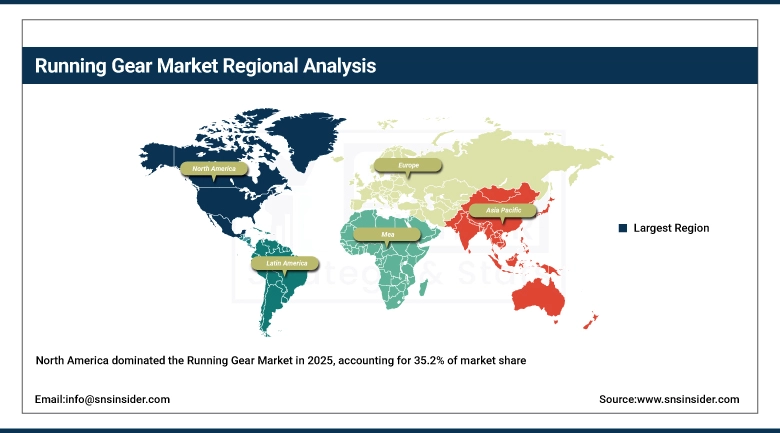
Running Gear Market Regional Insights:
North America Dominates Running Gear Market in 2025
In 2025, the running gear market in North America represents around 35.2% of the total market, thanks to the well-established fitness culture, high disposable income, and strong brand presence. The region has access to advanced retail infrastructure, smart wearables adoption, and marathon and wellness program participation. The consumers in North America display a strong affinity for performance, style, and innovation, which helps in upgrading the products and purchasing high-end gear.
The United States led the North American market, fueled by high fitness participation, strong e-commerce penetration, and dominant sportswear brands catering to both performance and lifestyle needs.
Get Customized Report as per Your Business Requirement - Enquiry Now
Asia-Pacific is the Fastest-Growing Region in the Running Gear Market
The Asia-Pacific market is expected to register the fastest growth rate during the forecast period from 2026 to 2035, due to the growing urban population, rising awareness about health, and the increasing middle-class population. The region is undergoing rapid digitalization, the e-commerce sector is growing, and the popularity of health-oriented social media platforms is fueling the demand for the product. Sports events, government health programs, and the popularity of athleisure wear are also promoting people to buy smart running gear.
The Asia-Pacific running gear market is a highly concentrated market and China whose big population, fast urban fitness trends adoption, biggest penetration of e-commerce, and strengthen of domestic and international marathon activities dominates the Asia-Pacific running gear market.
Europe Running Gear Market Insights, 2025
Europe is also a highly developed and health-focused market for running gear and running shoes worldwide, supported by a high number of marathon and trail running events and a high interest in holistic lifestyle activities. Demand for high quality, durable, and high-performance products continues in the region as consumers appreciate quality, sustainability, and performance, contributing to sustainability and premium segments. Strong concentration of sports infrastructure, government assistance programs, and rising demand for athleisure bolsters the growth of the market.
With consumer bases that are both engaged and fitness-oriented, Germany, the United Kingdom, and France lead in regional consumption with strong support from online and offline retail channels.
Middle East & Africa and Latin America Running Gear Market Insights
The Middle East & Africa (MEA) and Latin America regions are emerging markets for running gear, exhibiting steady growth driven by rising fitness awareness and youth-focused sports culture. Urbanization, increased access to online retail, and government wellness initiatives are fueling demand.
In Latin America, countries such as Brazil and Mexico benefit from a growing middle class and increasing interest in local running events. Meanwhile, the Middle East & Africa region is witnessing rising demand for branded, performance-oriented gear amid expanding fitness infrastructure and wellness programs.
Top Running Gear Companies are:
-
Nike, Inc.
-
ASICS Corporation
-
Puma SE
-
Under Armour, Inc.
-
New Balance Athletics, Inc.
-
Hoka One One (Deckers Brands)
-
Skechers USA, Inc.
-
Saucony (Wolverine World Wide, Inc.)
-
Salomon Group
-
Mizuno Corporation
-
Lululemon Athletica Inc.
-
The North Face (VF Corporation)
-
Reebok (Authentic Brands Group)
-
Altra Running
-
Decathlon S.A.
-
361 Degrees International Limited
-
Garmin Ltd.
-
Polar Electro Oy
Competitive Landscape of Running Gear Market:
Nike, Inc.
Nike, Inc. is a U.S.-based global leader in sportswear and running gear, offering high-performance footwear, apparel, and accessories for recreational and professional runners. The company specializes in advanced cushioning technologies, lightweight materials, and wearable innovations that enhance running efficiency, comfort, and injury prevention. Nike’s role in the running gear market is vital, providing premium products that drive consumer engagement and brand loyalty across both casual and competitive runners.
-
In 2024, Nike introduced the latest Air Zoom Alphafly NEXT% 2 and React Infinity Run Flyknit 3, combining advanced cushioning, motion control, and durable materials to optimize performance for marathon and long-distance runners.
Adidas AG
Adidas AG is a Germany-based global sportswear and running gear manufacturer, recognized for its technologically advanced footwear and apparel. The company focuses on responsive cushioning, breathable fabrics, and sustainable manufacturing practices to meet the needs of fitness enthusiasts and professional athletes. Adidas plays a key role in the running gear market by offering innovative performance-driven solutions that enhance endurance, comfort, and energy return for runners.
-
In 2024, Adidas launched the Adizero Adios Pro 3 and Ultraboost 22 series, integrating Lightstrike Pro cushioning and energy-return technologies to improve running efficiency and reduce fatigue for long-distance athletes.
ASICS Corporation
ASICS Corporation is a Japan-based leader in running shoes and performance gear, specializing in products that optimize biomechanics, stability, and comfort for runners of all levels. The company leverages proprietary GEL cushioning, FlyteFoam midsole technology, and ergonomically designed footwear to reduce injury risk and improve running performance. ASICS’ role in the running gear market is significant, supporting both recreational runners and elite athletes with science-backed innovations.
-
In 2024, ASICS introduced the METASPEED Sky+ and GEL-KAYANO 29, enhancing energy efficiency, cushioning, and personalized fit to meet the needs of marathon runners and daily fitness enthusiasts.
Puma SE
Puma SE is a Germany-based multinational sportswear and athletic gear manufacturer, providing high-quality running shoes, apparel, and smart wearables. The company focuses on combining performance, style, and affordability in its running gear, integrating lightweight materials, responsive cushioning, and flexible designs to enhance user experience. Puma’s role in the running gear market is notable, offering innovative products for both casual runners and competitive athletes.
-
In 2024, Puma launched the Deviate Nitro Elite and Velocity Nitro 2, featuring Nitro foam cushioning, enhanced propulsion, and ergonomic designs aimed at improving running efficiency and comfort across various terrains.
| Report Attributes | Details |
|---|---|
| Market Size in 2025 | USD 45.30 Billion |
| Market Size by 2035 | USD 77.16 Billion |
| CAGR | CAGR of 5.47% From 2026 to 2035 |
| Base Year | 2025 |
| Forecast Period | 2026-2035 |
| Historical Data | 2022-2024 |
| Report Scope & Coverage | Market Size, Segments Analysis, Competitive Landscape, Regional Analysis, DROC & SWOT Analysis, Forecast Outlook |
| Key Segments | • By Product Type (Running Shoes, Running Apparel (T-shirts, shorts, leggings, jackets), Smart Wearables (fitness trackers, smartwatches), Accessories (headbands, water bottles, running belts, compression gear)) • By Consumer Group (Men, Women, Kids / Youth, and Unisex) • By Distribution Channel (Online (Brand websites, E-commerce platforms), Offline (Specialty Sports Stores, Department Stores, Hypermarkets/Supermarkets), Direct-to-Consumer (DTC) Stores, and Third-party Retailers) • By End User / Usage (Professional Athletes, Recreational Runners / Joggers, Fitness Enthusiasts, and Marathon Participants / Race Day Users) |
| Regional Analysis/Coverage | North America (US, Canada, Mexico), Europe (Germany, France, UK, Italy, Spain, Poland, Turkey, Rest of Europe), Asia Pacific (China, India, Japan, South Korea, Singapore, Australia, Taiwan, Rest of Asia Pacific), Middle East & Africa (UAE, Saudi Arabia, Qatar, South Africa, Rest of Middle East & Africa), Latin America (Brazil, Argentina, Rest of Latin America) |
| Company Profiles | Nike, Adidas, Puma, ASICS, Under Armour, New Balance, Skechers, Brooks, Mizuno, Columbia, Reebok, HOKA, Decathlon, Salomon, Saucony, Lululemon, The North Face, Garmin, Polar, and Fitbit. |
Get in Touch
