SGLT2 Inhibitors Market Size Analysis:
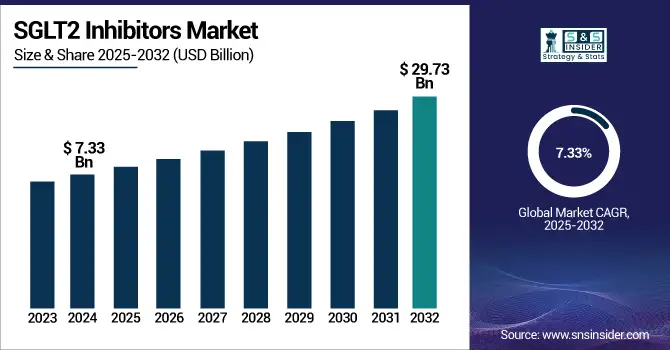
The SGLT2 Inhibitors Market size was valued at USD 16.90 billion in 2024 and is expected to reach USD 29.73 billion by 2032, growing at a CAGR of 7.33% over the forecast period of 2025-2032.
To Get more information on SGLT2 Inhibitors Market - Request Free Sample Report
The rising global type 2 diabetes burden and growing acceptance of novel medicines are driving the strong expansion of the SGLT2 inhibitors market. The International Diabetes Federation estimates that 783 million adults worldwide will have diabetes by 2045, which emphasizes the critical necessity of efficient treatment solutions. A major health concern in the U.S. is type 2 diabetes.
For instance, type 2 diabetes accounts for nearly 90% of all diabetics. The recent CDC statistics (2021–2023) show that around 15.8% of U.S. adults have diabetes; of these, 4.5% are undiagnosed cases and 11.3% are diagnosed cases. Men (18.0%) have a somewhat greater diabetes prevalence than women (13.7%). From 9.7% in 2000 to 15.8% in 2023, the prevalence of diabetes among American adults has surged.
Governments are reacting with more awareness campaigns and early diagnosis and management investments, therefore boosting the SGLT2 inhibitors market growth. The U.S. SGLT2 inhibitors market size was valued at USD 5.12 billion in 2024 and is expected to reach USD 8.96 billion by 2032 with a CAGR of 7.25%. Strong insurance coverage and healthcare infrastructure, as well as the FDA's enlarged approvals for SGLT2 inhibitor drugs in indications outside of diabetes, including heart failure and chronic renal disease, help to support this dominance. These government-backed projects and regulatory developments are key drivers influencing SGLT2 inhibitors market trends and supporting ongoing market expansion.
The SGLT2 inhibitors market analysis reveals that the market is characterized by significant technological developments, major R&D expenditure, and an increasing focus on complete disease management solutions.
SGLT2 Inhibitors Market Dynamics
Drivers
-
Rising Type 2 Diabetes and Cardiovascular Diseases Accelerate SGLT2 Inhibitor Demand Globally
The main driver behind the SGLT2 inhibitors market growth is the rising global load of type 2 diabetes and cardiovascular illnesses. With over 537 million people affected by diabetes in 2021 and projections indicating a rise to 783 million by 2045, the need for effective glycemic control therapies is surging. SGLT2 inhibitors were originally designed for the treatment of diabetes, showing great advantages in controlling chronic renal disease and lowering the risk of hospitalization for heart failure, hence extending their clinical relevance. Furthermore, boosting their inclusion into standard treatment procedures, the American Diabetes Association's 2025 recommendations support SGLT2 inhibitors as first-line therapy for type 2 diabetes with concomitant cardiovascular diseases.
Healthcare systems are progressively using SGLT2 inhibitors as a preferred therapeutic choice as aging populations, inactive lifestyles, and poor diets drive up the occurrence of these chronic diseases. As governments and health organizations give creative ideas top priority to solve the increasing social and financial weight of chronic diseases, this broad therapeutic influence guarantees continuous growth in both developed and developing markets.
Restraints
-
Safety Issues and Competition from Established Diabetes Treatments Restrict the SGLT2 Inhibitors Market Growth
The SGLT2 inhibitor market faces intense competition from other well-known groups of diabetic drugs, including metformin, sulfonylureas, DPP-4 inhibitors, and GLP-1 receptor agonists. Many healthcare professionals and payers choose these substitutes because they are often more reasonably priced and have a longer history of safety and effectiveness. Furthermore, discouraging prescribers and patients from using these newer treatments are worried about possible side effects of SGLT2 inhibitors, including urinary tract infections, dehydration, and rare but major hazards, including amputations. Particularly in markets needing large amounts of local clinical data, regulatory obstacles impede entrance and expansion and slow down the rate at which SGLT2 inhibitors can become accepted as a standard of care.
SGLT2 Inhibitors Market Segmentation Analysis
By Drug
The Jardiance (empagliflozin) segment dominated the SGLT2 inhibitors market with a 51% global diabetes treatment market share in 2024 and is predicted to rise with a notable CAGR over the forecast period. Major clinical studies such as the EMPA-KIDNEY research, which revealed a 28% decrease in chronic kidney disease progression or cardiovascular death, have shown Jardiance's proven efficacy in lowering cardiovascular and renal risks, therefore attesting to this leadership. Regulatory approvals for the use of SGLT2 inhibitors in treating heart failure and chronic kidney disease driven by positive cardiovascular outcomes are further expanding their market reach.
Reflecting Jardiance's strong safety and effectiveness profile, the FDA and European Commission have extended the label to include pediatric type 2 diabetes and chronic renal disease.
For instance, the FDA approved Jardiance for children ten years of age and above with type 2 diabetes in June 2023, and in April 2022, Japan's PMDA approved its usage for heart failure with preserved ejection fraction.
By Indication
With 72% of the SGLT2 inhibitors market share in 2024, the Type 2 Diabetes segment led the market. Demand for efficient treatments has been spurred by the increasing diabetes prevalence, with around 783 million adults expected to be afflicted by 2045. Reflecting revised guidelines from the ADA, EASD, and ESC, SGLT2 inhibitors market trends suggest that these medications are given as first-line or add-on therapy for patients with high cardiovascular or renal risk, more and more. Early intervention and access to creative treatments are further supported by government programs such as the National Diabetes Prevention Program of the U.S. CDC.
The cardiovascular segment is expected to grow with the fastest CAGR in the SGLT2 inhibitors market growth over the forecast period. Driven by widening approvals for SGLT2 Inhibitors for Heart Failure and shown declines in major adverse cardiovascular events and heart failure hospitalizations.
For instance, in May 2023, the FDA approved Lexicon Pharmaceuticals sotagliflozin, a dual SGLT1/2 inhibitor, for heart failure, significantly advancing Cardiovascular Outcomes with SGLT2 Inhibitors.
The EMPA-KIDNEY trial and revised ESC recommendations have strengthened the case for SGLT2 inhibitors in treating chronic kidney disease and heart failure, therefore extending the Sodium-Glucose Cotransporter-2 Inhibitors Market beyond traditional diabetic treatment.
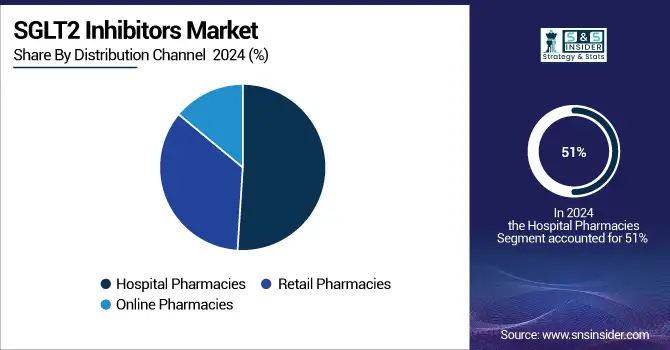
By Distribution Channel
Hospital pharmacies maintained a dominance with 51% of the SGLT2 inhibitors market share in 2024, reflecting the complexity of treatment demanded for patients with numerous comorbidities. Particularly for patients with advanced disease or those under careful observation, the SGLT2 inhibitors market analysis reveals that integrated care models in hospitals help to increase adoption rates by means of payment policies.
For instance, government initiatives in the U.S. and the United Kingdom guarantee coverage for SGLT2 inhibitors recommended in hospital environments, therefore generating ongoing demand.
The online pharmacies segment is expected to see the fastest CAGR of 7.89% over the forecast period. Driven by digital health use, telemedicine integration, and home delivery convenience, using digital health regulations, nations such as India are increasing access to SGLT2 inhibitors in rural and underdeveloped areas, therefore demonstrating how SGLT2 inhibitor firms are changing to fit changing patient demands and market dynamics. Rising e-prescriptions and virtual consultations should help this segment even more, particularly in the management of chronic diseases.
SGLT2 Inhibitors Market Regional Analysis
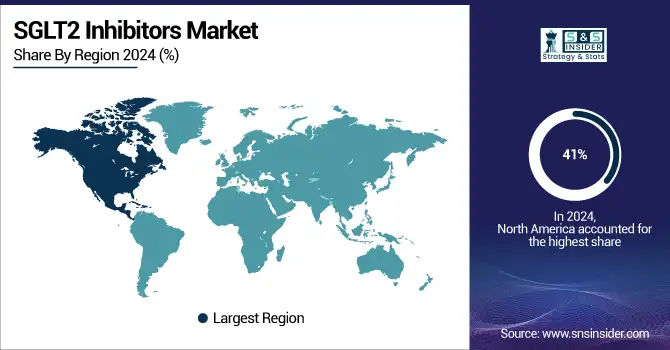
The North America region dominated the market, comprising 41% SGLT2 inhibitors share in 2024 and establishing industry norms for clinical adoption, pricing, and regulatory frameworks, driven by a great prevalence of type 2 diabetes, modern healthcare infrastructure, and early regulatory approvals for major SGLT2 inhibitor drugs, including Jardiance, Invokana, and Farxiga, the U.S. SGLT2 inhibitor market held the largest revenue share 74% of the NA region.
The growing awareness of the several advantages of SGLT2 inhibitors, including cardiovascular and renal protection, which have been included in the American Diabetes Association recommendations and generally embraced by doctors, drives this growth. With local healthcare systems and payment policies influencing adoption patterns, Canada and the rest of North America also make significant contributions.
With a CAGR of 7.86%, the Asia Pacific region is the fastest-growing region throughout the forecast period. Particularly in major nations such as China and India, the fast economic development, urbanization, and lifestyle changes in these areas have resulted in an explosion in type 2 diabetes incidence. With approximately 414 million Asians aged 65 and over in 2020, the figure is estimated to reach 1.2 billion by 2060; the aging population is a major factor. SGLT2 inhibitors, among other advanced diabetic medications, are in more demand due to this demographic change. Early diagnosis, preventive care, and better access to creative medicines are aggressively pushed by governments and healthcare institutions across the Asia Pacific.
The global SGLT2 inhibitors market held a significant share of the European region. Rising type 2 diabetes prevalence, an aging population, and a better knowledge of the cardiovascular and renal benefits of SGLT2 inhibitor drugs drive the substantial growth of the market. Supported by sophisticated healthcare infrastructure and advantageous reimbursement regulations, Western Europe, especially Germany and France, owns the highest market share. Following changing clinical guidelines, the area is seeing rising acceptance of SGLT2 inhibitors, including Invokana, Jardiance, and Farxiga, for heart failure and chronic renal disease, in addition to diabetes control.
Latin America, the Middle East, and Africa (LAMEA) are experiencing steady SGLT2 inhibitors market growth, albeit from a smaller base. Rising knowledge of diabetes and cardiovascular disease, better access to healthcare, and deliberate government projects help these areas. Rising adoption rates are being driven, for instance, by Saudi Arabia's cardiovascular health programs and Brazil's diabetes awareness campaign.
Get Customized Report as per Your Business Requirement - Enquiry Now
SGLT2 Inhibitors Market Key Players
The key SGLT2 inhibitor companies are Boehringer Ingelheim International GmbH, Sanofi, AstraZeneca, TheracosBio, LLC, Merck & Co., Inc., TheracosBio, LLC, Glenmark Pharmaceuticals Ltd., Lexicon Pharmaceuticals, Inc., Eli Lilly and Company, Johnson & Johnson Services, Inc., Bristol-Myers Squibb Company, and others.
Recent Developments in the SGLT2 Inhibitors Market
-
The Phase 3 EMPACT-MI trial of Boehringer Ingelheim International GmbH revealed in April 2024 that Jardiance (empagliflozin) lowered the risk of hospitalization for heart failure by 10%, an outcome expected to influence future demand for the medication.
-
The first dual SGLT1/2 inhibitor, sotagliflozin, was approved by the FDA for heart failure in May 2023, so underlining the growing importance of SGLT2 inhibitors in cardiovascular treatment.
-
Eli Lilly and Boehringer Ingelheim said in September 2023 that U.S. FDA approval for Jardiance based on its efficacy in reducing the risk of cardiovascular death and hospitalization resulting from chronic kidney disease (CKD) has been granted.
| Report Attributes | Details |
|---|---|
| Market Size in 2024 | USD 16.9 Billion |
| Market Size by 2032 | USD 29.73 Billion |
| CAGR | CAGR of 7.33% From 2025 to 2032 |
| Base Year | 2024 |
| Forecast Period | 2025-2032 |
| Historical Data | 2021-2023 |
| Report Scope & Coverage | Market Size, Segments Analysis, Competitive Landscape, Regional Analysis, DROC & SWOT Analysis, Forecast Outlook |
| Key Segments | • By Indication (Chronic Kidney Disease (CKD), Type 2 Diabetes, Cardiovascular, and Others) • By Drug (Jardiance (Empagliflozin), Inpefa (Sotagliflozin), Farxiga (Dapagliflozin), Invokana (Canagliflozin), Qtern (Dapagliflozin/Saxagliptin), and Others) • By Distribution Channel (Retail Pharmacies, Hospital Pharmacies, and Online Pharmacies) |
| Regional Analysis/Coverage | North America (US, Canada, Mexico), Europe (Germany, France, UK, Italy, Spain, Poland, Turkey, Rest of Europe), Asia Pacific (China, India, Japan, South Korea, Singapore, Australia, Rest of Asia Pacific), Middle East & Africa (UAE, Saudi Arabia, Qatar, South Africa, Rest of Middle East & Africa), Latin America (Brazil, Argentina, Rest of Latin America) |
| Company Profiles | Boehringer Ingelheim International GmbH, Sanofi, AstraZeneca, TheracosBio, LLC, Merck & Co., Inc., TheracosBio, LLC, Glenmark Pharmaceuticals Ltd., Lexicon Pharmaceuticals, Inc., Eli Lilly and Company, Johnson & Johnson Services, Inc., Bristol-Myers Squibb Company |
Frequently Asked Questions
Ans: The Hospital Pharmacies segment dominated the SGLT2 Inhibitors Market.
Ans: Safety issues and competition from established diabetes treatments restrict the growth of the SGLT2 inhibitors market
Ans. The CAGR of the SGLT2 Inhibitors Market is 7.33% during the forecast period of 2025-2032.
Ans: The North America region dominated the SGLT2 Inhibitors Market in 2024.
Ans. The projected market size for the SGLT2 Inhibitors Market is USD 29.73 billion by 2032.
Get in Touch
