Power Semiconductor Market Report Scope & Overview:
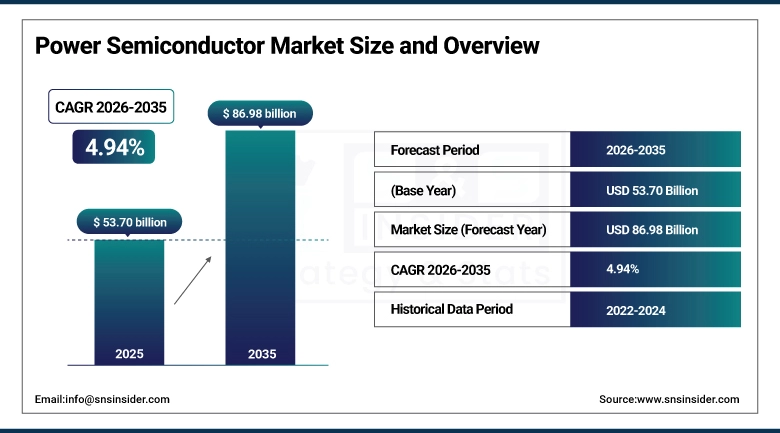
The Power Semiconductor Market size was valued at USD 53.70 Billion in 2025 and is projected to reach USD 86.98 Billion by 2035, growing at a CAGR of 4.94% during 2026–2035.
The Power Semiconductor Market is driven by factors such as the increased rate of adoption of electric vehicles, which need efficient power management systems, and the increased rate of deployment of renewable energy sources such as solar and wind power. The increased need for energy-efficient consumer electronics and industrial automation also contributes to the growth of the market. Furthermore, the growth of data centers and 5G technologies increases the need for power consumption, thereby promoting the need for advanced semiconductor devices.
Power Semiconductor Market Size and Growth Forecast:
-
Market Size in 2025: USD 53.70 Billion
-
Market Size by 2035: USD 86.98 Billion
-
CAGR: 4.94% during 2026–2035
-
Base Year: 2025
-
Forecast Period: 2026–2035
-
Historical Data: 2022–2024
To Get more information on Power Semiconductor Market - Request Free Sample Report
Power Semiconductor Market Key Trends:
-
Increasing adoption of electric vehicles is driving strong demand for efficient power semiconductors used in traction inverters, onboard chargers, and battery management systems.
-
Rising deployment of renewable energy systems such as solar and wind is accelerating the need for high-performance power devices for energy conversion and grid integration.
-
Advancements in wide bandgap materials like SiC and GaN are enhancing efficiency, thermal performance, and power density across various applications.
-
Growing demand for energy-efficient consumer electronics and appliances is boosting the integration of compact and high-efficiency power semiconductor components.
-
Expansion of data centers and 5G infrastructure is increasing power consumption requirements, driving demand for reliable and high-performance power management solutions.
-
Increasing industrial automation and electrification across manufacturing sectors is fueling the adoption of advanced power semiconductor devices for improved operational efficiency.
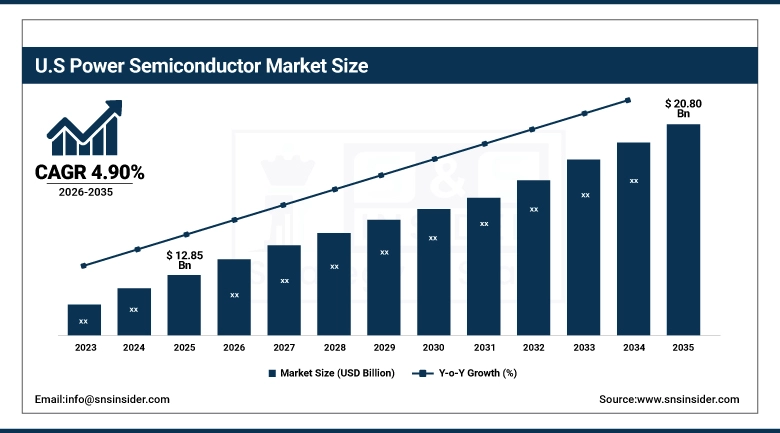
U.S. Power Semiconductor Market Size Outlook:
The U.S. Power Semiconductor Market size was valued at approximately USD 12.85 Billion in 2025 and is projected to reach around USD 20.80 Billion by 2035, growing at a CAGR of 4.90% during 2026–2035. The growth of the U.S. Power Semiconductor Market is driven by increasing adoption of electric vehicles, expansion of data centers and 5G infrastructure, and strong investments in renewable energy and grid modernization. Rising demand for energy-efficient solutions across industrial and consumer sectors, along with government support for domestic semiconductor manufacturing and electrification initiatives, is further accelerating market growth.
Power Semiconductor Market Key Drivers:
-
Rapid adoption of electric vehicles driving demand for high-efficiency power semiconductors in traction, charging, and battery systems.
The Power Semiconductor Market is being driven by the increased rate of growth of Electric Vehicles. Electric Vehicles make extensive use of power devices such as IGBT, MOSFET, and SiC modules for efficient power conversion. As the government is encouraging Electric Vehicles, and manufacturers are ramping up the production of Electric Vehicles, the need for advanced power devices is also growing. Furthermore, the development of Electric Vehicle charging stations is also fueling the Power Semiconductor Market.
Power Semiconductor Market Key Restraints:
-
High cost and complex manufacturing of advanced materials like SiC and GaN limiting widespread adoption.
The cost factor, which is associated with wide bandgap materials like silicon carbide and gallium nitride, is a major restraint for the Power Semiconductor Market. The fabrication of these materials is complex, and substrates are costly, which adds to the overall cost. It is difficult for small and mid-sized companies to adopt these technologies due to cost constraints. In addition, supply chain constraints, along with wafer quality issues, are hindering the growth of the market, although demand is increasing.
Power Semiconductor Market Key Opportunities:
-
Growing integration of renewable energy systems creating demand for advanced power conversion technologies.
An increase in the use of renewable sources of energy, such as solar and wind power, is also a great opportunity for the Power Semiconductor Market. This is because, for efficient power conversion, advanced semiconductor devices that can handle high voltage and improve energy efficiency are necessary. As different countries are focusing on renewable sources of energy, the market for power semiconductor devices is growing. In addition, innovations in energy storage systems and microgrids also provide opportunities for the market.
Power Semiconductor Market Segments:
-
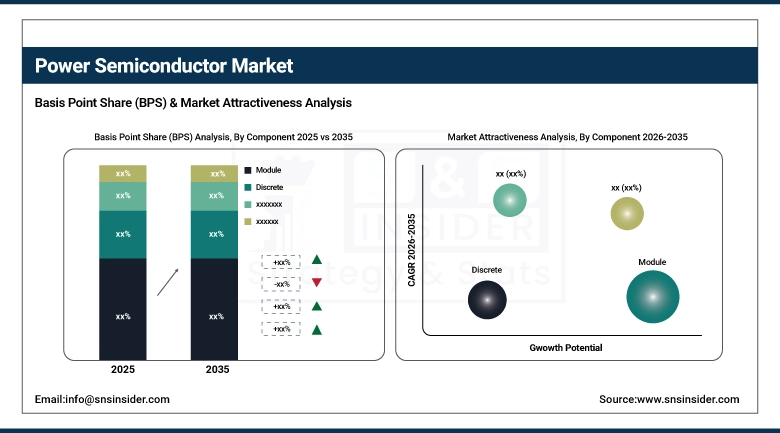
By Component: In 2025, Module segment dominated with 48% share; Power Integrated Circuits fastest growing segment during 2026–2035
-
By Application: In 2025, Automotive dominated with 36% share; IT & Telecommunications fastest growing segment during 2026–2035
-
By Material: In 2025, Silicon dominated with 62% share; Silicon Carbide fastest growing segment during 2026–2035
-
By Voltage Range: In 2025, Medium Voltage dominated with 45% share; High Voltage fastest growing segment during 2026–2035
By Component, Modules Dominate While Power Integrated Circuits Are Fastest Growing:
Modules segment led the market due to their high capacity for handling power. Moreover, their use in electric vehicles, drives, and renewable energy systems also contributed to their market share. The high demand for modules in the automotive industry helped the segment maintain its dominance in the market in 2025.
Power Integrated Circuits have the highest growth rate due to increased demand for compact and efficient products in consumer appliances and IoT products. These ICs simplify the design process with combined control and power functions in a smaller package. The increased rate of usage in smart products and portable appliances is driving their growth rate during the forecast period.
By Application, Automotive Dominates While IT & Telecommunications Is Fastest Growing:
The automotive segment led the market in terms of growth due to the high rate of adoption of electric vehicles and hybrid technologies. In power semiconductors, battery management, inverter, and on-board charger are key components. The rise in electric vehicle production and government initiatives for electric mobility also contributed to the growth of the segment in 2025.
IT & Telecommunications is the fastest-growing segment, which can be related to the growth in the number of data centers, cloud computing, and 5G networks. The requirement for efficient power management and high-performance computing solutions also contributes to the growth of power semiconductor devices in this segment.
By Material, Silicon Dominates While Silicon Carbide Is Fastest Growing:
The segment of Silicon held the maximum market share due to its cost-effective nature and well-established supply chain. It is the most popular choice of material used in traditional power devices and thus enables large-scale deployment of the product in various sectors.
The segment of Silicon Carbide is growing at a faster rate compared to others. This is due to its high efficiency, high temperature, and high voltage operation. The product is gaining popularity as it is being increasingly used in EVs and renewable energy systems.
By Voltage Range, Medium Voltage Dominates While High Voltage Is Fastest Growing:
Medium Voltage segment held the largest share of the market due to the widespread use of devices in this segment for various industrial equipment, automotive systems, and power distribution applications.
High Voltage segment is growing at the fastest rate. This segment is witnessing a high growth rate due to the increasing need for devices in renewable energy systems, electric grids, and electric vehicle fast charging systems.
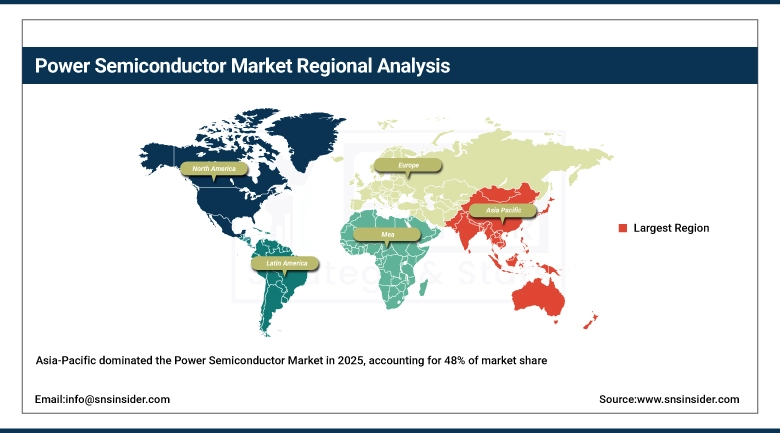
Power Semiconductor Market Regional Analysis:
Asia-Pacific Power Semiconductor Market Insights:
Asia-Pacific holds the largest share for the Power Semiconductor Market, which accounts for more than 48% of the total global market share and is also the fastest growing region with CAGr of 6.5% from 2026-2035. This is mainly due to the fact that major electronics manufacturing centers are located in China, Japan, South Korea, and Taiwan. Rapid growth in the region can be attributed to factors such as high demand for consumer electronics products, high growth in EV production, and increasing renewable energy installations.
Get Customized Report as per Your Business Requirement - Enquiry Now
North America Power Semiconductor Market Insights:
North America is the most significant player in the global Power Semiconductor Market, supported by a robust presence of leading semiconductor companies, research and development, and increasing demand for electric automobile, data center, and renewable energy applications. The area also enjoys the ongoing support from government policies to boost local semiconductor manufacturing, while it also rides on the early rollout of 5G and cloud infra.
Europe Power Semiconductor Market Insights:
Europe Power Semiconductor Market: The market for power semiconductor in Europe is growing steadily with a high demand for automotive products, especially for electric vehicles. Moreover, the government’s initiatives for sustainable development are also driving the growth of the market for power semiconductor in the European region.
Latin America Power Semiconductor Market Insights:
The Latin America Power Semiconductor Market is growing moderately due to the increased rate of adoption of industrial automation, development of telecommunication infrastructure, and growing demand for consumer electronics products. Renewable energy segment investments are also favoring the growth of the market in the region.
Middle East & Africa (MEA) Power Semiconductor Market Insights:
The Middle East & Africa Power Semiconductor market is growing steadily with increased investments in power infrastructure, renewable energy, and smart city development. The need for efficient solutions is also driving the market growth with increased industrial activities in the region.
Power Semiconductor Market Competitive Landscape:
Introduced in 1999, Infineon Technologies has become the global market leader in power semiconductors as well as energy-efficient solutions, and also provides IGBT, MOSFET, SiC and GaN devices, etc. headquartered in Germany. The firm is focused on the automotive, industrial and renewable energy markets that enable electrification and decarbonization of the world’s energy systems. DIODES INC is a world leader in wide bandgap semiconductor and power devices solutions.
-
In Feb 2025, Infineon Technologies expanded its SiC production capacity to support growing demand from electric vehicles and renewable energy applications, enhancing efficiency and scalability.
ON Semiconductor, an American firm established in 1999, focuses on intelligent power and sensing solutions, offering high-performance power semiconductors, including SiC-based solutions for automotive, industrial, and cloud power markets. The firm primarily focuses on energy-efficient innovations and has a significant presence in EV powertrains as well as fast-charging solutions. The firm is also well-recognized for its vertically integrated supply chain and focus on sustainability.
-
In Jan 2025, ON Semiconductor announced expansion of its silicon carbide manufacturing facilities to strengthen its position in the EV and industrial power markets.
Power Semiconductor Companies are:
-
Infineon Technologies
-
Mitsubishi Electric
-
Toshiba Corporation
-
STMicroelectronics
-
Texas Instruments
-
Vishay Intertechnology
-
NXP Semiconductors
-
Renesas Electronics
-
ABB Ltd
-
Broadcom Inc.
-
Wolfspeed
-
ROHM Semiconductor
-
Hitachi Energy
-
Semikron
-
Littelfuse
-
Microchip Technology
-
Analog Devices
-
Delta Electronics
| Report Attributes | Details |
|---|---|
| Market Size in 2025 | USD 53.70 Billion |
| Market Size by 2035 | USD 86.98 Billion |
| CAGR | CAGR of 4.94% From 2026 to 2035 |
| Base Year | 2025 |
| Forecast Period | 2026-2035 |
| Historical Data | 2022-2024 |
| Report Scope & Coverage | Market Size, Segments Analysis, Competitive Landscape, Regional Analysis, DROC & SWOT Analysis, Forecast Outlook |
| Key Segments | • By Component (Discrete, Module, Power Integrated Circuits), • By Application (Automotive, Consumer Electronics, IT & Telecommunications, Military & Aerospace, Power, Industrial, and Other), • By Material (Silicon Carbide, GaN, Silicon, Other), • By Voltage Range (Low Voltage, Medium Voltage, High Voltage) |
| Regional Analysis/Coverage | North America (US, Canada), Europe (Germany, UK, France, Italy, Spain, Russia, Poland, Rest of Europe), Asia Pacific (China, India, Japan, South Korea, Australia, ASEAN Countries, Rest of Asia Pacific), Middle East & Africa (UAE, Saudi Arabia, Qatar, South Africa, Rest of Middle East & Africa), Latin America (Brazil, Argentina, Mexico, Colombia, Rest of Latin America). |
| Company Profiles | Infineon Technologies, ON Semiconductor, Mitsubishi Electric, Toshiba Corporation, STMicroelectronics, Texas Instruments, Vishay Intertechnology, Fuji Electric, NXP Semiconductors, Renesas Electronics, ABB Ltd, Broadcom Inc., Wolfspeed, Rohm Semiconductor, Hitachi Energy, Semikron, Littelfuse, Microchip Technology, Analog Devices, Delta Electronics. |
Frequently Asked Questions
Ans: The Power Semiconductor Market is expected to grow at a CAGR of 4.94% during 2026–2035.
Ans: The Power Semiconductor Market size was valued at USD 53.70 Billion in 2025 and is projected to reach USD 86.98 Billion by 2035.
Ans: The key drivers of the Power Semiconductor Market include rising adoption of electric vehicles, expansion of renewable energy, increasing demand for energy-efficient electronics, and growth in industrial automation.
Ans: The Module segment dominated the Power Semiconductor Market during the projected period.
Ans: Asia Pacific dominated the Power Semiconductor Market in 2025.
Get in Touch
