Electronic Nose (E-Nose) Market Report Scope & Overview:
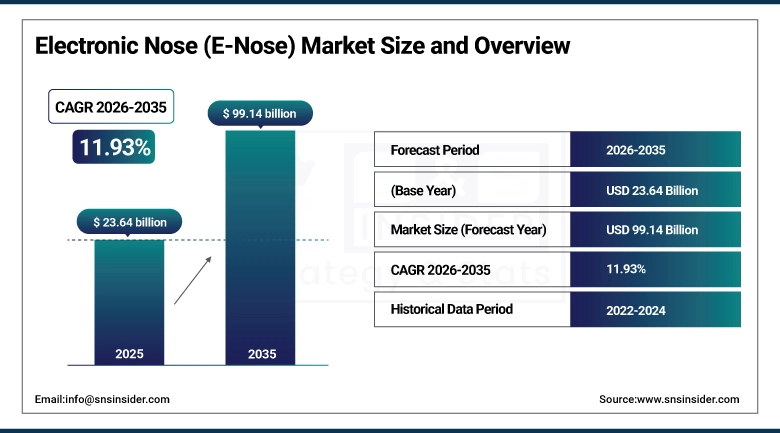
The Electronic Nose (E-Nose) Market size was valued at USD 23.64 Billion in 2025 and is projected to reach USD 99.14 Billion by 2035, growing at a CAGR of 11.93% during 2026–2035.
The Electronic Nose (E-Nose) Market is driven by factors such as increased need for advanced sensing technologies in healthcare, food and beverage, environmental, and security-related applications. Increased need for quick and non-invasive detection of diseases, stringent food quality, and safety regulations are also propelling the market. In addition, increased concerns regarding environmental pollution and detection of hazardous gases are also fueling the market for Electronic Nose. Technological advancements in Artificial Intelligence and IoT technologies are also enhancing the accuracy of Electronic Nose.
Electronic Nose (E-Nose) Market Size and Growth Projection:
-
Market Size in 2025: USD 23.64 Billion
-
Market Size by 2035: USD 99.14 Billion
-
CAGR: 1.93% during 2026–2035
-
Base Year: 2025
-
Forecast Period: 2026–2035
-
Historical Data: 2022–2024

To Get more information on Electronic Nose (E-Nose) Market - Request Free Sample Report
Electronic Nose (E-Nose) Market Key Trends:
-
Increasing adoption of electronic nose systems in healthcare for non-invasive disease diagnosis is driving demand for advanced odor detection technologies.
-
Rising use of E-Nose devices in food & beverage industry for quality control, freshness detection, and contamination monitoring is accelerating market growth.
-
Advancements in sensor technologies and integration with artificial intelligence and machine learning are enhancing accuracy and real-time analysis capabilities.
-
Growing demand for environmental monitoring solutions is boosting the use of E-Nose systems for air quality assessment and detection of hazardous gases.
-
Miniaturization and portability of electronic nose devices are expanding their applications across industrial, military, and consumer sectors.
-
Increasing deployment in security and defense for detection of explosives, narcotics, and hazardous substances is further driving market adoption.
U.S. Electronic Nose (E-Nose) Market Size Outlook:
The U.S. Electronic Nose (E-Nose) Market was valued at approximately USD 7.35 Billion in 2025 and is projected to reach around USD 22.85 Billion by 2035, growing at a CAGR of 12.00% during 2026–2035. Growth is driven by increasing adoption in healthcare diagnostics, rising demand for food quality monitoring, expanding environmental sensing applications, and strong investments in AI-integrated sensor technologies, along with growing use in defense and industrial safety.
Electronic Nose (E-Nose) Market Key Drivers:
-
Rising demand for advanced sensing technologies across healthcare, food safety, and environmental monitoring is driving market growth.
The need to diagnose diseases through non-invasive means and detect diseases in real-time is a major growth factor for the electronic nose market. In the medical industry, the E-Nose device is used to detect diseases at an early stage by analyzing the patient’s breath. In the food industry, it is used to ensure the quality and freshness of food. Environmental regulations and air pollution are also contributing factors.
Electronic Nose (E-Nose) Market Key Restraints:
-
High cost of advanced sensors and lack of standardization limiting widespread adoption.
These electronic nose systems require complex sensor arrays and sophisticated technologies for data processing. This has a direct impact on the cost factor for the system. This is a challenge for small and medium-scale enterprises. Secondly, the lack of standard protocols for the system's use and calibration also poses a challenge for the system's reliability and accuracy.
Electronic Nose (E-Nose) Market Key Opportunities:
-
Integration of artificial intelligence and IoT enabling smarter and more efficient sensing solutions.
Large scale trends towards the use of AI and ML technologies, IoT are major drivers for the growth in E-Nose market High trends of AI, machine learning and IoT technologies are expected to be the biggest opportunity for the growth of E-Nose market. The E-Nose market is driven by the growing trends of AI, machine learning, and IoT technologies.
Electronic Nose (E-Nose) Market Segments:
-
By Type: In 2025, Portable Devices dominated with 57% share; Embedded Sensors fastest growing segment during 2026–2035
-
By Technology: In 2025, Metal Oxide Semiconductor (MOS) dominated with 49% share; Surface Acoustic Wave (SAW) fastest growing segment during 2026–2035
-
By End User: In 2025, Food and Beverage dominated with 34% share; Healthcare fastest growing segment during 2026–2035
-
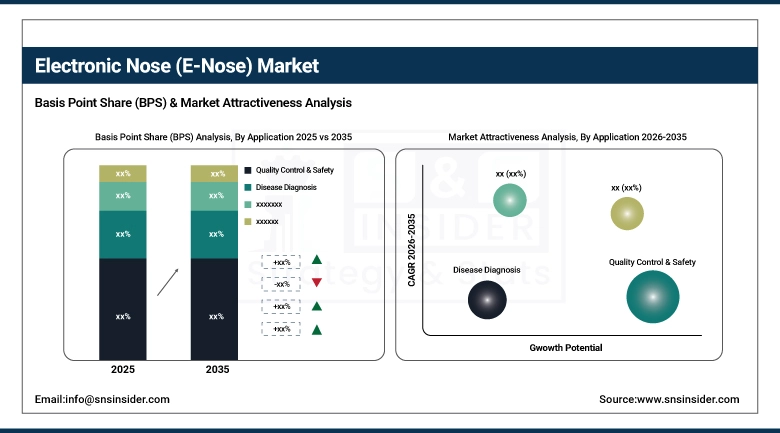
By Application: In 2025, Quality Control & Safety dominated with 38% share; Disease Diagnosis fastest growing segment during 2026–2035
By Application, Quality Control & Safety Dominates While Disease Diagnosis Is Fastest Growing:
The dominance of quality control and safety segment in E-Nose market as various industry verticals depend on it in ensuring product quality, detecting product contamination, and compliance with regulatory requirement. This industrial use was widely adopted which maintained its dominance.
The disease diagnosis segment is the fastest growing segment due to innovations in medical studies, development of E-Nose devices and its rising use for breath analysis to detect diseased and healthy people separately. The broad-based application of this approach is attributed to their non-invasive and rapid diagnosis.
By Type, Portable Devices Dominate While Embedded Sensors Are Fastest Growing:
Portable devices segment held the largest share of the market due to their user-friendly interface and high adoption rate in various industries, including food safety, environment, and defense. Their ability to offer on-site real-time analysis has boosted their demand in the 2025 market.
Embedded sensors are the fastest-growing segment of the market. This is mainly due to the increasing use of embedded sensors in various applications, including industrial applications, medical devices, and smart environments. The increasing use of IoT devices is boosting the growth of this segment.
By Technology, MOS Sensors Dominate While SAW Is Fastest Growing:
Metal Oxide Semiconductor (MOS) sensors held the largest share in the market due to their cost-effectiveness and high sensitivity. MOS sensors are also commonly used in commercial E-Nose products.
Surface Acoustic Wave (SAW) holds the largest share in the growing segment due to its high accuracy and quick response time. This technology also has the best sensing capabilities compared to other technologies.
By End User, Food & Beverage Dominates While Healthcare Is Fastest Growing:
However, the food and beverage segment led the market due to the stringent quality control standards and the growing demand for freshness and detection of contaminants. E-Nose systems are used for aroma profiling, which makes the segment a strong growth area in 2025.
Healthcare is the fastest-growing segment, driven by the growing demand for non-invasive diagnostic tools and early disease detection methods. The research in breath analysis and medical diagnostics contributes to the growth of this market segment.
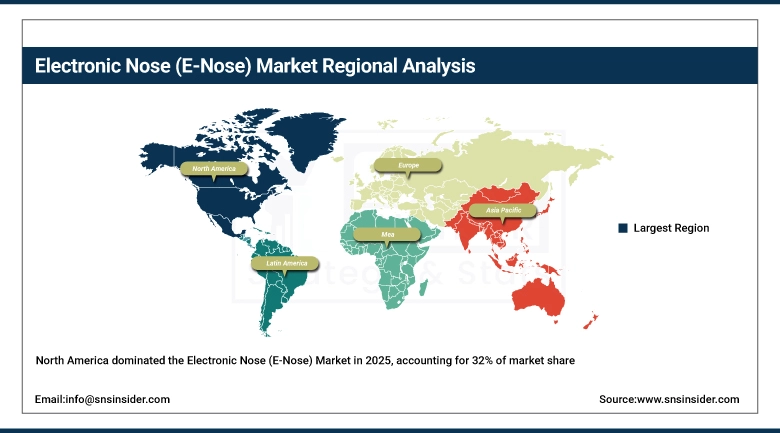
Electronic Nose (E-Nose) Market Regional Analysis:
North America Electronic Nose (E-Nose) Market Insights:
The Electronic Nose (E-Nose) Market is dominated by North America capturing around 32% share of the total Electronic Nose (E-Nose) Market worldwide. This high level of dominance can be attributed to solid R&D investments, early adoption of advanced sensing technologies, and regulatory frameworks favorable to healthcare diagnostics and food safety. On account of the presence of prominent technology companies in the region, increased usage in environmental monitoring and rising consumer acceptance for non-invasive disease detection are other factors that are aiding the growth of the market in the region.
Get Customized Report as per Your Business Requirement - Enquiry Now
Asia-Pacific Electronic Nose (E-Nose) Market Insights:
Asia-Pacific, is expected to be the fastest growing region and grow at a CAGR of around 13.52%during the forecast period. Rapid industrialization, rise in food processing industries and growing need to monitor air quality, will drive the growth of the global industrial gas sensors market. The strong investment in smart manufacturing and environmental regimes in countries such as China, Japan, and India is driving the demand for E-Nose systems in various applications.
Europe Electronic Nose (E-Nose) Market Insights:
Owing to stringent environmental legislation and great emphasis on quality control in the food and industrial sectors, Europe accounts for a considerable share of the global market. High adoption of sophisticated monitoring systems for odor detection and pollution management in the region is providing a positive impact for the market. Moreover, increasing focus on sustainability and industrial regulation is further triggering the uptake of E-Nose technologies.
Latin America Electronic Nose (E-Nose) Market Insights:
The Latin American region is experiencing modest growth from the accelerating awareness of food safety, environmental monitoring, and industrial quality control. From food processing to waste management, the region is slowly but steadily welcoming E-Nose technologies. Investments in infrastructure and an improving regulatory environment are expected to underpin further market growth.
Middle East & Africa (MEA) Electronic Nose (E-Nose) Market Insights:
The market in Middle East & Africa is relatively underdeveloped but is gradually growing as environmental monitoring, industrial safety, and smart cities initiatives gain traction. As the governments are working on pollution control and developing new infrastructure, drives the demand for advanced sensing technologies adoption. In addition, these investments and their awareness are still new, but steady growth is expected in the region.
Electronic Nose (E-Nose) Market Competitive Landscape:
Based in Germany, AIRSENSE Analytics was founded in 1996 and is dedicated to the realization of detection and identification systems for a wide variety of hazardous substances including the electronic nose technology. With portable and real-time detection solutions for public safety, military, aviation, and industrial monitoring, the company caters to sectors that demand the utmost quality in safety. Targeting CBRNE detection and strong sensor-based technologies.
-
In recent years, AIRSENSE Analytics has focused on enhancing portable e-nose systems with improved sensitivity and real-time monitoring capabilities for environmental and security applications.
Headquartered in the Netherlands, the eNose Company develops electronic nose solutions mainly for applications in the medical field, especially breath analysis enabling disease detection. Their main area of interest is sensors arrays and data analysis to measure biomarkers leading to non-invasive diagnostics. It focuses on medical applications of digital scent technology and is well known for its innovations.
-
In 2024, The eNose Company expanded its clinical applications, strengthening its position in medical diagnostics through advanced breath analysis technologies.
Alpha MOS is a France-based company founded in 1992, which is a global leader on electronic nose, electronic tongue and sensory analysis systems for the food, beverage, pharmaceutical industrial sectors. They offer advanced odor, taste, and visual analysis solutions to maintain the quality and consistency of the product. About CTCI has long been known for its solid R&D abilities and international reputation.
-
In 2024, Alpha MOS continued expanding its portfolio of AI-integrated sensory analysis systems, enhancing accuracy and efficiency in industrial quality control applications.
Electronic Nose (E-Nose) Companies are:
-
The eNose Company
-
Alpha MOS
-
Odotech
-
Sensigent
-
SCIOsense
-
Cambridge Sensotec
-
G.A.S. Sensing
-
ScentDetect
-
Sensing Solutions
-
Tellspec
-
Sensory Analytics
-
eNose Lab
-
Airsense
-
Cortexica
-
Platometrics
-
Molecular Vision
-
Fruity Fresh
-
Vairus
| Report Attributes | Details |
|---|---|
| Market Size in 2025 | USD 23.64 Billion |
| Market Size by 2035 | USD 99.14 Billion |
| CAGR | CAGR of 11.93% From 2026 to 2035 |
| Base Year | 2025 |
| Forecast Period | 2026-2035 |
| Historical Data | 2022-2024 |
| Report Scope & Coverage | Market Size, Segments Analysis, Competitive Landscape, Regional Analysis, DROC & SWOT Analysis, Forecast Outlook |
| Key Segments | • By Type (Embedded Sensors, Portable Devices) • By Technology (Metal Oxide Semiconductor Sensors (MOS), Quartz Crystal Microbalance (QCM), Conducting Polymers (CP), Surface Acoustic Wave (SAW), Others) • By End User (Military and Defense, Healthcare, Food and Beverage, Waste Management) • By Application (Disease Diagnosis, Quality Control & Safety, Environmental Monitoring, Explosive & Narcotics Detection, Others) |
| Regional Analysis/Coverage | North America (US, Canada), Europe (Germany, UK, France, Italy, Spain, Russia, Poland, Rest of Europe), Asia Pacific (China, India, Japan, South Korea, Australia, ASEAN Countries, Rest of Asia Pacific), Middle East & Africa (UAE, Saudi Arabia, Qatar, South Africa, Rest of Middle East & Africa), Latin America (Brazil, Argentina, Mexico, Colombia, Rest of Latin America). |
| Company Profiles | Airsense Analytics, Enose Company, Alpha MOS, Odotech, Sensigent, eNose Technology, SCIOsense, Cambridge Sensotec, G.A.S. Sensing, ScentDetect, Sensing Solutions, Tellspec, Sensory Analytics, eNose Lab, Airsense, Cortexica, Platometrics, Molecular Vision, Fruity Fresh, Vairus. |
Frequently Asked Questions
Ans: The Electronic Nose (E-Nose) Market is expected to grow at a CAGR of 11.93% during 2026–2035.
Ans: The Electronic Nose (E-Nose) Market size was valued at USD 23.64 Billion in 2025 and is projected to reach USD 99.14 Billion by 2035.
Ans: The Electronic Nose (E-Nose) Market is driven by technological advancements, rising demand for healthcare, food safety, and environmental monitoring, and increasing industrial and security applications.
Ans: The Portable Devices segment dominating during the projected period.
Ans: North America dominated the Electronic Nose (E-Nose) Market in 2025.
Get in Touch
