Smart Adaptive Lighting Retrofit Market Size Analysis:
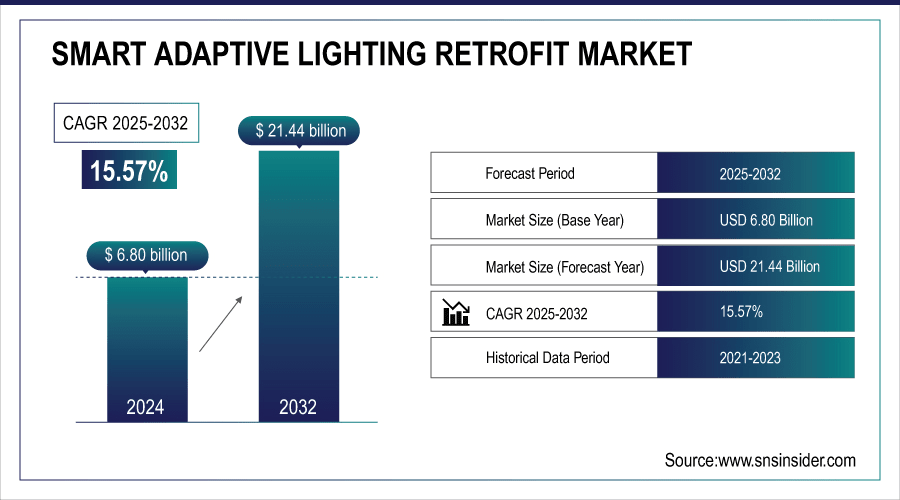
The Smart Adaptive Lighting Retrofit Market size was valued at USD 6.80 billion in 2024 and is expected to reach USD 21.44 billion by 2032 and grow at a CAGR of 15.57% over the forecast period of 2025-2032.
The Global market report contains detailed Smart adaptive lighting retrofit market analysis by product type, application, distribution channel, communication technology, and by regional market. It puts emphasis on notable shareholding trends, section movements, and forces driving them. There is a growing need for energy efficiency regulations along with upgrading antiquated infrastructure in urban areas. Cost-effective and simpler to deploy, retrofitting is preferred across commercial, residential, and public infrastructure sectors as such initiatives can bolster the market growth with widespread adoption until 2032.
For instance, more than 60% of smart lighting retrofits are now being integrated with IoT platforms for automated and responsive control.
To Get More Information On Smart Adaptive Lighting Retrofit Market - Request Free Sample Report
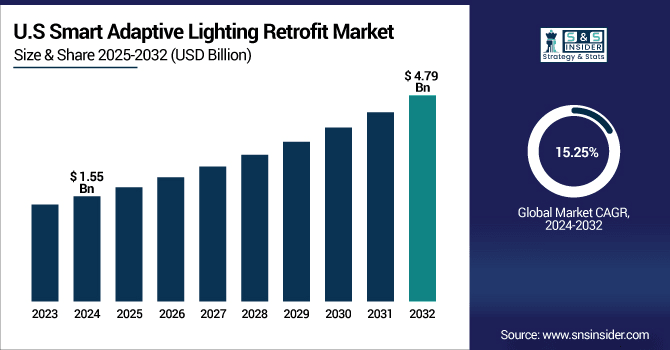
The U.S. Smart Adaptive Lighting Retrofit Market size was USD 1.55 billion in 2024 and is expected to reach USD 4.79 billion by 2032, growing at a CAGR of 15.25% over the forecast period of 2025–2032.
U.S. market is mainly driven by the rising adoption of energy-efficient retrofitting among commercial and public infrastructure segments. The deployment is being hastened by smart city initiatives, government incentives, and rebates for LED upgrades. In addition, the presence of key industry players, high digitalization and early adoption of IoT-enabled lighting systems, are to fuel the Smart adaptive lighting retrofit market growth. These factors work together to create an environment ripe for the robust organic growth of smart adaptive lighting retrofits throughout the U.S.
For instance, LED retrofits in U.S. commercial buildings can cut lighting energy use by up to 60–70%.
Smart Adaptive Lighting Retrofit Market Dynamics:
Key Drivers:
-
Government Policies, Energy Efficiency Standards, and Subsidies Are Encouraging Adoption of Smart Retrofit Solutions
Government policies and regulations that promote sustainability are steadily replacing traditional lighting systems with smart retrofit kits. Energy codes, including Title 24, the EU's Ecodesign Directive, and various national standards mandate efficiency retrofits. End-users save even more with the help of industry rebates and tax deductions, reducing the investment cost. This, in turn, is forcing players in both the public and private sectors to abide by these standards, thus driving the market for retrofitting smart lighting systems, enabling prolonged operational savings with low operational cost.
For instance, Smart lighting retrofits reduce O&M (Operations & Maintenance) costs by up to 40% over conventional lighting systems.
Restraints:
-
High Initial Investment Costs and Long Payback Period Discourage Small-Scale Deployments Across Cost-Sensitive Markets
Smart adaptive lighting retrofit systems come with a setback; while they can save energy over the long run, the cost to implement the smart controllers, sensors and integration into existing systems can be prohibitive upfront. The upfront investment can be prohibitive, especially for small and medium-sized enterprises (SMEs) in developing economies. The need for costly electrical upgrades due to installation complexities can add to the price. Furthermore, the return-on-investment may only be realized over several years, making smart lighting retrofits unappealing to short-term oriented organizations, thus limiting growth in regions and segments more sensitive to price.
Opportunities:
-
Proliferation of IoT, AI, and Cloud-Based Platforms Creates Scope for Smarter, Predictive, and Automated Lighting Solutions
Smart adaptive lighting systems integrated into proven IoT and AI platforms provide predictive maintenance, adaptive brightness, and real-time analytics. These improvements open the door to new levels of efficiency and operational intelligence. The latest innovations in cloud-based monitoring allow for regional level centralization of thousands of fixtures. Systems with collective usage data & traffic analysis & lights that can be automated based on pedestrians’ behavior have become the first choice among municipalities, retailers & facility managers. Smart Adaptive Lighting Retrofit Market trends reveal a shift toward data-driven ecosystems. This reflects a strong future growth opportunity for hub-based players providing smart retrofitting solutions.
For instance, over 70% of newly installed adaptive lighting systems now support IoT integration for centralized control and automation.
Challenges:
-
Data Security and Network Vulnerabilities in Connected Lighting Infrastructure Pose Operational Risks and Adoption Barriers
Since smart adaptive lighting systems are connected to building management platforms or city-wide control networks, they can be a target for cyber threats. Such systems may contain data about users, their operational data, and compromising the sensitives of entire grids! Such security-related risks attract regulatory attention, and compel stakeholders to invest heavily in building security frameworks, which could lead to delays and restrictions in deployments. The absence of cybersecurity standards in lighting protocols compounds the risk, representing a critical hurdle to widespread adoption.
Smart Adaptive Lighting Retrofit Market Segmentation Analysis:
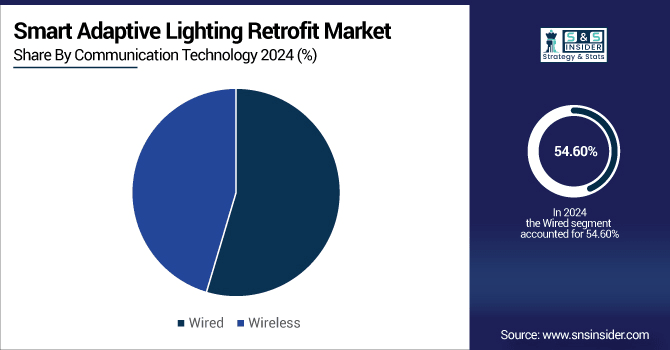
By Communication Technology
The wireless communication technology segment dominated the market in 2024, capturing over 45.40% of the revenue share, and is estimated to register the fastest growth with a CAGR of 15.69% during the latter half of the forecasted period from 2024 to 2032, attributed to the high flexibility of the deployment option and integration with IoT. WiZ Connected (part of Signify) is another vendor that provides plug-and-play wireless retrofit solutions. Their methods allow remote lighting and do not require existing wiring to be rewired, which is especially beneficial for infrastructure as it ages.
By Product Type
In 2024, LED Retrofit Kits accounted for a largest portion of the market, capturing 33.20% revenue share as they can be easily fitted with current fixtures and are also compatible with the majority of existing fittings. In between, a significant amount of this growth has been catalyzed by Signify (the former Philips Lighting), with the bevy of retrofit solutions. These kits continue to lead possibilities globally where a cost-effective and regulatory compliant solution is needed to retrofit projects.
Smart Drivers & Controllers is expected to be achieve the fastest CAGR of 16.72% by 2032, by driven by the growing need for lighting automation and centralized control in the building automation system. EldoLED, Acuity Brands, Smart Lighting, Compact rendering driver This Intelligent Building Edge drives higher performance and flexibility, particularly in the case of commercial spaces that need complex control capabilities.
By Application
Commercial segment generated 34.80% of the Smart Adaptive Lighting Retrofit Market share revenue in 2024 due to high retrofitting rates for massive offices, quite a few malls and hotels. For specialty retrofit packages, companies such as Cree Lighting are at the forefront of commercial adoption. Cost-saving, ambiance-enhancing, and sustainable goal-hitting make commercial spaces prime candidates for intelligent lighting retrofits.
Public Infrastructure will continue to be the fastest-growing segment by a wide margin with a CAGR of 16.48% during 2024 to 2032 mainly fueled by smart cities growth and increasing requirement for intelligent street lighting. Main providers such as Current Lighting Solutions LLC are allowing municipalities to use sensor-based adaptive lighting. They provide scalable urban lighting platforms that comply with energy efficiency mandates and allow real-time control.
By Distribution Channel
Offline segment dominated the market in 2024 with a 60.90% revenue share owing to the need to continue with a personalized service with bulk procurement from organizations. Through offline networks, major distributors such as Rexel Group deliver end-to-end retrofit solution. They are well-suited for installations with high complexity, and as such, the encouraged avenues for commercial and public sector deployment.
By 2032, the online distribution sector is anticipated to experience the highest CAGR of 16.49% during 2024 to 2032 along with digital procurement and e-commerce, further fueling the growth of this segment. More smart lighting retrofit kits that appeal directly to consumers and SMBs are being sold through sellers such as Amazon Business. Easy online availability, wide product coverage and attractive pricing leads to higher adoption.
Smart Adaptive Lighting Retrofit Market Regional Analysis:
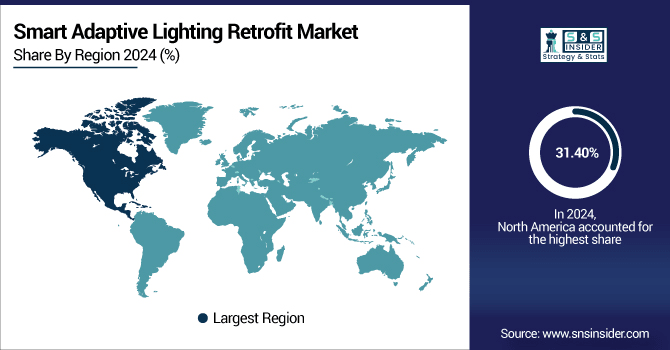
North America held the largest revenue share of 31.40% in 2024 in the global market due to high retrofit rates, energy efficiency legislation, and an established infrastructure in the U.S. and Canada. The presence of key plays, effective regulatory support, and high demand for commercial and municipal use are the major factors driving the market growth in the region.
Get Customized Report as per Your Business Requirement - Enquiry Now
-
The U.S. dominates the North American market due to widespread smart infrastructure upgrades, strong regulatory mandates, and early adoption of IoT-enabled lighting systems. Major players and extensive commercial retrofitting also contribute to its leadership across various application sectors.
The Asia Pacific region is projected to register the highest CAGR of 17.10% during the forecast period of 2024 to 2032, due to the rapid urbanization, increasing infrastructure investments and government-led smart city programs in counties such as China, India, and Southeast Asia. The growth of energy efficiency awareness coupled with the accelerating adoption of digital technologies are also driving the region.
-
China leads the Asia Pacific market owing to aggressive smart city initiatives, massive urbanization, and government-backed LED retrofitting programs. The presence of domestic manufacturers and large-scale public infrastructure investments further strengthen its position in the regional smart adaptive lighting retrofit landscape.
Europe holds a significant position in Smart Adaptive Lighting Retrofit Market, attributed by the high energy efficiency regulations, well-established foundation of LED technologies and ambitious sustainability objectives. Smart Infrastructure has been witnessed in many countries and respective nation with huge investment are germany, UK and Netherlands. Moreover, a solid base of public-private partnerships and EU directives is still pushing forward retrofit in commercial, industrial and public building sectors.
-
Germany dominates the European Smart Adaptive Lighting Retrofit industry due to strict energy regulations, strong government incentives, and advanced infrastructure. Its leadership is supported by large-scale retrofitting projects and innovation from companies including Osram, outpacing France, the UK, Italy, and Spain.
The Middle East & Africa market is led by the UAE, driven by smart city projects, sustainability goals and strong government initiatives. Rapid urbanization, upgraded infrastructure and energy-efficiency programs place Brazil as a leader in most Latin American region, while both countries are the main drivers behind the growth of smart adaptive lighting retrofits in the region.
Smart Adaptive Lighting Retrofit Companies are:
Major Key Players in Smart Adaptive Lighting Retrofit Market are Signify (formerly Philips Lighting), Acuity Brands, Inc., Eaton Corporation, OSRAM GmbH (now part of ams OSRAM), Cree Lighting, Hubbell Lighting, GE Current (Daintree), Zumtobel Group, Schneider Electric, Honeywell International Inc., Lutron Electronics Co., Inc., Legrand S.A., Panasonic Corporation, Delta Electronics, Inc., Zumtobel Group AG, RAB Lighting Inc., Telensa Ltd., Wipro Lighting, Helvar and LEDVANCE GmbH and others.
Recent Developments:
-
In June 2025, Signify announced that it would be a key exhibitor at Light + Building 2026 (March 2026), showcasing its latest smart lighting ecosystem—including Philips Hue, Interact IoT, BrightSites, and Dynalite controls—designed to enhance adaptive lighting retrofit adoption across commercial and public infrastructure sectors.
-
In April 2025, ams OSRAM launched the NIGHT BREAKER® LED SMART ECE H11, the world’s first fully ECE R37 homologated LED retrofit lamp for H11 automotive bulbs, promising up to 60% energy saving, six‑times longer life, and plug‑and‑play ease.
| Report Attributes | Details |
|---|---|
| Market Size in 2024 | USD 6.80 Billion |
| Market Size by 2032 | USD 21.44 Billion |
| CAGR | CAGR of 15.57% From 2025 to 2032 |
| Base Year | 2024 |
| Forecast Period | 2025-2032 |
| Historical Data | 2021-2023 |
| Report Scope & Coverage | Market Size, Segments Analysis, Competitive Landscape, Regional Analysis, DROC & SWOT Analysis, Forecast Outlook |
| Key Segments | • By Product Type (LED Retrofit Kits, Smart Bulbs, Smart Drivers and Controllers, Sensors and Others) • By Application (Residential, Commercial, Industrial and Public Infrastructure) • By Distribution Channel (Online and Offline) • By Communication Technology (Wired and Wireless) |
| Regional Analysis/Coverage | North America (US, Canada, Mexico), Europe (Germany, France, UK, Italy, Spain, Poland, Turkey, Rest of Europe), Asia Pacific (China, India, Japan, South Korea, Singapore, Australia,Taiwan, Rest of Asia Pacific), Middle East & Africa (UAE, Saudi Arabia, Qatar, South Africa, Rest of Middle East & Africa), Latin America (Brazil, Argentina, Rest of Latin America) |
| Company Profiles | Signify (formerly Philips Lighting), Acuity Brands, Inc., Eaton Corporation, OSRAM GmbH (now part of ams OSRAM), Cree Lighting, Hubbell Lighting, GE Current (Daintree), Zumtobel Group, Schneider Electric, Honeywell International Inc., Lutron Electronics Co., Inc., Legrand S.A., Panasonic Corporation, Delta Electronics, Inc., Zumtobel Group AG, RAB Lighting Inc., Telensa Ltd., Wipro Lighting, Helvar and LEDVANCE GmbH. |
Frequently Asked Questions
North America dominated the Smart Adaptive Lighting Retrofit Market in 2024.
The Offline segment dominated the Smart Adaptive Lighting Retrofit Market in 2024.
Rising demand for energy efficiency, government incentives, and smart city initiatives are the major growth drivers for this market.
The Smart Adaptive Lighting Retrofit Market size was USD 6.80 Billion in 2024 and is expected to reach USD 21.44 Billion by 2032.
The Smart Adaptive Lighting Retrofit Market is expected to grow at a CAGR of 15.57% from 2025-2032.
Get in Touch
