RF GaN Semiconductor Device Market Report Scope & Overview:
Get More Information on RF GaN Semiconductor Device Market - Request Sample Report
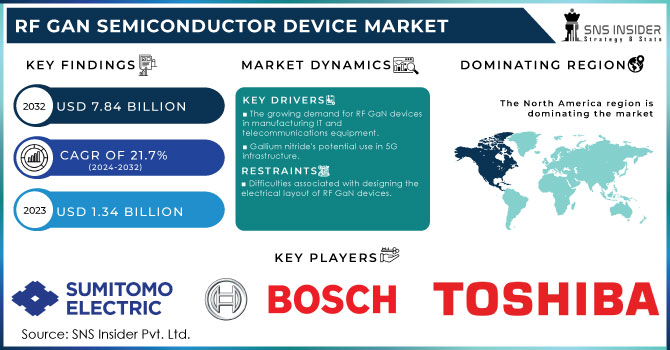
The RF GaN Semiconductor Device Market Size was valued at USD 1.34 billion in 2023 and is expected to reach USD 7.84 billion by 2032 and grow at a CAGR of 21.7% over the forecast period 2024-2032.
The RF GaN semiconductor device market is rapidly growing because of the high requirement for high-efficiency, high-frequency semiconductor devices in sectors like telecommunications, aerospace, and defense. The rapid growth of the RF GaN Semiconductor Device market is largely due to the expanding requirement for sophisticated and high-performance communication systems, such as 5G networks. For instance, the growth seen by the fifth generation of 5G networks, in 2022 has been remarkable, with nearly half a billion connections added and a strong drive in 2023. There has been a 76% increase in global 5G connections, topping 1.05 billion by the end of 2022 and it is predicted to reach 5.9 billion by 2027. North America leads in these changes, with 119 million connections and expected 215 million by 2023. As for the global conditions, a general rise in this technology is maintained by the number of commercial networks increasing from 259 to 403 by 2025.
Moreover, the increasing use of these types of devices by the defense sector for their robustness and high power also enhances their penetration across other areas. In the U.S., the Biden-Harris Administration announced in 2023 that the U.S. Department of Commerce and Polar Semiconductor have signed a non-binding preliminary memorandum of terms that stipulates the provision of up to USD 120 million in proposed federal incentives under the CHIPS and Science Act to the company. According to the memorandum, the proposed funding aims at stimulating investment from private and state sources to grow Polar’s manufacturing complex and introduce new technology into the facility. Continuous innovations and the rising popularity of Gallium Nitride technology have led to the launch of new, efficient, and low-cost products, thereby creating greater opportunities for growth within an operationally feasible aspect.
MARKET DYNAMICS:
Drivers
-
The growing demand for RF GaN devices in manufacturing IT and telecommunications equipment.
The leading driving factor for the RF GaN semiconductor device market is the increasing demand for RF GaN devices in the manufacturing of IT and telecommunications equipment. GaN technology provides better performance compared to traditional silicon devices, especially in such demanding areas as high frequency, high power, and high efficiency. As a result, RF GaN devices are applicable in a rather wide range of IT and telecommunications equipment, such as cellular base stations, satellite communications, radar systems, wireless infrastructure, etc. Another important driving force is the extremely fast development of 5G networks. 5G networks require RF GaN devices because these devices provide much better results working with higher frequencies and power. Their benefits include better signal integrity, network efficiency, data throughput, and coverage, which is extremely important in the case of ongoing demands for the development of modern communication systems.
-
Gallium nitride's potential use in 5G infrastructure.
Gallium nitride is steadily becoming more valued and used in advanced 5G infrastructure, fueling a positive trend in the RF GaN semiconductor device market. GaN’s electrical properties, high electron mobility, superior thermal conductivity, and wide bandgap, make this material an excellent choice to meet the requirements of 5G technology. GaN solutions are necessary for the 5G infrastructure power amplifiers, as power GaN devices enable the transmission of high-frequency signals more efficiently than traditional silicon-based devices and consume less energy in the process. GaN technology allows for operating at much higher voltages and temperatures without diminishing transistor performance. Hence GaN semiconductors extend the upper frequency range and power levels necessary for 5G, making the cellular network infrastructure more powerful and effective. In addition, GaN technology brings miniaturization to RF circuits, which saves space and paves the way for ultra-dense deployments of base stations and small cells.
Restraints
-
Difficulties associated with designing the electrical layout of RF GaN devices.
Designing an electrical layout of a RF GaN device is a complicated task that has a significant impact on the development of the RF GaN Semiconductor Device Market. RF GaN is characterized by its high level of electron mobility and breakdown voltage, which indicates a high level of control over electrical characteristics that can be applied. At the same time, the power density and speed of switching of RF GaN are two orders of magnitude greater than in the case of Si. As a result, effective thermal management of the RF GaN device and the development of effective strategies for heat dissipation are key requirements. While the physical parameters of GaN devices are superior to their silicon derivatives, the integration of such components into systems with Si materials may create compatibility issues. For example, the problem of quality manufacturing of GaN-based systems that would allow creating a low parasitic inductance and low capacitance remains unsolved; so, the availability of special simulation tools for GaN continues to be a critical issue.
MARKET SEGMENT:
BY MATERIAL
The GaN-On-Sic segment dominated the market in 2023 with a market segment of more than 45%. GaN on SiC combines the super electronic properties of GaN such as high electron mobility and large bandgap with the extra features of high thermal capacity and high breakdown voltage of SiC which gives a complementary result of highly reliable, robust, and highly efficient RF GaN devices. This technology solves the need for high power and high frequency operating devices which in turn solve the application's needs including 5G networks, radar, and satellite communication systems.
The GaN-on-Silicon segment is to grow at a faster CAGR during 2024-2032. Its benefits include lower cost, the potential for larger wafer sizes, etc. This type is cost-effective, as well as allows to implementation of high-frequency functions to different types of devices due to the developed silicon production process.
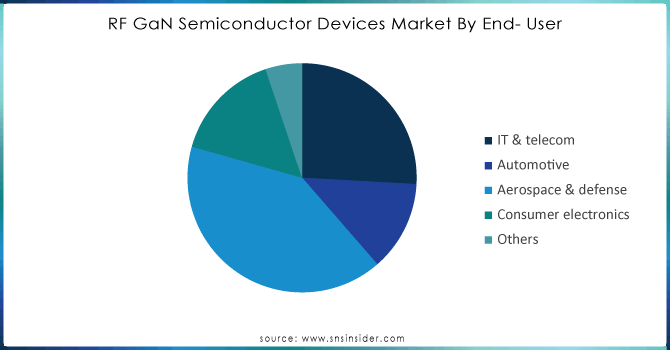
BY END-USER
The aerospace & defense sector captured a market share of around 40% in 2023 and also accounted for the fastest CAGR during 2024-2032. Radio Frequency Gallium Nitride technology provides notably more benefits compared to Silicon in terms of semiconducting. It has a higher breakdown voltage and better thermal conductivity, which makes it more beneficial for those applications that require high power and high frequency. Especially, in the aerospace industry RF GaN devices are required for highly advanced radars, satellite communication, and electronic warfare. This type of device is preferable for these applications as it can operate at higher frequencies and can handle the appropriate power levels. In defense, it is properly integrated into communication devices due to its signal clarity and strength, which is highly required for successful military operations. For example, in phased array radars GaN-based RF amplifiers are used as such radars to implement their function need to be efficient and provide high power levels at the same time, so they can detect and track multiple targets concurrently.
Get Customized Report as per your Business Requirement - Request For Customized Report
BY APPLICATION
The wireless infrastructure segment led the market in 2023 with a market share of more than 48% and also it is to retain its growth during the forecast period. The wireless infrastructure market was significant throughout the market because wireless infrastructure application areas such as 5G base stations, and Wi-Fi routers are utilizing GaN-based devices since they are superior to silicon-based semiconductors. Moreover, wireless communication market growth drives the wireless infrastructure market. RF GaN semiconductor devices perform their functions in such wireless infrastructures as base stations, small cells, and network equipment. These devices are necessary for the capacity expansion of networks that becomes increasingly necessary due to modern tendencies. First of all, these components are capable of working at higher frequencies, thus minimizing signal loss typical of other devices. Secondly, such technology allows scientists and engineers to develop networks in a more concentrated manner, which allows connecting more devices at once without overloading the network.
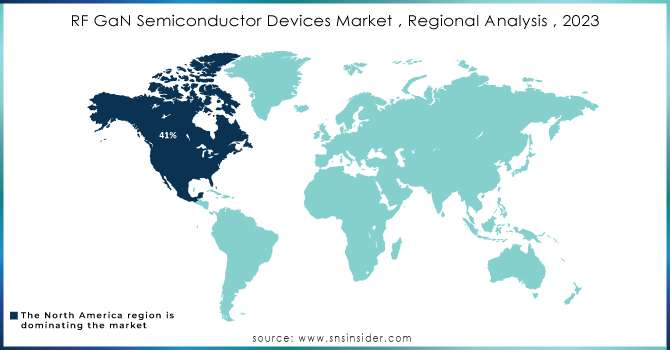
REGIONAL ANALYSIS:
The North American RF GaN Semiconductor Device market dominated in 2023 with more than 40% market share, due to the region’s strong base in technology and telecommunications infrastructure. Moreover, the substantial investment made for the enhancement of research and development also implies that the bulk of RF GaN devices are finding applications in this region. The domain of the 5G wireless network, which is emerging and is witnessing incredible growth over the years, is one of the key demand drivers. The GaN-based power amplifiers and numerous other GaN components are deployed in 5G to ensure larger data rates and lower latencies.
The Asia-Pacific RF GaN Semiconductor Device Market is expected to grow at the largest CAGR from 2024 to 2032. This dominance is due to its application in segments such as consumer and enterprise, telecommunications, automotive, industrial, etc. The telecommunications market develops rapidly in the region, and the widespread adoption of 5G, in particular, contributes to the fast-growing demand for RF GaN-based solutions. In addition, China’s RF GaN Semiconductor Device market held the largest market share, and the Indian RF GaN Semiconductor Device market is the fastest-growing market in the Asia-Pacific region.
KEY PLAYERS:
The key players in the RF GaN semiconductor device market are Sumitomo Electric Industries, Robert Bosch, Toshiba Corporation, Infineon Technologies, Microchip Technology, Raytheon Company, STMicroelectronics, Mitsubishi Electric Corporation, Panasonic Corporation, NXP Semiconductor & Other Players.
Recent Development
-
Infineon Technologies announced their new RF GaN devices in January 2024. The devices are designed to be used in 5G base stations and have been presented to offer increased efficiency and higher power density. RF GaN is crucial for accommodating the high data requirements that are put before 5G systems.
-
Qorvo Inc. has recently launched its brand-new GaN-on-SiC power amplifier, introducing it to the audience in March 2024. The power amplifier has been engineered for the next-generation radar systems and offers improved performance and hotter thermal management.
| Report Attributes | Details |
|---|---|
| Market Size in 2023 | USD 1.34 billion |
| Market Size by 2032 | USD 7.84 billion |
| CAGR | CAGR of 21.7% From 2024 to 2032 |
| Base Year | 2023 |
| Forecast Period | 2024-2032 |
| Historical Data | 2020-2022 |
| Report Scope & Coverage | Market Size, Segments Analysis, Competitive Landscape, Regional Analysis, DROC & SWOT Analysis, Forecast Outlook |
| Key Segments | • By Material (GaN-On-Silicon, GaN-On-Sic, GaN-On-Diamond) • By End-User (IT & Telecom, Automotive, Aerospace & Defense, Consumer Electronics, Others) • By Application (Wireless Infrastructure, Satellite Communication, Power Storage, PV Inverted, Others) |
| Regional Analysis/Coverage | North America (USA, Canada, Mexico), Europe (Germany, UK, France, Italy, Spain, Netherlands, Rest of Europe), Asia-Pacific (Japan, South Korea, China, India, Australia, Rest of Asia-Pacific), The Middle East & Africa (Israel, UAE, South Africa, Rest of Middle East & Africa), Latin America (Brazil, Argentina, Rest of Latin America) |
| Company Profiles | Sumitomo Electric Industries, Robert Bosch, Toshiba Corporation, Infineon Technologies, Microchip Technology, Raytheon Company, STMicroelectronics, Mitsubishi Electric Corporation, Panasonic Corporation, and NXP Semiconductor. |
| Key Drivers | • The growing demand for RF GaN devices in manufacturing IT and telecommunications equipment. • Gallium nitride's potential use in 5G infrastructure. |
| RESTRAINTS | • Difficulties associated with designing the electrical layout of GaN devices. |
Frequently Asked Questions
Ans: North America dominated the RF GaN Semiconductor Device Market in 2023.
Ans: The GaN-On-SiC segment dominated the RF GaN Semiconductor Device Market.
Ans: There is a growing demand for RF GaN devices in manufacturing IT and telecommunications equipment which is a major growth factor for the RF GaN Semiconductor Device market.
Ans: RF GaN Semiconductor Device Market size was USD 1.34 billion in 2023 and is expected to Reach USD 7.84 billion by 2032.
Ans: The RF GaN Semiconductor Device Market is expected to grow at a CAGR of 21.7% during 2024-2032.
Get in Touch
