Portable Gaming Console Market Size & Growth:
The Portable Gaming Console Market Size was valued at USD 15.23 billion in 2025 and is expected to reach USD 36.29 billion by 2035, growing at a CAGR of 9.07% over the forecast period of 2026-2035.
Portable Gaming Console Market trends are shifting toward hybrid and cloud-based devices, with growing demand for cross-platform compatibility and immersive gameplay. Shifting consumers trend towards durable gaming on the go, coupled with the compact size of advanced hardware performance and battery life is expected to drives the growth of Portable Gaming Console Market. Users stay hooked with its hybrid consoles, integration of cloud gaming services, and also, with an exhaustive game library. In addition, internet penetration as well as roll-out of 5G and digital distribution channels are several factors that further expected to support the market growth.
Portable Gaming Console Market Size and Forecast:
-
Market Size in 2025: USD 15.23 Billion
-
Market Size by 2035: USD 36.29 Billion
-
CAGR: 9.07% from 2026 to 2035
-
Base Year: 2025
-
Forecast Period: 2026–2035
-
Historical Data: 2022–2024

To Get more information on Portable Gaming Console Market - Request Free Sample Report
Key Trends in the Portable Gaming Console Market:
-
Rising demand for handheld gaming devices driven by the popularity of casual, mobile, and on-the-go gaming experiences.
-
Increasing adoption of high-performance processors and advanced graphics capabilities to support console-quality gaming in portable form factors.
-
Growing focus on energy-efficient chipsets and optimized battery management to extend gameplay duration.
-
Rapid expansion of cloud gaming and game streaming services enabling high-end gaming experiences on portable consoles.
-
Integration of advanced display technologies, haptic feedback, and immersive audio to enhance user experience.
-
Higher investment by gaming companies in exclusive content, cross-platform compatibility, and ecosystem development.
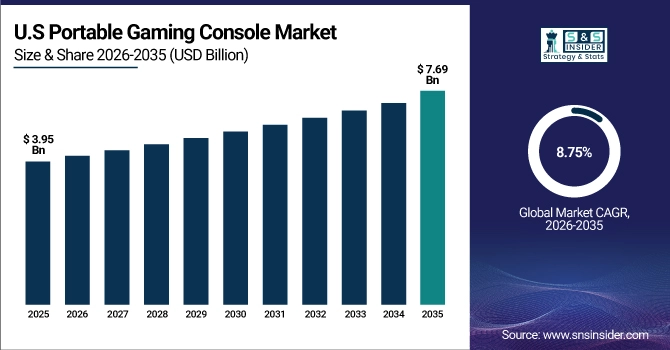
U.S. Portable Gaming Console Market Size Outlook
The U.S. Portable Gaming Console Market size was valued at USD 3.95 billion in 2025 and is expected to reach USD 7.69 billion by 2035, growing at a CAGR of 8.75% over the forecast period of 2026-2035. The U.S. portable gaming market is expanding as demand for hybrid and handheld consoles (like the Switch and the Steam Deck), widespread 5G and broadband access, established digital game ecosystems, and greater engagement with more portable and on-the-go gameplay from younger, more digital-native generations continue to drive interest.
Portable Gaming Console Market Drivers:
-
Hybrid Consoles and Cloud Gaming Fuel Demand for High Performance Portable Gaming Experiences Worldwide
The increasing demand for flexible on-the-go gaming experience alongside improvements in hardware features such as high-performance processors, longer battery life, and advanced display technologies like OLED are some of the drivers for global portable gaming console market. The trend for hybrid console segment, enabling handheld and docked gameplay option, is driving the market growth as well. At the same time, the inclusion of cloud gaming services and online multiplayer capabilities massively boosted user engagement, along with the rising internet penetration and 5G rollout that stoked the flames for connectivity and performance expectations.
As of mid‑2025, 106 global providers offer mobile cloud gaming services, increasing accessibility on handheld consoles
Portable Gaming Console Market Restraints:
-
Battery Limitations and Heat Management Challenge Performance and Portability in Next Generation Gaming Consoles
Even with the most portable gaming consoles, the biggest dilemma is how battery performance deteriorates as hardware power requirements rise. High-end hardware such as GPUs, displays with high refresh rates, and better processors can also shorten the battery life of laptops, compromising the gaming experience when users are travelling or playing for long periods Thermal management is also still an issue due to the compact designs making it hard to dissipate heat for extended sessions, or when playing graphically intensive games.
Portable Gaming Console Market Opportunities:
-
Emerging Markets and Advanced Technologies Unlock New Growth Avenues for Portable Gaming Console Manufacturers Globally
The emerging markets with growing youth demographics and digital infrastructure provide unexplored growth opportunities for the manufacturers of portable gaming devices. In addition, there are opportunities in the development of cross-platform compatibility, cloud gaming subscription services, and AI-enabled gaming experiences that can personalize gaming, increase accessibility, and expand the reach of consumers.
Over 95% of internet users in the Philippines played video games in 2023, most on mobile devices demonstrating the scalable potential of handheld consoles in demographics with strong youth penetration
Portable Gaming Console Market Challenges:
-
Fragmented Gaming Ecosystems and Component Shortages Challenge Innovation and Accessibility in Portable Console Market
Another is the fragmentation of gaming ecosystems, where the compatibility of games across platforms and the ease of game migration between platforms are still not standardized. Moreover, the disruption of supply chains and the delay of critical component availability, especially semiconductors, may prolong the innovation cycle of products. Finally, the need for digital rights management may impede accessibility in areas where internet connectivity is not stable.
Portable Gaming Console Market Segmentation Analysis:
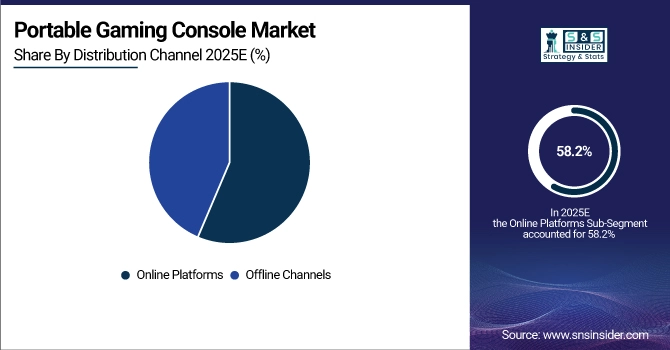
By Distribution Channel, Online Platforms Dominate Market with 58.2% Share in 2025 and Record Fastest Growth
The Online distribution channel held the largest market share in the portable gaming console market in 2025, with a share of approximately 58.2% of the total sales, and is expected to maintain its leading position with the highest CAGR growth rate in the forecast period of 2026-2035. This is attributed to the rising preference for digital content, quicker delivery of content, and easy access to a large number of game collections. The rising popularity of cloud gaming platforms, digital discounts, and the acceptance of online payment methods further emphasize the leading position of e-commerce platforms.
By Console Type, Hybrid Consoles Dominate Portable Gaming Console Market with 41.7% Share in 2025, Cloud-Based Consoles to Record Fastest Growth
The Hybrid console market had a prominent share of about 41.7% in the global portable gaming console market in 2025. This is because the Hybrid console has the unique capability of working flawlessly both in handheld and docked modes. The Hybrid console provides unparalleled flexibility to the user to switch between the portable and home gaming experience without compromising on performance. The best-selling Hybrid consoles, such as Nintendo Switch and Valve Steam Deck, have created a benchmark in the industry by providing a powerful combination of hardware and flexibility.
The Cloud gaming console market is anticipated to register the fastest growth rate during the forecast period from 2026 to 2035, driven by the growing adoption of 5G networks, development of cloud infrastructure, and rising interest in cloud gaming, which requires less hardware and allows users to stream games with high quality.
By Connectivity, Wi-Fi Enabled Consoles Dominate Market with 44.7% Share in 2025, Cellular-Enabled Consoles to Record Fastest Growth
The Wi-Fi enabled segment contributed around 44.7% to the overall market share of portable gaming consoles in 2025. This is because Wi-Fi connectivity is more reliable and faster for downloading games and streaming content. Wi-Fi connectivity is the most widely available connectivity option in the world, and this is why it is the most preferred option among gamers. The cost-effectiveness of Wi-Fi connectivity is another reason why it is the leading option.
The Cellular-enabled consoles (4G/5G) market is expected to register the fastest growth between 2026 and 2035, due to the growing adoption of 5G technology. The growth of the cellular-enabled consoles market is also expected to be fueled by the development of mobile infrastructure in urban and emerging markets.
By End User, Casual Gamers Dominate Market with 33.8% Share in 2025, 18–35+ Adult Segment to Record Fastest Growth
In 2025, the Casual gamers segment held a leading share of approximately 33.8% in the market for portable gaming consoles, due to the increasing demand for user-friendly interfaces, affordable gaming consoles, and entertainment-based gaming content. Casual gamers are attracted to portable gaming consoles due to their convenience and short gaming sessions, making them the best fit for mobile-based lifestyles. The availability of a wide variety of gaming types, such as puzzle, simulation, and adventure games, is a major driving factor for this segment.
The age group of 18-35+ years is expected to experience the highest CAGR in the period 2026-2035, owing to the rising interest in engaging and high-performance gaming experiences. This age group has high purchasing power, high adoption rates for digital technology, and is increasingly getting involved in multiplayer gaming environments.
Portable Gaming Console Market Regional Insights:
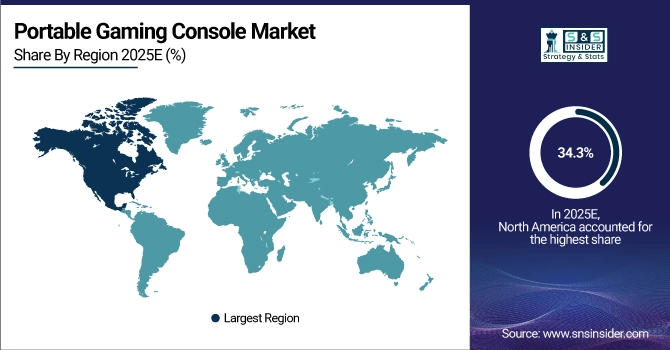
North America Dominates Portable Gaming Console Market in 2025
In 2025, North America represented around 34.3% of the total portable gaming console market, thanks to its well-developed digital infrastructure, high disposable income, and gaming culture. The region is aided by the popularity of hybrid gaming consoles, the early adoption of cloud gaming platforms, and a large number of tech-savvy consumers. The region is further aided by constant innovation in hardware, collaborations, and a growing interest in mobile entertainment experiences, thus establishing North America as the leader in the portable gaming console market.
The United States leads the North American portable gaming console market, supported by strong consumer spending, early technology adoption, and a well-established ecosystem of game developers, content creators, and cloud gaming service providers.
Get Customized Report as per Your Business Requirement - Enquiry Now
Asia-Pacific is the Fastest-Growing Region in the Portable Gaming Console Market
The Asia-Pacific market is expected to record the fastest CAGR growth in the portable gaming console market during the period from 2026 to 2035, driven by the fast-growing middle-class population, increased smartphone and internet penetration, and a young population with a growing interest in gaming. Government spending on digital infrastructure is also accelerating the growth of the market. Furthermore, the popularity of multiplayer and cloud gaming experiences is also fueling the demand for portable gaming consoles in the Asia-Pacific market.
The Asia-Pacific market for portable gaming consoles is dominated by Japan, due to its rich gaming culture, presence of major gaming console manufacturers, and advanced technology infrastructure, which has fueled consumer demand for hybrid and handheld gaming consoles.
Europe Portable Gaming Console Market Insights, 2025
Europe is a key portable gaming console market, owing to a highly developed gaming culture, high consumer electronics penetration levels and growing popularity of hybrid consoles. Region´s economy is supported by the existence of broadband penetration; increased demand for cross-platform and cloud gaming options on the rise, and a thriving independent game development market that adds to diversity in content. Moreover, the growing eco-friendly consumer inclination is expected to impact demand for energy-efficient gaming systems.
Germany, the United Kingdom, and France lead the European market, supported by strong digital retail channels and highly engaged gaming communities.
Middle East & Africa and Latin America Portable Gaming Console Market Insights
The Middle East & Africa (MEA) and Latin America markets are turning out to be promising for portable gaming consoles. This is because of the growing number of young people in these regions, as well as the development of internet connectivity and smartphone penetration. In the Latin America market, Brazil and Mexico are experiencing an increase in demand for gaming consoles because of urbanization and the rising interest in mobile gaming. The MEA market is also gaining traction.
Portable Gaming Console Companies are:
-
Sony Interactive Entertainment LLC
-
Microsoft Corporation
-
Valve Corporation
-
Logitech International S.A.
-
AYANEO (AYN Technologies)
-
GPD (GamePad Digital)
-
Anbernic
-
Powkiddy
-
Blaze Entertainment (Evercade)
-
Lenovo Group Limited
-
ASUS (Republic of Gamers)
-
Acer Inc.
-
Analogue, Inc.
-
Retroid (GoRetroid)
-
Pimax Innovation Inc.
-
One Netbook (ONEXPLAYER)
-
Xiaomi Corporation
-
Tencent Holdings Ltd.
Competitive Landscape of Portable Gaming Console Market:
Nintendo Co., Ltd.
Nintendo Co., Ltd. is a Japan-based global leader in video game hardware and software, renowned for its innovative portable and hybrid gaming consoles. The company is credited with pioneering handheld gaming with products like the Game Boy and Nintendo DS, and has continued its leadership with the Nintendo Switch series. Nintendo specializes in creating engaging, family-friendly gaming experiences, integrating versatile hardware with an extensive game library. Its role in the portable gaming console market is pivotal, driving adoption across casual and core gamers worldwide.
-
In 2024, Nintendo expanded its Switch lineup with enhanced OLED and performance models, integrating improved battery life, display quality, and hybrid functionality to strengthen its leadership in portable gaming.
Sony Interactive Entertainment LLC
Sony Interactive Entertainment LLC is a U.S.-based subsidiary of Sony Group Corporation, offering portable and handheld gaming experiences primarily through the PlayStation Portable (PSP) and PlayStation Vita series. The company focuses on high-performance graphics, immersive gameplay, and connectivity with the PlayStation ecosystem. Sony plays a key role in the portable gaming console market by delivering premium devices that integrate advanced multimedia capabilities, online services, and cross-platform compatibility for dedicated gamers.
-
In 2024, Sony continued to enhance its portable gaming offerings by integrating PlayStation Remote Play and cloud gaming features, allowing players to stream console-quality games on compatible handheld devices.
Microsoft Corporation
Microsoft Corporation is a U.S.-based technology and gaming giant, offering portable gaming experiences primarily through cloud streaming on Xbox consoles and mobile devices. The company specializes in integrating hardware, software, and cloud services to provide high-quality gaming experiences on the go. Microsoft’s role in the portable gaming console market is growing, driven by Xbox Cloud Gaming (xCloud) and its Game Pass ecosystem, enabling gamers to access full console experiences without the need for dedicated handheld hardware.
-
In 2024, Microsoft expanded its portable gaming reach by improving xCloud performance, enhancing device compatibility, and adding new titles to Game Pass for on-the-go play.
Valve Corporation
Valve Corporation is a U.S.-based video game developer and digital distribution company, known for its Steam gaming platform and innovative portable consoles like the Steam Deck. The company focuses on delivering high-performance portable gaming experiences with PC-quality hardware, extensive game libraries, and customizable software. Valve plays a significant role in the portable gaming console market by bridging PC gaming and handheld experiences, appealing to hardcore and enthusiast gamers seeking flexibility and performance.
-
In 2024, Valve upgraded the Steam Deck with improved battery life, enhanced graphics, and optimized SteamOS support for seamless access to the full Steam library on a portable device.
| Report Attributes | Details |
|---|---|
| Market Size in 2025 | USD 15.23 Billion |
| Market Size by 2035 | USD 36.29 Billion |
| CAGR | CAGR of 9.07% From 2026 to 2035 |
| Base Year | 2025 |
| Forecast Period | 2026-2035 |
| Historical Data | 2022-2024 |
| Report Scope & Coverage | Market Size, Segments Analysis, Competitive Landscape, Regional Analysis, DROC & SWOT Analysis, Forecast Outlook |
| Key Segments | • By Console Type (Handheld Only Consoles, Hybrid Consoles, Cloud-Based Gaming Consoles, and Retro/Reissued Consoles) • By Connectivity (Wi-Fi Enabled Consoles, Cellular-Enabled Consoles (4G/5G), Bluetooth Integration, and Offline/Standalone Consoles) • By End User (Casual Gamers, Hardcore/Professional Gamers, Children & Teenagers, and Adults (18–35+ Age Group)) • By Distribution Channel (Online Platforms, and Offline Channels) |
| Regional Analysis/Coverage | North America (US, Canada, Mexico), Europe (Germany, France, UK, Italy, Spain, Poland, Turkey, Rest of Europe), Asia Pacific (China, India, Japan, South Korea, Singapore, Australia, Taiwan, Rest of Asia Pacific), Middle East & Africa (UAE, Saudi Arabia, Qatar, South Africa, Rest of Middle East & Africa), Latin America (Brazil, Argentina, Rest of Latin America) |
| Company Profiles | Nintendo, Sony Interactive Entertainment, Valve, ASUS, Lenovo, AYN Technologies, Logitech G, Razer, GPD, One-Netbook, Anbernic, Powkiddy, AOKZOE, Retroid, Hyperkin, Playdate, Evercade, Tencent Games, Qualcomm, Alienware. |
Frequently Asked Questions
Ans: North America dominated the Portable Gaming Console Market in 2025.
Ans: Wi-Fi Enabled Consoles segment dominated the Portable Gaming Console Market.
Ans: The major growth factor driving the Portable Gaming Console Market is the rising demand for on-the-go, high-performance gaming experiences is the major growth factor driving the Portable Gaming Console Market.
Ans: The Portable Gaming Console Market size was valued at USD 15.23 billion in 2025 and is expected to reach USD 36.29 billion by 2035, growing at a CAGR of 9.07% over the forecast period of 2026-2035.
Ans: The Portable Gaming Console Market is expected to grow at a CAGR of 9.07% from 2026-2035.
Get in Touch
