Smart Plug Market Size & Overview:
Get more information on Smart Plug Market - Request Sample Report
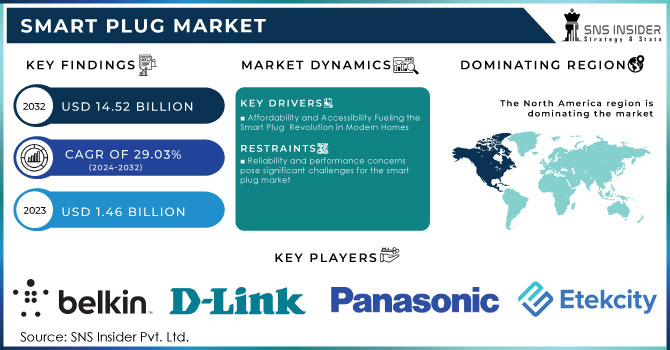
The Smart Plug Market Size was valued at USD 1.46 Billion in 2023 and is expected to reach USD 14.52 Billion by 2032 and grow at a CAGR of 29.03% over the forecast period of 2024-2032.
The smart plug market is rapidly expanding, driven by the increasing consumer focus on energy efficiency and smart home automation. This surge is fueled by consumers' desire to reduce electricity bills while optimizing their home energy consumption. Smart plugs enable users to monitor energy usage in real time, providing insights that can significantly cut down on wasteful energy expenditures. As highlighted by sources like TechRadar and CNET, these devices can pay for themselves by ensuring appliances are only used when needed, thus enhancing energy management. Smart plugs serve as modern versions of timer switches, traditionally used to turn lamps or radios on and off to give the illusion of occupancy. With rising household bills and a growing awareness of climate issues, particularly following the recent Cop26 summit in Glasgow, energy consumption is at the forefront of consumers' minds. Smart plugs not only help disguise the absence of homeowners but also provide valuable insights into energy usage. Many models, such as those from Eve Energy and TP-Link, allow users to track how long electricity-hungry appliances are in use and how much they cost, leading to more informed decisions about energy consumption. The potential savings are significant; for instance, the Energy Saving Trust estimates that the average UK home wastes about £35 (around $50 / AU$65) annually due to appliances left on standby. by using smart plugs to control devices like TVs, set-top boxes, and gaming consoles, homeowners can reduce this unnecessary energy waste. These plugs allow users to set schedules, ensuring that devices are turned off when not in use, which can significantly cut energy costs. As consumers increasingly prioritize sustainability and cost savings, the smart plug market is expected to thrive in the coming years. by effectively managing energy use and minimizing waste, smart plugs are poised to become essential tools in the modern home.
Smart plugs serve as essential components of smart home ecosystems, enabling users to control appliances remotely and automate daily tasks, which enhances convenience and energy management. For instance, Amazon's Echo Pop smart plug has gained attention for its affordability, often available for as low as USD 13, making smart home technology accessible to a broader audience. Promotions, such as the Christmas tree bundle offer, further stimulate consumer interest by providing value-added packages during the holiday season. The growing adoption of electric vehicles (EVs) and plug-in hybrids is also influencing the market, as homeowners seek to integrate charging solutions seamlessly into their smart home setups. Moreover, guides and resources on setting up smart homes are increasingly available, empowering consumers to maximize their investments in home automation. However, challenges exist, as seen with the abrupt shutdown of companies like Insteon, which left users scrambling to maintain their smart home setups. Despite these hurdles, the overall trajectory indicates strong growth for the smart plug market as consumers prioritize convenience, energy efficiency, and technological integration in their homes.
Smart Plug Market Dynamics
Drivers
-
Affordability and Accessibility Fueling the Smart Plug Revolution in Modern Homes
The increasing affordability and accessibility of smart home devices are key drivers propelling the smart plug market forward. Retailers are offering significant discounts on popular products like Kasa smart plugs, with prices dropping to as low as USD 10, making them more appealing to cost-conscious consumers. With prices falling, consumers are more inclined to explore smart home technology, integrating devices that provide convenience and automation in daily life. Numerous articles highlight the best smart home devices on the market, highlighting a wide variety of options available to consumers, from smart locks to security systems. For instance, the smart security upgrades that are gaining popularity can add significant value to homes, with some estimates suggesting a potential increase of up to 15% in property value. As tech-savvy residents in regions like the UAE drive the demand for smart homes, the trend towards enhancing home security and energy efficiency becomes evident. This shift reflects a growing understanding that smart home technology can improve the overall quality of life. Consequently, the rising affordability of smart plugs and other smart home devices fosters widespread adoption, positioning them as essential components of modern living spaces.
Restraints
-
Reliability and performance concerns pose significant challenges for the smart plug market
As many consumers report, issues related to connectivity and overall effectiveness. Problems such as intermittent connections, delays in response times, and malfunctions can lead to frustration and skepticism about the value of smart plugs. According to reviews from the New York Times, users have encountered similar reliability issues with various smart home devices, including smart LED light bulbs and Wi-Fi extenders. These negative experiences can influence future purchasing decisions, with consumers possibly opting for traditional appliances over smart alternatives due to concerns about consistent performance. Furthermore, the reliance on internet connectivity for functionality can exacerbate these issues, particularly in areas with unstable network connections. For example, common problems have been reported with electric vehicle charging apps, highlighting the broader concerns related to smart device reliability. These issues may deter potential buyers who prioritize functionality and ease of use in their purchasing decisions. As a result, manufacturers must address these challenges to build consumer trust and enhance market growth. To remain competitive, smart plug companies need to prioritize product quality and performance while providing reliable customer support to mitigate these concerns.
Smart Plug Market Segmentation
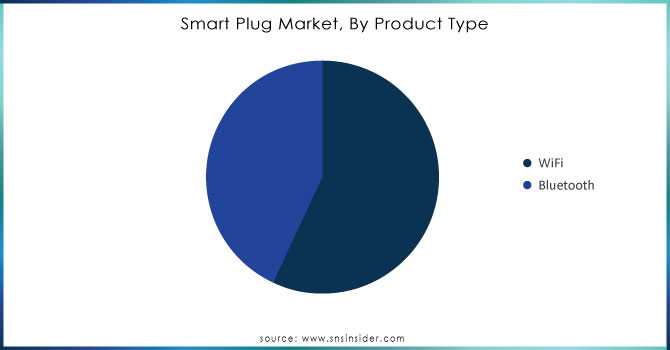
by Product Type
In 2023, WiFi enabled smart plugs captured a significant revenue share of approximately 61% in the smart plug market, driven by key factors that align with consumer preferences and technological advancements. One of the main attractions of WiFi smart plugs is their seamless connectivity, allowing easy integration with home networks and enabling remote control of appliances through smartphone apps or voice commands via smart assistants like Amazon Alexa and Google Assistant. Their versatility is another advantage, offering functionalities such as scheduling, energy monitoring, and automation, which appeal to tech-savvy consumers eager to enhance their smart home ecosystems. Furthermore, the growing investment in smart home technologies has led to increased demand for these devices, positioning WiFi smart plugs as essential components for home automation. Cost-effectiveness also plays a role, as they are often more affordable than alternatives like Zigbee or Z-Wave, making them accessible to a wider audience. Companies like TP-Link, Belkin, Amazon, Meross, Xiaomi, and Philips Hue have launched innovative products in this segment, continuously enhancing features and user experience. As smart home adoption rises globally, WiFi smart plugs are poised to maintain their leading position in this evolving market.
Need Any Customization Research On Inventory Tags Market - Inquiry Now
by Application
The smart plug market is increasingly dominated by the household application segment, which is expected to represent around 61% of the market share in 2023. This trend underscores the rising consumer interest in integrating smart home technology for enhanced energy efficiency and convenience. Significant developments by key companies have fueled this growth; for example, TP-Link has introduced new smart plug models featuring advanced energy monitoring capabilities and compatibility with major smart home systems like Amazon Alexa and Google Assistant. Likewise, Belkin has expanded its Wemo product line to include smart plugs that support HomeKit, catering to Apple users seeking simple home automation solutions. Regionally, North America and Europe are experiencing swift adoption of smart plugs, driven by heightened awareness of energy conservation and sustainable practices. Countries such as the United States and Germany are at the forefront of implementing smart home technologies, demonstrating significant consumer demand for energy-efficient products. Additionally, manufacturers are innovating with features like built-in surge protection, customizable timers, and enhanced mobile app controls that enable real-time energy usage tracking.
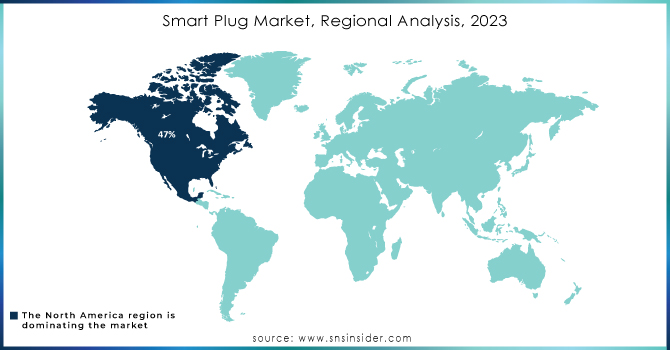
Smart Plug Market Regional Analysis
In 2023, North America is projected to hold the largest share of the smart plug market, accounting for approximately 47% of total revenue. This dominance can be attributed to the increasing adoption of smart home technology and the growing awareness of energy conservation among consumers. The region is characterized by a robust infrastructure for smart devices, with significant investments from leading companies in the technology sector. Product development in North America is marked by innovations such as energy monitoring capabilities and compatibility with major smart home ecosystems like Amazon Alexa and Google Assistant. Companies like TP-Link and Belkin are continuously enhancing their product lines to include features such as surge protection, customizable timers, and real-time energy usage tracking, appealing to eco-conscious consumers. On the country level, the United States leads the charge, propelled by a strong consumer interest in energy-efficient solutions and convenience-driven technology. The presence of major retailers and a tech-savvy population facilitate the rapid dissemination of smart plug products. Meanwhile, Canada is also witnessing a steady increase in smart plug adoption, driven by government initiatives promoting energy efficiency. Overall, continuous innovation and a favorable regulatory environment that supports the growth of smart home technologies underpin North America’s strong market position.
In 2023, Asia Pacific emerges as the second fastest-growing region in the smart plug market, driven by rapid urbanization, increasing disposable incomes, and a burgeoning interest in smart home technologies. A diverse consumer base and varying levels of technological adoption, with countries like China, India, and Japan leading the charge, characterize this region. China stands out as a significant contributor, with its extensive manufacturing capabilities and a growing demand for energy-efficient appliances, fueled by government initiatives aimed at promoting sustainability. The country's focus on smart cities and technological advancements has accelerated the integration of smart plugs into daily life. Meanwhile, India is witnessing a surge in smart home adoption, especially among the middle class, as consumers seek to enhance convenience and energy management in their households. Japan also plays a crucial role in the region, known for its innovation and early adoption of technology. The increasing emphasis on home automation solutions is reflected in the rising demand for smart plugs equipped with advanced features, such as voice control and energy monitoring. As more consumers in the Asia Pacific region recognize the benefits of energy efficiency and smart home integration, the smart plug market is expected to flourish, with local manufacturers and international players competing to meet the growing demand.
Key Players
Some of the key players in Smart Plug market who provide product and offering:
-
Belkin International, Inc. (WeMo Smart Plug)
-
D-Link Corporation (mydlink Smart Plug)
-
Panasonic Corporation (Panasonic Smart Plug)
-
EDIMAX Technology Co. Ltd. (EDIMAX Smart Plug)
-
Etekcity Corporation (Etekcity Smart Wi-Fi Plug)
-
Insteon (Insteon Smart Plug-In Module)
-
Leviton Manufacturing Co., Inc. (Leviton Decora Smart Plug)
-
SDI Technologies, Inc. (iHome Smart Plug)
-
TP-Link Technologies Co., Ltd. (Kasa Smart Plug)
-
Xiaomi Inc. (Xiaomi Mi Smart Plug)
-
Ankuoo Electronics Inc. (Ankuoo NEO Smart Plug)
-
Satechi (Satechi Smart Plug)
-
ConnectSense (ConnectSense Smart Plug)
-
Lenovo Group Limited (Lenovo Smart Power Plug)
-
TP-Link Technologies Co., Ltd. (Kasa Smart Plug)
-
Belkin International, Inc. (WeMo Smart Plug)
-
Leviton Manufacturing Co., Inc. (Leviton Decora Smart Plug)
-
D-Link Corporation (mydlink Smart Plug)
-
Panasonic Corporation (Panasonic Smart Plug)
List of major suppliers in the plug market, which includes a range of electrical plugs, including smart plugs:
-
TP-Link Technologies Co., Ltd.
-
Belkin International, Inc.
-
Leviton Manufacturing Co., Inc.
-
D-Link Corporation
-
Panasonic Corporation
-
Xiaomi Inc.
-
Etekcity Corporation
-
EDIMAX Technology Co. Ltd.
-
Insteon
-
Satechi
Recent Development
-
October 2024, a recent development in the smart plug market is the growing popularity of energy monitoring features, exemplified by the Govee Smart Plug with Energy Monitoring. This advancement allows users to track real-time power consumption, helping optimize energy efficiency and reduce costs, enhancing the overall functionality of smart plugs.
-
As of October 15, 2024, a recent development is Amazon's holiday promotion offering a free Echo Pop and Amazon Smart Plug with the purchase of select artificial Christmas trees, providing a total savings of $64.98.
-
As of October 14, 2024, the Kasa Smart Plug Mini is gaining popularity for its affordability at just $9.99 and high ratings on Amazon. Users like Janie Campbell praise its convenience, highlighting how it has significantly simplified their daily routines and improved their smart home experience.
-
As of October 10, 2024, Amazon is offering the TP-Link Tapo Dual-Outlet Matter Outdoor Smart Plug at a discounted price of $15.99 after applying an on-page coupon, marking one of its best prices yet. Originally launched at $30, this model has seen significant price reductions, making it an attractive option for smart home enthusiasts.
-
As of October 16, 2024, SKYX Platforms Corp. announced a collaboration with Wayfair to provide advanced and smart plug-and-play lighting solutions tailored for retail and professional segments, including designers and architects. This partnership aims to enhance smart home standards by offering a variety of innovative lighting products and retrofit kits.
| Report Attributes | Details |
|---|---|
| Market Size in 2023 | USD 1.46 Billion |
| Market Size by 2032 | USD 14.52 Billion |
| CAGR | CAGR of 29.03% From 2024 to 2032 |
| Base Year | 2023 |
| Forecast Period | 2024-2032 |
| Historical Data | 2020-2022 |
| Report Scope & Coverage | Market Size, Segments Analysis, Competitive Landscape, Regional Analysis, DROC & SWOT Analysis, Forecast Outlook |
| Key Segments | • By Product Type (WiFi, Bluetooth) • By Application (Industrial, Household, Commercial) |
| Regional Analysis/Coverage | North America (US, Canada, Mexico), Europe (Eastern Europe [Poland, Romania, Hungary, Turkey, Rest of Eastern Europe] Western Europe] Germany, France, UK, Italy, Spain, Netherlands, Switzerland, Austria, Rest of Western Europe]), Asia-Pacific (China, India, Japan, South Korea, Vietnam, Singapore, Australia, Rest of Asia-Pacific), Middle East & Africa (Middle East [UAE, Egypt, Saudi Arabia, Qatar, Rest of Middle East], Africa [Nigeria, South Africa, Rest of Africa], Latin America (Brazil, Argentina, Colombia, Rest of Latin America) |
| Company Profiles | Belkin International, D-Link Corporation, Panasonic Corporation, EDIMAX Technology, Etekcity Corporation, Insteon, Leviton Manufacturing, SDI Technologies, TP-Link Technologies, Xiaomi Inc., Ankuoo Electronics, Satechi, ConnectSense, and Lenovo Group. |
| Key Drivers | • Affordability and Accessibility Fueling the Smart Plug Revolution in Modern Homes |
| RESTRAINTS | • Reliability and performance concerns pose significant challenges for the smart plug market |
Frequently Asked Questions
Ans: North America region dominated Smart Plug Market
Ans: The Smart Plug Market grow at a CAGR of 29.03% over the forecast period of 2024-2032.
Ans: Rising consumer preference for smart homes and Proliferation of smart devices are the drivers of the Smart Plug Market.
Ans: Belkin International, D-Link Corporation, Panasonic Corporation, EDIMAX Technology, Etekcity Corporation, Insteon, Leviton Manufacturing, SDI Technologies, TP-Link Technologies, Xiaomi Inc., Ankuoo Electronics, Satechi, ConnectSense, and Lenovo Group
Ans: The Smart Plug Market size was valued at 1.46 Billion in 2023
Get in Touch
