Smart Pneumatic Market Key Insights:
To Get More Information on Smart Pneumatic Market - Request Sample Report
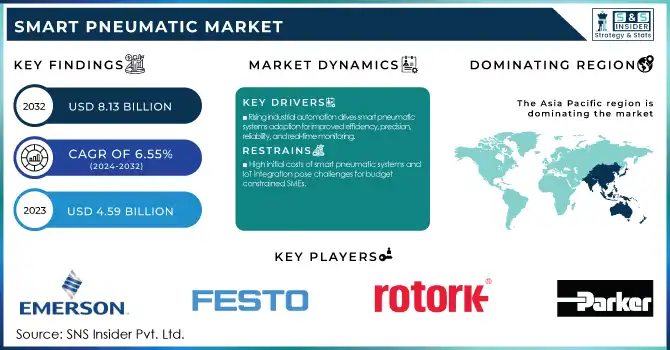
The Smart Pneumatic Market size was estimated at USD 4.59 billion in 2023 and is expected to reach USD 8.13 billion by 2032 with a growing at CAGR of 6.55% during the forecast period of 2024-2032.
The Smart Pneumatic Market is experiencing robust growth, driven by increasing industrial automation and the rising adoption of Industry 4.0 principles. Smart pneumatic systems, which integrate sensors and IoT-enabled technologies, are transforming traditional pneumatic systems by enabling real-time monitoring, predictive maintenance, and enhanced operational efficiency. These systems are increasingly used across industries such as manufacturing, automotive, food and beverage, and pharmaceuticals to improve productivity and reduce downtime. A key trend in this market is the rising emphasis on energy efficiency. Smart pneumatics optimize air consumption and identify leaks, contributing to reduced energy costs and sustainability goals. Another significant trend is the integration of advanced analytics and AI, allowing users to predict equipment failures before they occur. This not only enhances machine uptime but also minimizes repair costs. Additionally, the adoption of wireless technologies in smart pneumatic systems is gaining momentum, simplifying installation and reducing the need for extensive cabling.
The market is also seeing advancements in sensor technology, enabling higher accuracy in monitoring parameters such as pressure, temperature, and flow rate. The increasing demand for compact and lightweight pneumatic systems is further encouraging innovation in system design. Over 75% of industries implementing smart pneumatics report improved operational efficiency and reduced downtime. Furthermore, nearly 60% of companies leveraging predictive maintenance through smart pneumatics have seen significant reductions in maintenance costs. The growth of this market is supported by government initiatives promoting smart manufacturing and the rising need for automation in emerging economies. However, challenges such as high initial investment and concerns over data security in IoT-enabled systems may act as barriers. Nonetheless, the ongoing technological advancements and the increasing shift toward smart factories ensure a positive outlook for the smart pneumatic market.
MARKET DYNAMICS
DRIVERS
- The increasing demand for industrial automation is driving the adoption of smart pneumatic systems, as they enhance efficiency, precision, and reliability while supporting real-time monitoring and predictive maintenance.
The growing demand for industrial automation is a key driver propelling the adoption of smart pneumatic systems across various industries. As manufacturing processes become increasingly complex, the need for efficient, precise, and reliable operations has surged, leading companies to invest in advanced automation technologies. Smart pneumatics, with their ability to monitor, control, and optimize operations through real-time data, are becoming integral to modern industrial setups. These systems enhance productivity by reducing human intervention, minimizing errors, and ensuring consistent output quality.
Moreover, industries such as automotive, electronics, and pharmaceuticals are leveraging automation to meet rising production demands while maintaining stringent quality standards. Smart pneumatic systems contribute to this by enabling seamless integration with IoT platforms and Industry 4.0 frameworks, offering predictive maintenance capabilities and reducing downtime. Their energy-efficient designs also align with the growing focus on sustainability in industrial operations, further enhancing their appeal. Additionally, the ability of smart pneumatics to provide real-time diagnostics and analytics helps businesses streamline workflows and achieve cost savings. As industries continue to prioritize automation for operational excellence and competitive advantage, the demand for smart pneumatic systems is expected to witness robust growth, cementing their role in the future of industrial automation.
RESTRAIN
- High initial investment costs for smart pneumatic systems and IoT integration can be a significant barrier for small and medium enterprises (SMEs) with limited budgets.
The adoption of smart pneumatic systems faces a significant challenge in the form of high initial investment costs. These systems require advanced components such as IoT-enabled sensors, actuators, and data analytics platforms, which increase their upfront expenses compared to traditional pneumatic systems. For small and medium enterprises (SMEs), this can be a substantial barrier, as they often operate under tight budgets and may lack the financial flexibility to invest in such advanced technologies. Additionally, the costs associated with integrating these systems into existing infrastructure, along with training personnel to operate and maintain them, further escalate the total investment. While larger organizations with higher capital reserves can justify these costs due to long-term operational efficiencies, SMEs often struggle to achieve the same economies of scale. As a result, the high initial investment requirement acts as a major restraint, limiting the widespread adoption of smart pneumatic technologies across smaller enterprises.
KEY SEGMENTATION ANALYSIS
By Component
The Software and Services segment dominated with the market share over 62% in 2023. This dominance is attributed to the critical role that software solutions and associated services play in enabling real-time monitoring, predictive maintenance, and seamless integration of pneumatic systems with IoT platforms. As industries increasingly adopt automation and data-driven decision-making, the demand for advanced software tools to analyze system performance, optimize energy consumption, and reduce downtime has surged. Services such as system integration, training, and maintenance further enhance operational efficiency, making them essential components in the smart pneumatic ecosystem.
By Type
The Smart Pneumatic Actuators segment dominated with the market share of over 42% in 2023, due to its extensive applications across industries such as manufacturing, automotive, and oil & gas. These actuators enhance operational efficiency by offering precise motion control, reduced energy consumption, and real-time performance monitoring through advanced sensors and IoT integration. The growing focus on automation and predictive maintenance further bolsters the demand for smart pneumatic actuators, making them a preferred choice for industrial applications. Their ability to seamlessly integrate into existing systems and provide cost-effective solutions adds to their widespread adoption.
KEY REGIONAL ANALYSIS
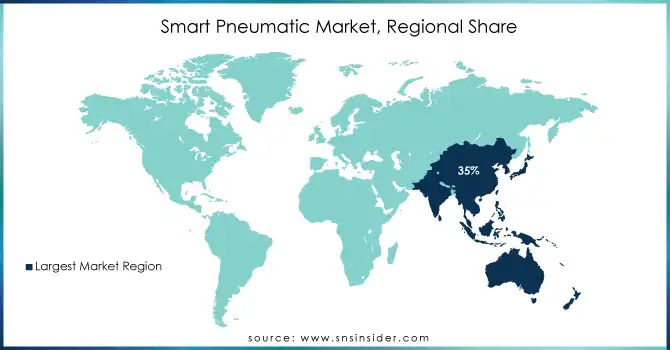
Asia-Pacific region dominated with a market share of over 35% in 2023, driven by its expansive industrial base and rapid technological advancements. Countries like China, Japan, and India play a pivotal role, in leveraging advanced manufacturing systems and automation technologies to enhance operational efficiency and productivity. The region's ongoing industrialization and infrastructure development projects, coupled with the increasing adoption of Industry 4.0 technologies such as IoT and smart manufacturing solutions, have significantly accelerated the demand for smart pneumatics. Additionally, Asia-Pacific benefits from the presence of key global and regional manufacturers, who capitalize on the region's cost-effective production capabilities and abundant resources.
North America is rapidly emerging as the fastest-growing region in the Smart Pneumatic Market, driven by the increasing demand for automation and energy-efficient systems across industries such as automotive, aerospace, and manufacturing. The region’s robust focus on technological advancements and research and development has significantly boosted the adoption of smart pneumatics. The integration of IoT and Industry 4.0 technologies has further accelerated growth, enabling real-time monitoring, predictive maintenance, and enhanced operational efficiency. Governments and industries are also prioritizing sustainability, which has led to a rising demand for energy-efficient solutions.
Do You Need any Customization Research on Smart Pneumatic Market - Inquire Now
Key Players
-
Emerson Electric Co. (Smart pneumatic valves, actuators, controllers)
-
Festo AG & Co. KG (Pneumatic control systems, smart sensors, and actuators)
-
Parker Hannifin Corporation (Smart proportional valves, pneumatic actuators)
-
Bimba Manufacturing Co. (Smart air cylinders, position-sensing actuators)
-
Rotork plc (Intelligent pneumatic actuators, valve controllers)
-
Metso Corporation (Valve automation solutions, intelligent positioners)
-
Thomson Industries, Inc. (Linear actuators with integrated intelligence)
-
SMC Corporation (Smart control valves, pneumatic motion controllers)
-
Bosch Rexroth AG (Pneumatic automation systems, connected sensors)
-
Norgren (IMI plc) (Smart valve islands, condition monitoring systems)
-
Schneider Electric SE (Integrated pneumatic control systems)
-
Aventics GmbH (IoT-enabled pneumatic components, control systems)
-
Camozzi Automation S.p.A. (Smart pneumatic actuators, valves with integrated diagnostics)
-
CKD Corporation (IoT-compatible valves, smart cylinders)
-
Yokogawa Electric Corporation (Pneumatic control solutions with IoT integration)
-
AirTAC International Group (Pneumatic control valves, IoT-enabled actuators)
-
Hafner Pneumatics (Smart valve terminals and actuators)
-
SMAC Corporation (High-performance pneumatic actuators with feedback systems)
-
Bürkert Fluid Control Systems (Smart pneumatic control valves and systems)
-
ABB Ltd. (Pneumatic automation products with IoT capabilities)
Suppliers for (smart actuators, valves, and air preparation systems with IoT integration) of Smart Pneumatic Market
-
Festo AG & Co. KG
-
SMC Corporation
-
Emerson Electric Co.
-
Bosch Rexroth AG
-
Parker Hannifin Corporation
-
Norgren (IMI Precision Engineering)
-
Bimba Manufacturing Company
-
Aventics (A Bosch Rexroth Brand)
-
Schneider Electric
-
Siemens AG
Recent Developments
-
In November 18, 2024: Festo introduced an innovative lineup of safety products at Automation Fair, featuring its advanced CIP safety module. This module is specifically designed to enhance the safe operation of pneumatic systems while reducing the risks of injuries, system failures, and product damage.
-
In September 2023: Festo unveiled its new distributed I/O solution, CPX-AP-A, at Pack Expo 2023. With the addition of CPX-AP-A to its existing CPX-AP-I decentralized I/O system, Festo now provides an unparalleled range of electric and pneumatic automation solutions in North America, offering superior performance, flexibility, cost efficiency, and enhanced engineering productivity.
| Report Attributes | Details |
|---|---|
| Market Size in 2023 | USD 4.59 Billion |
| Market Size by 2032 | USD 8.13 Billion |
| CAGR | CAGR of 6.55% From 2024 to 2032 |
| Base Year | 2023 |
| Forecast Period | 2024-2032 |
| Historical Data | 2020-2022 |
| Report Scope & Coverage | Market Size, Segments Analysis, Competitive Landscape, Regional Analysis, DROC & SWOT Analysis, Forecast Outlook |
| Key Segments | • By Component (Hardware, Software and Services) • By Type (Smart Pneumatic Valves, Smart Pneumatic Actuators, Smart Pneumatic Modules) • By Industry (Oil & Gas, Energy & Power, Water & Wastewater, Automotive, Semiconductor, Food & Beverage, Others [Pharmaceuticals, Chemicals, and Metal & Mining]) |
| Regional Analysis/Coverage | North America (US, Canada, Mexico), Europe (Eastern Europe [Poland, Romania, Hungary, Turkey, Rest of Eastern Europe] Western Europe] Germany, France, UK, Italy, Spain, Netherlands, Switzerland, Austria, Rest of Western Europe]), Asia Pacific (China, India, Japan, South Korea, Vietnam, Singapore, Australia, Rest of Asia Pacific), Middle East & Africa (Middle East [UAE, Egypt, Saudi Arabia, Qatar, Rest of Middle East], Africa [Nigeria, South Africa, Rest of Africa], Latin America (Brazil, Argentina, Colombia, Rest of Latin America) |
| Company Profiles | Emerson Electric Co., Festo AG & Co. KG, Parker Hannifin Corporation, Bimba Manufacturing Co., Rotork plc, Metso Corporation, Thomson Industries, Inc., SMC Corporation, Bosch Rexroth AG, Norgren (IMI plc), Schneider Electric SE, Aventics GmbH, Camozzi Automation S.p.A., CKD Corporation, Yokogawa Electric Corporation, AirTAC International Group, Hafner Pneumatics, SMAC Corporation, Bürkert Fluid Control Systems, ABB Ltd. |
| Key Drivers | • The increasing demand for industrial automation is driving the adoption of smart pneumatic systems, as they enhance efficiency, precision, and reliability while supporting real-time monitoring and predictive maintenance. |
| RESTRAINTS | • High initial investment costs for smart pneumatic systems and IoT integration can be a significant barrier for small and medium enterprises (SMEs) with limited budgets. |
Get in Touch
