Smart Ticketing Market Size & Overview:
Get more information on Smart Ticketing Market - Request Free Sample Report
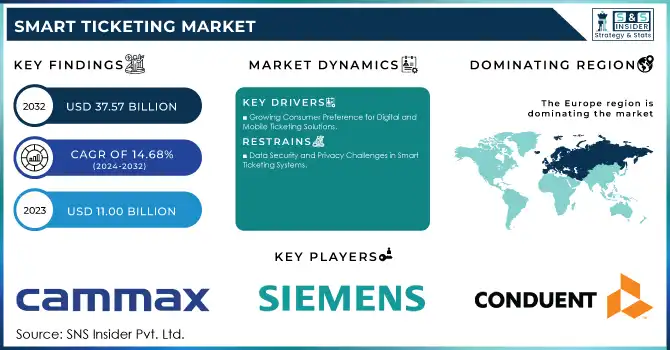
Smart Ticketing Market was valued at USD 13.94 billion in 2025E and is expected to reach USD 41.70 billion by 2033, growing at a CAGR of 14.68% from 2026-2033.
The growth of the smart ticketing market is driven by rising adoption of contactless payment systems, increasing urbanization and public transport usage, government-led smart city initiatives, and demand for seamless, cashless travel experiences. Advancements in NFC, mobile ticketing, and cloud-based fare management further support scalability, operational efficiency, and enhanced passenger convenience.
Smart Ticketing Market Size and Forecast
-
Market Size in 2025E: USD 13.94 Billion
-
Market Size by 2033: USD 41.70 Billion
-
CAGR: 14.68% from 2026 to 2033
-
Base Year: 2025E
-
Forecast Period: 2026–2033
-
Historical Data: 2022–2024
Smart Ticketing Market Trends
-
Rising demand for contactless, cashless, and convenient travel experiences is driving the smart ticketing market.
-
Growing adoption across public transportation, events, and parking systems is boosting market growth.
-
Expansion of NFC, QR codes, mobile wallets, and smart cards is enhancing ticketing efficiency and user convenience.
-
Increasing focus on reducing fraud, improving fare collection, and optimizing passenger flow is shaping adoption trends.
-
Integration with mobile apps, cloud platforms, and real-time data analytics is improving system performance.
-
Advancements in interoperability and multimodal transport integration are supporting seamless travel experiences.
-
Collaborations between transport authorities, technology providers, and payment companies are accelerating innovation and global deployment.
Smart Ticketing Market Growth Drivers:
- Growing Consumer Preference for Digital and Mobile Ticketing Solutions
As consumers increasingly embrace digital and mobile-first experiences, there is a growing demand for smart ticketing solutions. The convenience of electronic ticketing, accessible through smartphones, apps, and digital wallets, makes it more attractive for users who seek seamless, efficient access to services. This shift is driven by the widespread adoption of mobile technology, allowing individuals to manage tickets without the hassle of physical cards or paper tickets. Additionally, the ease of real-time updates, instant ticket purchasing, and the ability to store multiple tickets on a single device contribute to enhanced user satisfaction. As consumers prioritize convenience, speed, and digital integration in their daily lives, smart ticketing solutions are rapidly becoming the preferred choice in sectors like transportation, entertainment, and events.
- Significant Cost Savings and Enhanced Operational Efficiency for Operators
Smart ticketing offers businesses and transportation operators significant cost reductions by eliminating the need for traditional ticketing systems, such as printing, distributing, and handling physical tickets. This shift lowers operational expenses related to ticket production, staff management, and maintenance of physical infrastructure. Additionally, digital ticketing systems streamline the ticket validation process, reducing queues and waiting times, and leading to improved customer satisfaction. The use of real-time data also enables operators to monitor and manage crowd flow, optimizing resources and preventing bottlenecks. With better crowd management and automated processes, smart ticketing solutions improve operational efficiency, reduce human error, and enhance scalability for growing demand. As operators seek cost-effective and streamlined solutions, the financial and logistical benefits of smart ticketing become a compelling reason for widespread adoption.
Smart Ticketing Market Restraints:
- Data Security and Privacy Challenges in Smart Ticketing Systems
The digital nature of smart ticketing systems creates significant concerns regarding data security and user privacy. As these systems handle sensitive personal information, such as payment details and travel preferences, they become potential targets for cyberattacks. Hackers and data breaches can compromise user data, leading to a loss of trust among consumers. This can undermine the confidence needed for the widespread adoption of smart ticketing solutions. Additionally, concerns around the storage, handling, and sharing of personal information can make consumers wary of transitioning from traditional ticketing methods to digital solutions. As a result, businesses must invest heavily in robust security measures and ensure compliance with privacy regulations to reassure users and protect their data, which can increase operational costs and slow down market growth.
Smart Ticketing Market Segment Analysis
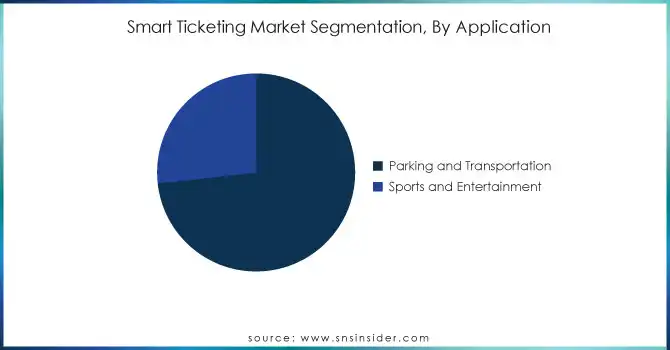
By Application, Parking and Transportation dominated the Smart Ticketing Market, while Sports and Entertainment is expected to grow fastest
The Parking and Transportation segment led the Smart Ticketing Market in 2025, holding around 73% of the revenue share. This dominance is driven by the increasing adoption of smart ticketing solutions for public transit and parking services. The ability to streamline payment processes, reduce operational costs, and enhance user experience has made digital ticketing a preferred choice for transportation operators and consumers alike. As urbanization and smart city initiatives grow, the demand for such solutions continues to rise.
The Sports and Entertainment segment is projected to grow at the fastest CAGR of about 16.68% from 2026 to 2033. This rapid growth is fueled by the rising demand for seamless, contactless ticketing experiences in events and sports venues. The shift towards mobile ticketing and digital solutions helps improve security, speed up entry processes, and offer personalized experiences. As sports organizations and entertainment venues embrace these technologies, the segment's growth is expected to accelerate.
By Offering, Smart Cards led the Smart Ticketing Market, with Ticket Validators projected as the fastest-growing offering
The Smart Cards segment dominated the Smart Ticketing Market in 2025, accounting for approximately 37% of the revenue share. This dominance is driven by the widespread adoption of contactless smart cards in public transportation systems, where they offer ease of use, security, and cost efficiency. Smart cards provide a reliable, secure, and convenient way for users to access services, making them the preferred choice for commuters and transit operators alike. Their established presence and reliability continue to maintain their lead in the market.
The Ticket Validators segment is projected to grow at the fastest CAGR of about 17.03% from 2026 to 2033. This rapid growth is driven by the increasing need for advanced validation systems in various transport and event sectors. Ticket validators enable smooth, real-time ticket verification, reducing wait times and improving operational efficiency. As industries seek to enhance security and streamline entry processes, the demand for high-tech ticket validation solutions is expected to rise sharply, fueling the segment’s rapid expansion.
By Technology, Radio Frequency Identification dominated the Smart Ticketing Market, while Near Field Communication is expected to grow fastest
The Radio Frequency Identification segment led the Smart Ticketing Market in 2025, capturing approximately 34% of the revenue share. RFID technology has become the dominant choice for ticketing due to its ability to provide fast, contactless, and secure transactions. Widely used in transportation systems, RFID tags enable seamless entry and exit, reducing wait times and enhancing the overall user experience. Its established infrastructure and high reliability across various industries continue to drive its market dominance.
The Near Field Communication segment is expected to grow at the fastest CAGR of about 16.44% from 2026 to 2033. Near Field Communication technology allows for faster and more secure ticketing through mobile devices, providing a seamless, contactless experience for users. With the increasing popularity of smartphones and mobile wallets, NFC's ability to facilitate instant ticket purchases and access is gaining momentum. As consumers demand more convenient and secure payment solutions, Near Field Communication’s rapid adoption is poised to drive significant growth in the coming years.
Smart Ticketing Market Regional Analysis
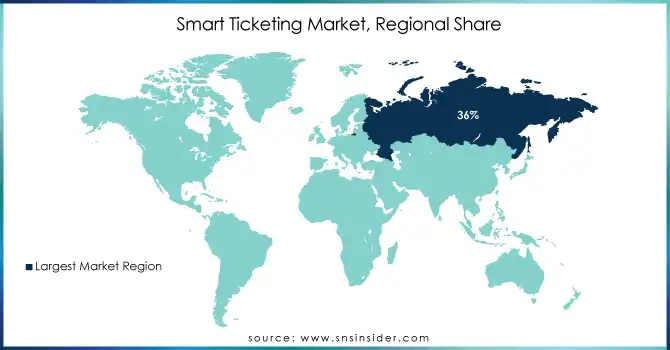
Europe Smart Ticketing Market Insights
Europe dominated the Smart Ticketing Market in 2023, holding approximately 36% of the revenue share. This is primarily due to the region's advanced infrastructure and early adoption of digital ticketing solutions, particularly in public transportation. European cities have invested heavily in smart city initiatives, integrating seamless and contactless ticketing systems that cater to the increasing demand for efficiency and convenience. The established market maturity and technological integration in countries like the UK, Germany, and France continue to solidify Europe's leadership in the sector.
Asia Pacific Smart Ticketing Market Insights
Asia Pacific is projected to grow at the fastest CAGR of about 17.57% from 2024 to 2032. The rapid urbanization, technological advancements, and rising smartphone penetration in countries like China, India, and Japan are key drivers of this growth. With increasing investments in smart transportation infrastructure and growing demand for efficient, digital solutions, the region is witnessing a strong push toward smart ticketing adoption. As Asia Pacific cities continue to modernize and digitize their transit systems, the market for smart ticketing solutions is expected to expand rapidly.
North America Smart Ticketing Market Insights
The North America smart ticketing market is supported by advanced public transportation infrastructure, high adoption of contactless and mobile payment technologies, and strong digitalization across transit networks. Transit authorities increasingly deploy NFC-based cards, mobile ticketing apps, and integrated fare systems to improve passenger experience, reduce operational costs, and enhance data-driven mobility planning.
Middle East & Africa and Latin America Smart Ticketing Market Insights
The Middle East & Africa and Latin America smart ticketing markets are gaining momentum due to expanding urban transit networks and increasing investments in smart mobility projects. Governments and transport authorities are adopting contactless cards and mobile ticketing to modernize fare collection, reduce cash handling, and improve commuter efficiency, supported by rising smartphone penetration and digital payment adoption.
Need any customization research on Smart Ticketing Market - Enquiry Now
KEY PLAYERS
-
Conduent, Inc. (Mobile Ticketing Solutions, Fare Collection Systems)
-
Siemens (Ticket Vending Machines, Smart Ticketing Solutions)
-
Cammax Ltd (Ticketing Kiosks, Mobile Payment Solutions)
-
Infineon Technologies AG (Smart Cards, Contactless Payment Solutions)
-
HID Global Corporation (Smart Cards, Mobile Access Solutions)
-
Hitachi Rail Limited (Ticket Validation Systems, Fare Collection Solutions)
-
Masabi Ltd (Mobile Ticketing, Fare Collection Systems)
-
NXP Semiconductors (Contactless Payment Cards, Smart Ticketing Chips)
-
Giesecke+Devrient GmbH (Smart Cards, Secure Ticketing Solutions)
-
Cubic Corporation (Ticket Vending Machines, Smart Fare Collection Solutions)
-
Confidex Ltd. (Smart Ticketing Tags, Contactless Cards)
-
ASK (Smart Cards, Ticketing Solutions)
-
Gemalto NV (Smart Cards, Mobile Ticketing Solutions)
-
Xerox Corporation (Ticket Vending Machines, Ticketing Software)
-
Inside Secure (Contactless Payment Cards, Smart Ticketing Solutions)
-
Smart Card IT Solutions (Smart Ticketing Software, Fare Collection Systems)
-
Paragon ID (Smart Cards, Ticketing Solutions)
-
CGI Group (Ticketing Systems, Smart City Solutions)
-
Indra Sistemas (Smart Ticketing Systems, Fare Collection Solutions)
-
Scheidt & Bachmann (Ticketing Systems, Smart Fare Collection)
-
ACT (Smart Card Readers, Ticketing Solutions)
-
Atsuke (Mobile Ticketing Solutions, Fare Collection Systems)
-
Corethree (Mobile Ticketing Solutions, Fare Collection Systems)
-
Flowbird Group (Mobile Ticketing, Fare Collection Systems)
| Report Attributes | Details |
|---|---|
| Market Size in 2025E | USD 13.94 Billion |
| Market Size by 2033 | USD 41.70 Billion |
| CAGR | CAGR of 14.68% From 2026 to 2033 |
| Base Year | 2025 |
| Forecast Period | 2026-2033 |
| Historical Data | 2022-2024 |
| Report Scope & Coverage | Market Size, Segments Analysis, Competitive Landscape, Regional Analysis, DROC & SWOT Analysis, Forecast Outlook |
| Key Segments | • By Technology (Near Field Communication (NFC), Radio Frequency Identification (RFID), Quick Response Code (QR Code), Others (Cellular Networks)) • By Offering (Smart Cards, Ticket Validators, Ticketing Machine/Smart Ticketing Kiosk, E-toll, Others (wearables)) • By Application (Parking and Transportation, Sports and Entertainment) • By Component (Hardware, Software, Service) |
| Regional Analysis/Coverage | North America (US, Canada, Mexico), Europe (Eastern Europe [Poland, Romania, Hungary, Turkey, Rest of Eastern Europe] Western Europe] Germany, France, UK, Italy, Spain, Netherlands, Switzerland, Austria, Rest of Western Europe]), Asia Pacific (China, India, Japan, South Korea, Vietnam, Singapore, Australia, Rest of Asia Pacific), Middle East & Africa (Middle East [UAE, Egypt, Saudi Arabia, Qatar, Rest of Middle East], Africa [Nigeria, South Africa, Rest of Africa], Latin America (Brazil, Argentina, Colombia, Rest of Latin America) |
| Company Profiles | Conduent, Inc., Siemens, Cammax Ltd, Infineon Technologies AG, HID Global Corporation, Hitachi Rail Limited, Masabi Ltd, NXP Semiconductors, Giesecke+Devrient GmbH, Cubic Corporation, Confidex Ltd., ASK, Gemalto NV, Xerox Corporation, Inside Secure, Smart Card IT Solutions, Paragon ID, CGI Group, Indra Sistemas, Scheidt & Bachmann, ACT, Atsuke, Corethree, Flowbird Group |
Get in Touch
