image

Solar Highway Market Report Scope & Overview:

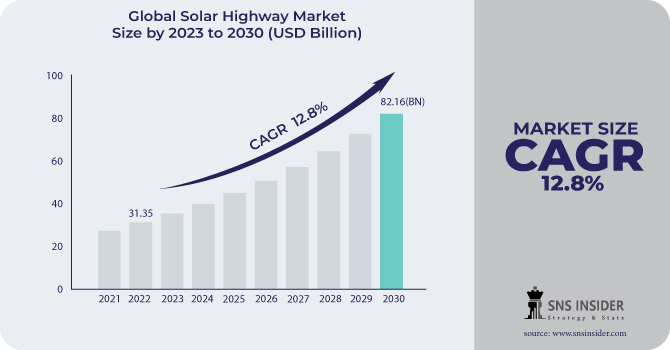
The Solar Highway Market size was valued at USD 31.35 billion in 2022 and is expected to grow to USD 82.16 billion by 2030 and grow at a CAGR of 12.8 % over the forecast period of 2023-2030.

A solar highway uses photovoltaic cells installed on specifically constructed driveways and highways to absorb solar energy. Due to its high manufacturing costs and the scarcity of materials and service suppliers throughout the world, solar highway is a costly technology.

Solar Highway Market

Get More Information on Solar Highway Market - Request Sample Report

The solar highway is a system that combines a driving surface made of transparent sun cells with sensors, electronics, and electronics to work with solar array circuits. Road panels for solar highways are constructed specifically from recycled materials, and the surface of the road is covered with PV cells. The main goal of the development of the solar highway was to use lengthy roads to provide clean, renewable energy. The same solar highway concept may be used for playgrounds, swimming pools, and courtyards. Solar panels are found on solar roads.

MARKET DYNAMICS

KEY DRIVERS:  

  • Growing Demand for Renewable Energy

  • Increasing concern for environment

Due to substantial developments in solar technology and rising demand for renewable energy sources, particularly solar energy, the solar highway industry is anticipated to grow rapidly in the next years also, enhanced R&D from large corporations.

RESTRAIN:

  • Cost of making is very High

  • Repairing of Solar panels is costly

OPPORTUNITY: 

  • Increasing research activities

  • Increasing fund and FDI investments

Growing funding, research activity, and FDI investment Highways for solar energy, particularly in France, the U.S., and China, are expected to present major opportunities for solar energy makers.

CHALLENGES:

  • The cost of producing unique type surface panels made of glass is relatively expensive

IMPACT OF RUSSIAN UKRAINE WAR

The world solar business has been significantly impacted by the Russia-Ukraine conflict. Both nations are significant players in the solar sector, with Russia and Ukraine each contributing around 3% and 8%, respectively, of worldwide output. Prices for both raw materials and finished goods have increased, disrupting many firms' supply chains. Since both nations are key players in the wind and solar sectors, the war has also had a significant negative impact on the renewable energy industry. Prices for both raw materials and completed goods have increased significantly as a result of the fighting, which has also affected the supply chain for many firms. This has impacted the remainder of the renewable energy industry.Top of Form

IMPACT OF ONGOING RECESSION

The capacity of many nations to deliver alternative energy sources to the rural poor, who now rely on conventional fuels, is likely to be delayed by the economic recession. They will have to rely increasingly more on their conventional energy sources as these places' populations and energy needs grow. When extra energy might have been produced using renewable energy sources like hydropower, solar power, and wind power instead of cutting down more trees, the outcome will be carbon emissions. The present recession is also likely to hurt the environment and the underprivileged in this way.
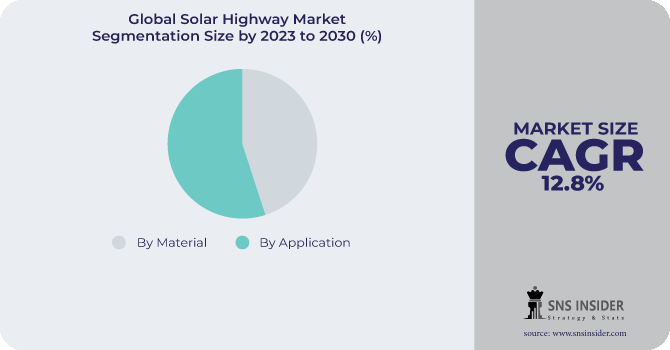
KEY MARKET SEGMENTS

By Material

  • Monocrystalline Silicon

  • Polycrystalline Silicon

By Application

  • Driveways
  • Parking Lots

Solar Highway Market

Get Customised Report as per Your Business Requirement - Enquiry Now

REGIONAL ANALYSIS

The Asia Pacific solar highway market is anticipated to grow quickly throughout the forecast period. During the projected period, rising power consumption in China, Japan, and South Korea is anticipated to drive up demand for solar highway.

Additionally, the building and construction industry in developing nations in Asia Pacific, including China, India, Indonesia, and Vietnam, is expected to see an increase in demand for solar photovoltaic panels for parking lots, creating lucrative opportunities for regional solar highway providers.

During the projection period, Europe is anticipated to trail Asia Pacific in terms of market share for solar highways due to increased R&D spending in the sector.

REGIONAL COVERAGE:

North America

  • US

  • Canada

  • Mexico

Europe

  • Eastern Europe

    • Poland

    • Romania

    • Hungary

    • Turkey

    • Rest of Eastern Europe

  • Western Europe

    • Germany

    • France

    • UK

    • Italy

    • Spain

    • Netherlands

    • Switzerland

    • Austria

    • Rest of Western Europe

Asia Pacific

  • China

  • India

  • Japan

  • South Korea

  • Vietnam

  • Singapore

  • Australia

  • Rest of Asia Pacific

Middle East & Africa

  • Middle East

    • UAE

    • Egypt

    • Saudi Arabia

    • Qatar

    • Rest of Middle East

  • Africa

    • Nigeria

    • South Africa

    • Rest of Africa

Latin America

  • Brazil

  • Argentina

  • Colombia

  • Rest of Latin America

RECENT DEVELOPMENT

  • PLI was not the only proposal made by MNRE in 2021; a Basic Customs beginning on April 1, 2022 (BCD). For the import of cells, BCD would apply in the amounts of 25% and 40%, respectively. Here is a substantial tax that might make domestically produced modules competitive with or even less expensive than imported goods. The BCD has not yet taken effect, and it is highly probable that once it does, solar project costs and LCOE will rise. It is unclear if this will cause deployments to be delayed in 2022 and 2023 since entirely locally produced modules won't yet be accessible in large enough numbers.

KEY PLAYERS 

Solar Roadways Inc., Shandong Pavenergy, Wattway, Canadian Solar Inc., Colas Group, Onyx Solar Energy, Photovaltaic Pavement, Tolar HashNet, Road Energy Systems, TGD Solar, Electreon, SolaRoad Inc., ‘SunPower Corporation, TsO, Esolar Inc., Wuxi Suntech Power Co. Ltd., and other players are listed in a final report.

Shandong Pavenergy-Company Financial Analysis

Company Landscape Analysis

Solar Highway Market Report Scope:
Report Attributes Details
Market Size in 2022  US$ 31.35 Bn
Market Size by 2030  US$ 82.16 Bn
CAGR   CAGR of 12.8 % From 2023 to 2030
Base Year 2022
Forecast Period  2023-2030
Historical Data  2020-2021
Report Scope & Coverage Market Size, Segments Analysis, Competitive  Landscape, Regional Analysis, DROC & SWOT Analysis, Forecast Outlook
Key Segments • By Material (Monocrystalline Silicon, Polycrystalline Silicon)
• By Application (Driveways, Parking Lots)
Regional Analysis/Coverage North America (US, Canada, Mexico), Europe (Eastern Europe [Poland, Romania, Hungary, Turkey, Rest of Eastern Europe] Western Europe] Germany, France, UK, Italy, Spain, Netherlands, Switzerland, Austria, Rest of Western Europe]). Asia Pacific (China, India, Japan, South Korea, Vietnam, Singapore, Australia, Rest of Asia Pacific), Middle East & Africa (Middle East [UAE, Egypt, Saudi Arabia, Qatar, Rest of Middle East], Africa [Nigeria, South Africa, Rest of Africa], Latin America (Brazil, Argentina, Colombia Rest of Latin America)
Company Profiles Solar Roadways Inc., Shandong Pavenergy, Wattway, Canadian Solar Inc., Colas Group, Onyx Solar Energy, Photovaltaic Pavement, Tolar HashNet, Road Energy Systems, TGD Solar, Electreon, SolaRoad Inc., ‘SunPower Corporation, TsO, Esolar Inc., Wuxi Suntech Power Co. Ltd.
Key Drivers • Growing Demand for Renewable Energy
• Increasing concern for environment
Market Restraints • Cost of making is very High
• Repairing of Solar panels is costly


Frequently Asked Questions

Ans: Solar Highway Market is anticipated to expand by 12.8 % from 2023 to 2030.

Ans:  USD 82.16 billion is expected to grow by 2030.

Ans: Solar Highway Market size was valued at USD 31.35 billion in 2022

Ans: The Asia Pacific solar highway market is anticipated to grow quickly throughout the forecast period.

Ans: Increasing research activities and Increasing fund and FDI investments.

TABLE OF CONTENT

1. Introduction
1.1 Market Definition
1.2 Scope
1.3 Research Assumptions

2. Research Methodology

3. Market Dynamics
3.1 Drivers
3.2 Restraints
3.3 Opportunities
3.4 Challenges

4. Impact Analysis
4.1 Impact of the Russia-Ukraine War
4.2 Impact of Ongoing Recession
4.2.1 Introduction
4.2.2 Impact on major economies
4.2.2.1 US
4.2.2.2 Canada
4.2.2.3 Germany
4.2.2.4 France
4.2.2.5 United Kingdom
4.2.2.6 China
4.2.2.7 Japan
4.2.2.8 South Korea
4.2.2.9 Rest of the World

5. Value Chain Analysis

6. Porter’s 5 forces model

7. PEST Analysis

8. Solar Highway Market Segmentation, By Material
8.1 Monocrystalline Silicon
8.2 Polycrystalline Silicon

9. Solar Highway Market Segmentation, By Application
9.1 Driveways
9.2 Parking Lots

10. Regional Analysis
10.1 Introduction
10.2 North America
10.2.1 North America Solar Highway Market by Country
10.2.2North America Solar Highway Market by Material
10.2.3 North America Solar Highway Market by Application
10.2.4 USA
10.2.4.1 USA Solar Highway Market by Material
10.2.4.2 USA Solar Highway Market by Application
10.2.5 Canada
10.2.5.1 Canada Solar Highway Market by Material
10.2.5.2 Canada Solar Highway Market by Application
10.2.6 Mexico
10.2.6.1 Mexico Solar Highway Market by Material
10.2.6.2 Mexico Solar Highway Market by Application
10.3 Europe
10.3.1 Eastern Europe
10.3.1.1 Eastern Europe Solar Highway Market by Country
10.3.1.2 Eastern Europe Solar Highway Market by Material
10.3.1.3 Eastern Europe Solar Highway Market by Application
10.3.1.4 Poland
10.3.1.4.1 Poland Solar Highway Market by Material
10.3.1.4.2 Poland Solar Highway Market by Application
10.3.1.5 Romania
10.3.1.5.1 Romania Solar Highway Market by Material
10.3.1.5.2 Romania Solar Highway Market by Application
10.3.1.6 Hungary
10.3.1.6.1 Hungary Solar Highway Market by Material
10.3.1.6.2 Hungary Solar Highway Market by Application
10.3.1.7 Turkey
10.3.1.7.1 Turkey Solar Highway Market by Material
10.3.1.7.2 Turkey Solar Highway Market by Application
10.3.1.8 Rest of Eastern Europe
10.3.1.8.1 Rest of Eastern Europe Solar Highway Market by Material
10.3.1.8.2 Rest of Eastern Europe Solar Highway Market by Application
10.3.2 Western Europe
10.3.2.1 Western Europe Solar Highway Market by Country
10.3.2.2 Western Europe Solar Highway Market by Material
10.3.2.3 Western Europe Solar Highway Market by Application
10.3.2.4 Germany
10.3.2.4.1 Germany Solar Highway Market by Material
10.3.2.4.2 Germany Solar Highway Market by Application
10.3.2.5 France
10.3.2.5.1 France Solar Highway Market by Material
10.3.2.5.2 France Solar Highway Market by Application
10.3.2.6 UK
10.3.2.6.1 UK Solar Highway Market by Material
10.3.2.6.2 UK Solar Highway Market by Application
10.3.2.7 Italy
10.3.2.7.1 Italy Solar Highway Market by Material
10.3.2.7.2 Italy Solar Highway Market by Application
10.3.2.8 Spain
10.3.2.8.1 Spain Solar Highway Market by Material
10.3.2.8.2 Spain Solar Highway Market by Application
10.3.2.9 Netherlands
10.3.2.9.1 Netherlands Solar Highway Market by Material
10.3.2.9.2 Netherlands Solar Highway Market by Application
10.3.2.10 Switzerland
10.3.2.10.1 Switzerland Solar Highway Market by Material
10.3.2.10.2 Switzerland Solar Highway Market by Application
10.3.2.11 Austria
10.3.2.11.1 Austria Solar Highway Market by Material
10.3.2.11.2 Austria Solar Highway Market by Application
10.3.2.12 Rest of Western Europe
10.3.2.12.1 Rest of Western Europe Solar Highway Market by Material
10.3.2.12.2 Rest of Western Europe Solar Highway Market by Application
10.4 Asia-Pacific
10.4.1 Asia Pacific Solar Highway Market by Country
10.4.2 Asia Pacific Solar Highway Market by Material
10.4.3 Asia Pacific Solar Highway Market by Application
10.4.4 China
10.4.4.1 China Solar Highway Market by Material
10.4.4.2 China Solar Highway Market by Application
10.4.5 India
10.4.5.1 India Solar Highway Market by Material
10.4.5.2 India Solar Highway Market by Application
10.4.6 Japan
10.4.6.1 Japan Solar Highway Market by Material
10.4.6.2 Japan Solar Highway Market by Application
10.4.7 South Korea
10.4.7.1 South Korea Solar Highway Market by Material
10.4.7.2 South Korea Solar Highway Market by Application
10.4.8 Vietnam
10.4.8.1 Vietnam Solar Highway Market by Material
10.4.8.2 Vietnam Solar Highway Market by Application
10.4.9 Singapore
10.4.9.1 Singapore Solar Highway Market by Material
10.4.9.2 Singapore Solar Highway Market by Application
10.4.10 Australia
10.4.10.1 Australia Solar Highway Market by Material
10.4.10.2 Australia Solar Highway Market by Application
10.4.11 Rest of Asia-Pacific
10.4.11.1 Rest of Asia-Pacific Solar Highway Market by Material
10.4.11.2 Rest of Asia-Pacific APAC Solar Highway Market by Application
10.5 Middle East & Africa
10.5.1 Middle East
10.5.1.1 Middle East Solar Highway Market by Country
10.5.1.2 Middle East Solar Highway Market by Material
10.5.1.3 Middle East Solar Highway Market by Application
10.5.1.4 UAE
10.5.1.4.1 UAE Solar Highway Market by Material
10.5.1.4.2 UAE Solar Highway Market by Application
10.5.1.5 Egypt
10.5.1.5.1 Egypt Solar Highway Market by Material
10.5.1.5.2 Egypt Solar Highway Market by Application
10.5.1.6 Saudi Arabia
10.5.1.6.1 Saudi Arabia Solar Highway Market by Material
10.5.1.6.2 Saudi Arabia Solar Highway Market by Application
10.5.1.7 Qatar
10.5.1.7.1 Qatar Solar Highway Market by Material
10.5.1.7.2 Qatar Solar Highway Market by Application
10.5.1.8 Rest of Middle East
10.5.1.8.1 Rest of Middle East Solar Highway Market by Material
10.5.1.8.2 Rest of Middle East Solar Highway Market by Application
10.5.2 Africa
10.5.2.1 Africa Solar Highway Market by Country
10.5.2.2 Africa Solar Highway Market by Material
10.5.2.3 Africa Solar Highway Market by Application
10.5.2.4 Nigeria
10.5.2.4.1 Nigeria Solar Highway Market by Material
10.5.2.4.2 Nigeria Solar Highway Market by Application
10.5.2.5 South Africa
10.5.2.5.1 South Africa Solar Highway Market by Material
10.5.2.5.2 South Africa Solar Highway Market by Application
10.5.2.6 Rest of Africa
10.5.2.6.1 Rest of Africa Solar Highway Market by Material
10.5.2.6.2 Rest of Africa Solar Highway Market by Application
10.6 Latin America
10.6.1 Latin America Solar Highway Market by Country
10.6.2 Latin America Solar Highway Market by Material
10.6.3 Latin America Solar Highway Market by Application
10.6.4 Brazil
10.6.4.1 Brazil Solar Highway Market by Material
10.6.4.2 Brazil Africa Solar Highway Market by Application
10.6.5 Argentina
10.6.5.1 Argentina Solar Highway Market by Material
10.6.5.2 Argentina Solar Highway Market by Application
10.6.6 Colombia
10.6.6.1 Colombia Solar Highway Market by Material
10.6.6.2 Colombia Solar Highway Market by Application
10.6.7 Rest of Latin America
10.6.7.1 Rest of Latin America Solar Highway Market by Material
10.6.7.2 Rest of Latin America Solar Highway Market by Application

11 Company Profile
11.1 Solar Roadways Inc.
11.1.1 Company Overview
11.1.2 Financials
11.1.3 Product/Services Offered
11.1.4 SWOT Analysis
11.1.5 The SNS View
11.2 Shandong Pavenergy
11.2.1 Company Overview
11.2.2 Financials
11.2.3 Product/Services Offered
11.2.4 SWOT Analysis
11.2.5 The SNS View
11.3 Wattway
11.3.1 Company Overview
11.3.2 Financials
11.3.3 Product/Services Offered
11.3.4 SWOT Analysis
11.3.5 The SNS View
11.4 Canadian Solar Inc.
11.4 Company Overview
11.4.2 Financials
11.4.3 Product/Services Offered
11.4.4 SWOT Analysis
11.4.5 The SNS View
11.5 Colas Group
11.5.1 Company Overview
11.5.2 Financials
11.5.3 Product/Services Offered
11.5.4 SWOT Analysis
11.5.5 The SNS View
11.6 Onyx Solar Energy
11.6.1 Company Overview
11.6.2 Financials
11.6.3 Product/Services Offered
11.6.4 SWOT Analysis
11.6.5 The SNS View
11.7 Photovaltaic Pavement
11.7.1 Company Overview
11.7.2 Financials
11.7.3 Product/Services Offered
11.7.4 SWOT Analysis
11.7.5 The SNS View
11.8 Tolar HashNet
11.8.1 Company Overview
11.8.2 Financials
11.8.3 Product/Services Offered
11.8.4 SWOT Analysis
11.8.5 The SNS View
11.9 Road Energy Systems
11.9.1 Company Overview
11.9.2 Financials
11.9.3 Product/ Services Offered
11.9.4 SWOT Analysis
11.9.5 The SNS View
11.10 TGD Solar
11.10.1 Company Overview
11.10.2 Financials
11.10.3 Product/Services Offered
11.10.4 SWOT Analysis
11.10.5 The SNS View
11.11 SolaRoad Inc.
11.11.1 Company Overview
11.11.2 Financials
11.11.3 Product/Services Offered
11.11.4 SWOT Analysis
11.11.5 The SNS View
11.12 SunPower Corporation
11.12.1 Company Overview
11.12.2 Financials
11.12.3 Product/Services Offered
11.12.4 SWOT Analysis
11.12.5 The SNS View
11.13 Wuxi Suntech Power Co. Ltd
11.13.1 Company Overview
11.13.2 Financials
11.13.3 Product/Services Offered
11.13.4 SWOT Analysis
11.13.5 The SNS View

12. Competitive Landscape
12.1 Competitive Bench marking
12.2 Market Share Analysis
12.3 Recent Developments
12.3.1 Industry News
12.3.2 Company News
12.3.3 Mergers & Acquisitions

13. USE Cases and Best Practices

14. Conclusion

An accurate research report requires proper strategizing as well as implementation. There are multiple factors involved in the completion of good and accurate research report and selecting the best methodology to compete the research is the toughest part. Since the research reports we provide play a crucial role in any company’s decision-making process, therefore we at SNS Insider always believe that we should choose the best method which gives us results closer to reality. This allows us to reach at a stage wherein we can provide our clients best and accurate investment to output ratio.

Each report that we prepare takes a timeframe of 350-400 business hours for production. Starting from the selection of titles through a couple of in-depth brain storming session to the final QC process before uploading our titles on our website we dedicate around 350 working hours. The titles are selected based on their current market cap and the foreseen CAGR and growth.


The 5 steps process:

Step 1: Secondary Research:

Secondary Research or Desk Research is as the name suggests is a research process wherein, we collect data through the readily available information. In this process we use various paid and unpaid databases which our team has access to and gather data through the same. This includes examining of listed companies’ annual reports, Journals, SEC filling etc. Apart from this our team has access to various associations across the globe across different industries. Lastly, we have exchange relationships with various university as well as individual libraries.

Secondary Research

Step 2: Primary Research

When we talk about primary research, it is a type of study in which the researchers collect relevant data samples directly, rather than relying on previously collected data.  This type of research is focused on gaining content specific facts that can be sued to solve specific problems. Since the collected data is fresh and first hand therefore it makes the study more accurate and genuine.

We at SNS Insider have divided Primary Research into 2 parts.

Part 1 wherein we interview the KOLs of major players as well as the upcoming ones across various geographic regions. This allows us to have their view over the market scenario and acts as an important tool to come closer to the accurate market numbers. As many as 45 paid and unpaid primary interviews are taken from both the demand and supply side of the industry to make sure we land at an accurate judgement and analysis of the market.

This step involves the triangulation of data wherein our team analyses the interview transcripts, online survey responses and observation of on filed participants. The below mentioned chart should give a better understanding of the part 1 of the primary interview.

Primary Research

Part 2: In this part of primary research the data collected via secondary research and the part 1 of the primary research is validated with the interviews from individual consultants and subject matter experts.

Consultants are those set of people who have at least 12 years of experience and expertise within the industry whereas Subject Matter Experts are those with at least 15 years of experience behind their back within the same space. The data with the help of two main processes i.e., FGDs (Focused Group Discussions) and IDs (Individual Discussions). This gives us a 3rd party nonbiased primary view of the market scenario making it a more dependable one while collation of the data pointers.

Step 3: Data Bank Validation

Once all the information is collected via primary and secondary sources, we run that information for data validation. At our intelligence centre our research heads track a lot of information related to the market which includes the quarterly reports, the daily stock prices, and other relevant information. Our data bank server gets updated every fortnight and that is how the information which we collected using our primary and secondary information is revalidated in real time.

Data Bank Validation

Step 4: QA/QC Process

After all the data collection and validation our team does a final level of quality check and quality assurance to get rid of any unwanted or undesired mistakes. This might include but not limited to getting rid of the any typos, duplication of numbers or missing of any important information. The people involved in this process include technical content writers, research heads and graphics people. Once this process is completed the title gets uploader on our platform for our clients to read it.

Step 5: Final QC/QA Process:

This is the last process and comes when the client has ordered the study. In this process a final QA/QC is done before the study is emailed to the client. Since we believe in giving our clients a good experience of our research studies, therefore, to make sure that we do not lack at our end in any way humanly possible we do a final round of quality check and then dispatch the study to the client.

Start a Conversation

Hi! Click one of our member below to chat on Phone