Space Semiconductor Market Report Scope & Overview:
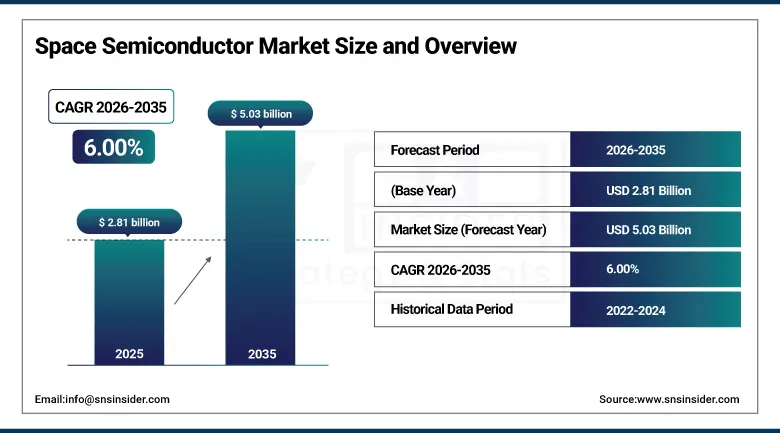
The Space Semiconductor Market was valued at USD 2.81 billion in 2025 and is expected to reach USD 5.03 billion by 2035, growing at a CAGR of 6.00% from 2026–2035.
Global Space Semiconductor Market can be described as the most technologically advanced and critical market segment in the semiconductor market industry. It provides radiation hardened and radiation tolerant components that are vital for satellite, launch vehicle, deep space probe, and manned space craft operations. Space environments are characterized by exposure to extreme levels of radiation in terms of cosmic rays, solar particle event radiation, and radiation from the trapped radiation belt particles that pose serious threats to the integrity of standard semiconductors. Thus, space qualified semiconductors are specifically designed to resist radiation, thermal variations, and long missions' requirements. Some of the semiconductor products include advanced processors, field-programmable gate array (FPGA), memory, sensor, optoelectronics, and power management integrated circuits. The market in 2025 will witness an increase in demand for high-end radiation hardening semiconductors and affordable radiation tolerant semiconductor products due to the growth in commercialization of the low earth orbit satellite constellations and satellite broadband network.
The Market's 6.00% CAGR from 2026 to 2035 reflects the stable but accelerating structural demand created by the commercial LEO satellite constellation buildout that is placing more satellites in orbit faster than any previous era of space exploration. It is combined with the government deep space programme expansion from NASA's Artemis lunar return and Mars mission programmes that require the highest-reliability radiation-hardened components at the frontier of space semiconductor technology. Over 80% of DoD space systems integrate domestically produced radiation-hardened semiconductors for command, control, and navigation, creating a strategic procurement pillar that sustains the market's reliable baseline growth.
Market Size and Forecast
-
Market Size in 2025: USD 2.81 Billion
-
Market Size by 2035: USD 5.03 Billion
-
CAGR: 6.00% from 2026 to 2035
-
Base Year: 2025
-
Forecast Period: 2026–2035
-
Historical Data: 2022–2024
To Get more information on Space Semiconductor Market - Request Free Sample Report
Space Semiconductor Market Trends
-
Expanding LEO satellite constellation projects are increasing demand for cost-efficient radiation-tolerant semiconductors designed for high-volume commercial satellite production and shorter operational mission lifecycles.
-
More satellite manufactures are utilizing silicon photonic systems and optical communication semiconductors that enhance high-speed laser communication between the satellites.
-
The use of radiation-hardened FPGAs and configurable processors is on the increase, especially in satellite avionics, thus allowing software updates to the payload of satellites even after launch.
-
Integration of semiconductor SoC systems into small satellites has resulted in increased integration effectiveness, reduced costs, and less complicated components in satellite constellation deployments.
-
There is more government spending on domestic manufacturing of radiation-tolerant semiconductors in order to improve their supply chains and ensure the growth of national security space infrastructure.
-
Power semiconductors made from gallium nitride and silicon carbide are seeing more use for effective management of satellites’ energy resources and heat generation.
-
New space station facilities and in-space services provide potential markets for semiconductor technology applications beyond conventional space and aerospace vehicles.
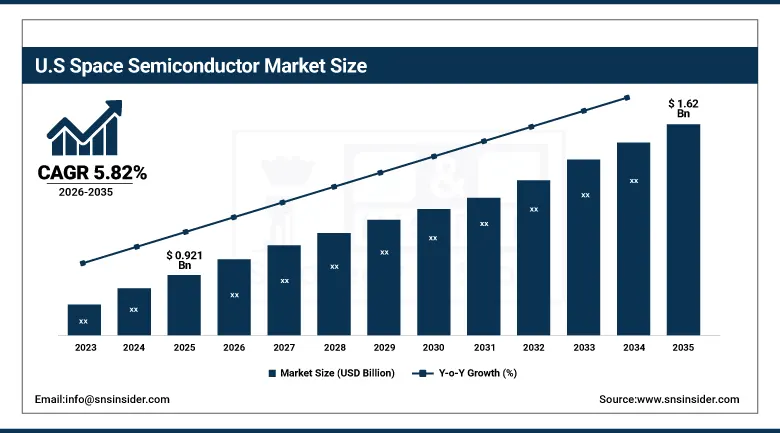
U.S. Space Semiconductor Market was valued at USD 0.921 billion in 2025 and is expected to reach USD 1.62 billion by 2035, registering a CAGR of 5.82% during 2026–2035.
In 2025, the United States led the global Space Semiconductor Market due to the presence of an advanced space exploration ecosystem, high defense budgets, and leadership in satellite deployment. Investments are made in several entities including NASA, the U.S. Space Force, defense organizations, as well as commercial organizations engaged in satellite communication, deep space exploration, and national defense systems. Increased deployments of low-earth orbiting satellites and emerging space exploration activities are expected to boost the adoption of radiation-hardened and radiation-tolerant semiconductor products in the market. Advanced semiconductor manufacturing for space applications is provided within the U.S. as well, where manufacturers take the lead in developing innovative processing units, memory chips, FPGA, and RF communication semiconductors tailored to withstand harsh conditions of space operations.
In the month of August 2025, the company Teledyne e2v showed its revolutionary memory, called as 16 GB radiation-hardened DDR4, created specially for the future missions of satellites. The memory not only possesses increased storage capacity, i.e., 16 GB, but also offers improved speed at 2,400 MT/s. Moreover, the memory is also smaller than before. This example highlights how technological innovations are being developed in the field of space semiconductors in the USA.
Space Semiconductor Market Segment Insights
-
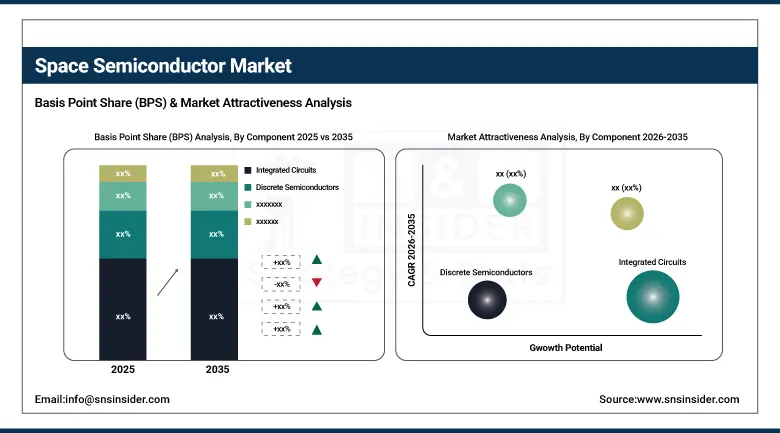
According to Component, Integrated Circuits dominated the market share in 2025 as; Memory Devices and Power Management ICs are among the fastest-growing component types.
-
In terms of Application, Satellites dominated the market share in 2025; Deep Space and Exploration Missions are the fastest-growing application.
-
By End-User, Government and Defense dominated the revenue share in 2025; Commercial is the fastest-growing end-user segment.
Space Semiconductor Market Segment Analysis
By Component: Integrated Circuits dominate, Memory Devices and Power ICs grow fastest
In 2025, Integrated Circuit (IC) emerged as the most prominent and held the maximum market share because of its vast application in space satellites' communication system, on-board computing, navigational system, avionics, and mission electronics in deep space. This product category encompasses radiation-tolerant processors, Field Programmable Gate Array (FPGA), Application Specific Integrated Circuit (ASIC), analog IC, timing IC, and interface IC that can endure extreme levels of radiation, temperature changes, and long-lasting missions in the harsh space environment.
Memory devices and power management integrated circuits (ICs) are expected to register the highest growth rate till 2035 owing to the growing need for data processing from satellites and growing complexity of onboard power systems. Present-day satellites need large-capacity radiation-resistant memory and efficient power management systems to perform fast communication, earth observations, autonomous operation, and long-term missions in outer space environments.
By Application: Satellites dominate, Deep Space and Exploration grows fastest
The Satellites segment dominated the market in 2025, supported by the rapid expansion of global satellite deployments across communication, Earth observation, navigation, weather monitoring, and defense applications. Growing low-Earth-orbit (LEO) satellite constellation projects and increasing satellite broadband demand are significantly increasing the consumption of space-qualified semiconductor components, including processors, memory devices, sensors, RF chips, and power management systems. Large commercial satellite networks are further accelerating high-volume procurement of radiation-tolerant semiconductor technologies for next-generation connectivity infrastructure.
Deep Space and Exploration Missions will see the most rapid expansion till 2035, owing to increased funding for lunar missions, Mars missions, planetary exploration, and interplanetary missions. There is an increasing need for robust radiation-tolerant semiconductor products that can withstand severe conditions of high radiation and fluctuating temperatures. Increasing activities relating to lunar economy development and commercial space exploration are also expected to aid in creating future growth prospects in the market.
By End-User: Government and Defense dominate, Commercial grows fastest
The Government and Defense sector continued to dominate as the major consumer group in the market in 2025 owing to escalating expenditures on military satellites, secure communications, missile detection technology, surveillance equipment, and deep space national security projects. Defense authorities and space institutions in the United States, Europe, Japan, and India still use advanced radiation-resistant semiconductors to perform essential tasks that require utmost dependability, robustness, and longevity in harsh space conditions.
The Commercial segment is projected to witness the fastest growth through 2035 due to the rapid expansion of low-Earth-orbit satellite constellations, satellite broadband services, Earth observation programs, and private space exploration activities. Rising commercial satellite launches are increasing demand for cost-efficient radiation-tolerant semiconductors, supporting large-scale manufacturing, lower deployment costs, and broader adoption of advanced space-based communication and connectivity solutions globally.
Regional Analysis
|
Region |
Major Country |
Share within Region (%) |
|---|---|---|
|
North America |
United States |
~82% |
|
Europe |
France |
~35% |
|
Asia Pacific |
Japan |
~38% |
|
Middle East & Africa |
Israel |
~36% |
|
Latin America |
Brazil |
~43% |
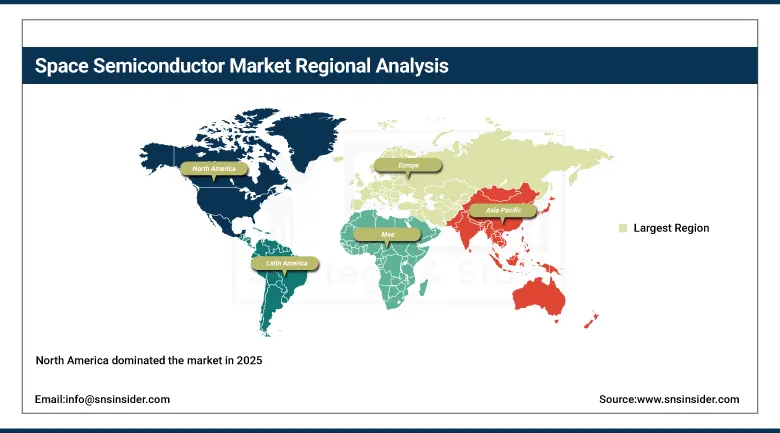
North America Space Semiconductor Market Insights
North America dominated the market in 2025, anchored by the United States which accounted for approximately 82% of North American revenues. U.S. market leadership is underpinned by the world's largest space programme ecosystem, the most comprehensive radiation-hardened semiconductor manufacturing industry, and the commercial space industry's extraordinary growth that is creating new commercial semiconductor demand at unprecedented scale. The concentration of leading rad-hard IC manufacturers, the DoD's trusted foundry procurement requirements, and NASA's extensive technology investment programme collectively sustain U.S. space semiconductor innovation leadership.
Get Customized Report as per Your Business Requirement - Enquiry Now
Asia Pacific Space Semiconductor Market Insights
Asia Pacific is a growing space semiconductor market, driven by Japan's world-class space technology industry with JAXA leading deep space exploration and Earth observation programmes, South Korea's rapidly expanding satellite manufacturing sector, China's ambitious space programme encompassing Beidou navigation, LEO communication constellations, and lunar and Mars missions, and India's increasingly capable ISRO space programme that has achieved historic Mars and lunar south pole landing milestones. Japan accounts for approximately 38% of Asia Pacific space semiconductor revenues through its precision engineering culture that produces some of the world's most reliable space-qualified electronic systems.
Europe Space Semiconductor Market Insights
Europe represents a significant and technically sophisticated market, driven by ESA's extensive science and Earth observation programme, the Galileo navigation satellite constellation, the Copernicus Earth observation programme, and the national space agencies of France, Germany, Italy, and the UK that collectively maintain one of the world's most active civil space programmes. France leads European space semiconductor revenues through Airbus Defence and Space and Thales Alenia Space's extensive satellite manufacturing operations, while Teledyne e2v in the UK is a world-leading supplier of space-grade imaging sensors and memory devices.
Middle East & Africa and Latin America Space Semiconductor Market Insights
MEA and Latin America are emerging markets, with Israel leading MEA through its world-class satellite imagery and defence electronics industries and its established space semiconductor design ecosystem. Brazil leads Latin American space semiconductor consumption through its domestic satellite programme and growing commercial space service adoption across the country's vast geographic monitoring and communication requirements.
Space Semiconductor Market Growth Drivers:
LEO satellites and deep-space missions are increasing demand for radiation-tolerant and radiation-hardened space semiconductors: The market will witness significant growth in the year 2025 owing to the exponential rise in the number of commercial LEO satellites. The growing investments made by governments in their respective deep space exploration projects will further contribute to the rising demand for semiconductors within the market. The commercial satellite providers are expected to create substantial demand for radiation-tolerant semiconductors that offer cost-efficiency and enable large-scale production of satellites, whereas government and military bodies will seek robust radiation-hardened semiconductors for missions to the moon, Mars, and beyond.
Recent technological advancements are also improving the performance of space-grade semiconductors through advanced process-node integration and radiation-hardening techniques. Semiconductor manufacturers are increasingly developing next-generation space-qualified processors, RF devices, and communication components that combine higher computing efficiency, durability, and reliability for modern satellite and deep-space applications.
Space Semiconductor Market Restraints
Radiation qualification testing cost and timeline, small market scale limiting commercial investment, and supply chain concentration in limited trusted foundries: A significant restraint on the market is the extraordinary cost and timeline of space qualification testing. The full military radiation hardness qualification including total ionising dose, single-event effects, and displacement damage testing across multiple temperature and bias conditions can require 12 to 18 months and hundreds of thousands of dollars per component type, creating barriers to new product introduction and limiting the pace of technology refresh in the market. The relatively small total market size, even including commercial constellation expansion, limits the commercial investment justification for establishing new radiation-hardened fabrication facilities that require billions of dollars in capital investment. The concentration of trusted radiation-hardened manufacturing in a limited number of government-approved foundries creates supply capacity constraints that can extend lead times during periods of high demand.
Space Semiconductor Market Opportunities
Commercial-grade space qualification frameworks, New Space economy expansion, and sovereign space capability investment across emerging space nations: The development of accelerated space qualification frameworks for commercial-off-the-shelf components, using shielding, redundancy, and software fault correction to achieve adequate mission reliability at lower qualification cost and timeline than traditional military radiation hardness approaches, represents the most significant market expansion opportunity for the space semiconductor sector. New Space economy services including orbital servicing, debris removal, space manufacturing, and space tourism create new semiconductor demand categories beyond traditional satellite and launch vehicle applications. Sovereign space programme investment by India, UAE, South Korea, Japan, and emerging space nations expanding their domestic satellite manufacturing capabilities represents growing international market demand that supplements the established North American and European procurement base.
Recent Developments:
-
2026: NASA partnered with Microchip Technology Inc. to develop next-generation High-Performance Spaceflight Computing (HPSC) processors for delivering significantly higher computing capability for lunar, Mars, and deep-space exploration missions while supporting radiation-hardened autonomous operations.
-
2026: STMicroelectronics N.V. expanded its space semiconductor business in response to rising demand from low-Earth-orbit satellite constellations, satellite broadband infrastructure, and advanced communication satellite systems requiring high-reliability semiconductor components.
-
2026: Infineon Technologies AG confirmed successful deployment of its radiation-hardened semiconductor technologies in advanced space exploration missions, strengthening demand for rad-hard power devices, RF semiconductors, and onboard memory solution.
Space Semiconductor Market Key Players
-
BAE Systems
-
Microchip Technology Inc.
-
Texas Instruments Inc.
-
Teledyne e2v
-
Cobham Advanced Electronic Solutions
-
Renesas Electronics Corporation
-
Infineon Technologies AG
-
STMicroelectronics N.V.
-
MACOM Technology Solutions
-
Mercury Systems Inc.
-
Honeywell International Inc.
-
Boeing Defense, Space & Security
-
Northrop Grumman Corporation
-
Xilinx Inc.
-
Lattice Semiconductor Corporation
-
Radiation Assured Devices
-
Data Device Corporation
-
CUI Global Inc.
-
Space Micro Inc.
-
SiGe Semiconductor
| Report Attributes | Details |
|---|---|
| Market Size in 2025 | USD 2.81 Billion |
| Market Size by 2035 | USD 5.03 Billion |
| CAGR | CAGR of 6.00% From 2026 to 2035 |
| Base Year | 2025 |
| Forecast Period | 2026-2035 |
| Historical Data | 2022-2024 |
| Report Scope & Coverage | Market Size, Segments Analysis, Competitive Landscape, Regional Analysis, DROC & SWOT Analysis, Forecast Outlook |
| Key Segments | • By Component (Integrated Circuits, Discrete Semiconductors, Sensors, Optoelectronics, Memory Devices, Others) • By Application (Satellites, Launch Vehicles, Deep Space and Exploration Missions, Rovers and Landers, Others) • By End-User (Government and Defense, Commercial) |
| Regional Analysis/Coverage | North America (US, Canada), Europe (Germany, UK, France, Italy, Spain, Russia, Poland, Rest of Europe), Asia Pacific (China, India, Japan, South Korea, Australia, ASEAN Countries, Rest of Asia Pacific), Middle East & Africa (UAE, Saudi Arabia, Qatar, South Africa, Rest of Middle East & Africa), Latin America (Brazil, Argentina, Mexico, Colombia, Rest of Latin America). |
| Company Profiles | BAE Systems, Microchip Technology Inc., Texas Instruments Inc., Teledyne e2v, Cobham Advanced Electronic Solutions, Renesas Electronics Corporation, Infineon Technologies AG, STMicroelectronics N.V., MACOM Technology Solutions, Mercury Systems Inc., Honeywell International Inc., Boeing Defense, Space & Security, Northrop Grumman Corporation, Xilinx Inc., Lattice Semiconductor Corporation, Radiation Assured Devices, Data Device Corporation, CUI Global Inc., Space Micro Inc., SiGe Semiconductor |
| Company Profiles | BAE Systems, Northrop Grumman, Honeywell Aerospace, STMicroelectronics, Microchip Technology, Texas Instruments, Xilinx (AMD), Teledyne Technologies, Infineon Technologies, Cobham Advanced Electronic Solutions, Renesas Electronics Corporation, Analog Devices Inc., Boeing, Lockheed Martin, Raytheon Technologies, L3Harris Technologies, CAES (Cobham), RUAG Space, Qorvo and Skyworks Solutions Inc. |
Frequently Asked Questions
Ans: North America dominated the market in 2025 due to strong U.S. space programs, advanced semiconductor manufacturing, and commercial space expansion.
Ans: Commercial is the fastest-growing end-user segment through 2035, driven by the extraordinary commercial space industry expansion encompassing LEO constellation operators, commercial Earth observation services, and emerging orbital economy services.
Ans: Satellites dominated the market in 2025 due to expanding communication, navigation, Earth observation, and defense satellite deployments globally.
Ans: Rapid commercial LEO satellite constellation expansion is driving unprecedented demand for high-volume radiation-tolerant space semiconductor solutions through 2035.
Ans: The market was valued at USD 2.81 billion in 2025.
Ans: The market is expected to grow at a CAGR of 6.00% from 2026 to 2035.
Get in Touch
